ISSN: 1992-8645 www.jatit.org E-ISSN: 1817-3195
NAÏVE BAYES CLASSIFIER AND FUZZY LOGIC SYSTEM
FOR COMPUTER – AIDED DETECTION AND
CLASSIFICATION OF MAMMAMOGRAPHIC
ABNORMALITIES
1MARJUN S. SEQUERA, 2SHERWIN A. GUIRNALDO, 3ISIDRO D. PERMITES JR.
1
Faculty, Dept. of Electro-Mechanical Technology, Mindanao University of Science and Technology, Philippines
2
Faculty, Dept. of Mechanical and Engineering Science Mindanao State University – Iligan Institute of Technology, Philippines
3
Oncologist, General Surgical Oncology, Mindanao Sanitarium and Hospital, Philippines E-mail: [email protected], [email protected], [email protected]
ABSTRACT
Breast cancer has been one of the major causes of death among women since the last ten years and it has become an emergency for the healthcare systems of industrialized nations. This disease became the most common cancer among women. Today, detecting breast cancer at its early stage is the primary factor that will increase the chances of survival and will provide more options for treatment. Because of this, the proponent develops a computer – aided detection and classification system for mammographic abnormalities. These abnormalities are limited only with microcalcification and masses. These abnormalities are classified as to benign or malignant.The system is divided into three modules: (1) detection of microcalcification, (2) classification of microcalcification and (3) classification of masses. The proponent used a Naïve Bayes Classifier in detecting microcalcification and Fuzzy Logic System for classification of the severity of abnormalities. The data used were obtained from the Mammographic Image Analysis Society (MIAS) database.
Keywords:Breast Cancer, Masses, Microcalcification, Computer – Aided System
1. INTRODUCTION
Breast cancer has been one of the major causes of death among women since the last ten years and it has become an emergency for the health care systems of industrialized nations. This disease became the most common cancer among women [1].
Today, detecting breast cancer at its early stage is the main factor that will increase the probabilities of survival and will provide more alternatives for treatment. The currently most effective method for detection of early phase breast cancer is screening mammography, breast x-ray imaging, where radiologists search abnormalities on mammograms visually [2].
However, analyzing a large number of cases is a repetitive task and causes visual fatigue for the radiologists and thus some abnormalities may be overlooked, resulting to radiologists failing to detect 10-30% of malignant findings [3]. And an
estimated two-thirds of these overlooked malignant abnormalities shows radiologists giving second thoughts on their evaluation [4]. Mammography has less than 35% positive predictive value (PPV), the percentage of lesions proven to be cancer using biopsy, due to the significant amount of overlapping appearances of malignant and benign abnormalities [5]. Avoiding benign biopsies would spare women anxiety, discomfort, and expense.
ISSN: 1992-8645 www.jatit.org E-ISSN: 1817-3195 It is in these systems, Computer-Aided Detection
(CAD) and Computer-Aided Diagnosis (CADx), the proponent aims to develop. The proponent sought to design a computer-aided detection and diagnosis system for breast cancer using computer imaging techniques and artificial intelligence methods. The system will also include report generation. Today, Breast Imaging Reporting and Data System (BI-RADS™) is the standard being used in describing abnormalities found on a mammogram. It is a standardized reporting that defines the final assessment categories to describe the radiologist’s degree of mistrust about the mammographic abnormality and an index of the likelihood of malignancy [6]. And also, BI-RADS™ gives recommended action to consider, routine follow up, short-term follow up, or biopsy, taking after the assessment.
Today, there is a number of computer aided detection and classification systems. But further developments are still required to improve computer –aided detection systems and their performance and there is a need to classify these detections in terms of abnormalities severity. Some studies showed results with high efficiency yet far from perfection. The highest sensitivity are 95% [7], 95% [8] and 100% [9] for microcalcification detection, mass classification and microcalcification classification respectively. For the microcalcification classification, though its sensitivity is 100%, its specificity is 85%.
And also, there does not exist a system capable of generating BI-RADS categories given a mammographic image.
The primary goal of the study is to develop an integrated system: computer-aided detection, computer-aided diagnosis and BI-RADS categorization. Detection is the localization of the abnormalities and classification is the characterization of the detected abnormalities in terms of probability of malignancy. This study also aims to show if there is improvements in the efficacy of computer – aided systems using the following techniques:
1. Naïve bayes classifier in detecting microcalcification.
2. Fuzzy logic system in classifying masses and microcalcifications as to benign or malignant.
2. CONCEPTUAL FRAMEWORK
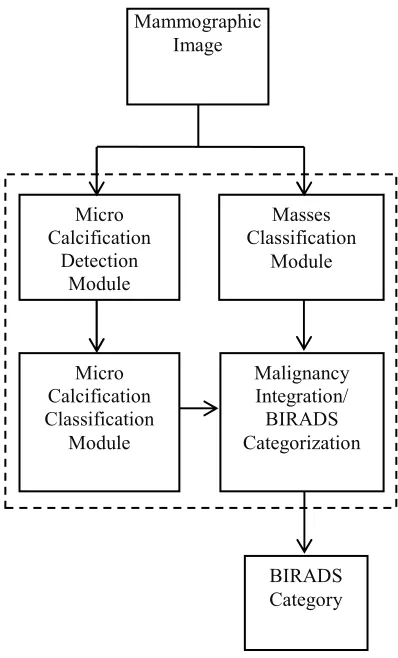
[image:2.612.317.516.257.586.2]The primary goal of the study is to develop a computer-aided detection and diagnosis system for breast cancer with BI-RADS categorization. The input of the system is a digital mammographic image and given the image the system will generate a BI-RADS category for that image. The system shown in figure 1 consists of four modules: (1) detection of micro calcifications, (2) classification of these microcalcifications, (3) detection of masses and classification and (4) integration of microcalcifications and masses severity and generate a general BI-RADS category.
Figure 1: Conceptual Framework Of The System
3. MICROCALCIFICATION DETECTION MODULE
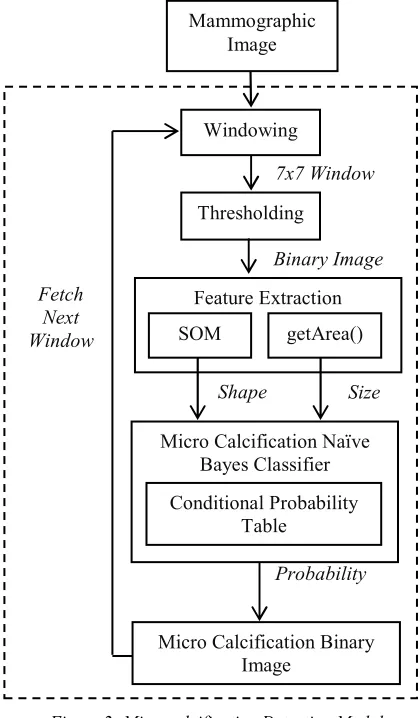
The first stage the system will undergo is the detection of microcalcifications in the mammographic image with the structure shown in figure 2. This is done by scanning the image using a small window. The window is simplified into a binary image by converting this grayscale window into a logical image through the process of thresholding. The binary image is evaluated and
Mammographic Image
BIRADS Category Micro
Calcification Detection
Module
Masses Classification
Module
Malignancy Integration/ BIRADS Categorization Micro
Calcification Classification
ISSN: 1992-8645 www.jatit.org E-ISSN: 1817-3195 features required for the next step are extracted.
The features are the shape and size of the microcalcification inside the window. Given the features, a naïve bayes classifier is used to determine its likelihood of being a microcalcification. If the probability is high, the window is represented with positive value in the new binary image with the size almost equal to the size of the input image and is the output of this module which will be used in its severity classification. If the probability is low, it is represented with zero. Then another window is fetched from the input image with an offset of one pixel and will undergo the same processes. These processes are repeated until the whole image size is evaluated.
Figure 2: Microcalcification Detection Module
3.1 Windowing
The purpose of windowing is to thoroughly scan the mammographic image for possible microcalcification. The dimension of the window is 7 by 7 pixels. This size of the window is based on
the largest possible size of a microcalcification. Microcalcifications associated with malignancy are often as small as 0.1 to 0.3 mm in diameter and usually less than 0.5 mm. However, microcalcification with diameter up to 2 mm may occasionally be seen. With the largest diameter of microcalcification, the window size to fit these microcalcifications is 2 x 2 mm. Since the data being evaluated is an image format with smallest unit in pixel, the dimension must be converted in terms of pixels. Using the formula:
Where , is the
length of the window side in pixel and then 2 x 2 mm window is equivalent to 7 x 7 pixel window.
3.2 Thresholding
The purpose of thresholding is to simplify the window which is in grayscale format into a simpler form for easier manipulation of the system. The window is converted into binary image consisting of logical values by comparing the values of every pixel in the window with a threshold value. If the values is lower than the threshold then it will be represented with zero in the binary image else one.
3.3 Feature Extraction
The feature required to evaluate a window for its likelihood of being a microcalcification are its shape and size. Since the next stage is a naïve bayes classifier, these features must be expressed in discrete values. The values for shape are square, round, coarse and irregular (see figure 3) and for size are small, medium and large.
Figure 3: Possible Shapes Of Microcalcification
To determine the shape of the microcalcification inside the window, a self-organizing map was used. The map has a dimension of 25 x 25 making it a map of 625-neuron map. The SOM was trained using 100,000 images of size 7 x 7 pixels randomly cropped from the image data with known microcalcification. The boundaries of the shapes within the map are shown in figure 4.
Round Square Coarse
Micro Calcification Naïve Bayes Classifier Feature Extraction
Size
SOM getArea()
Mammographic Image
Windowing
Thresholding
Micro Calcification Binary Image
Conditional Probability Table
Shape
Binary Image 7x7 Window
Probability Fetch
[image:3.612.89.299.284.643.2]ISSN: 1992-8645 www.jatit.org E-ISSN: 1817-3195
(a) (b)
[image:4.612.309.523.69.257.2]
(c) (d)
Figure 4: The Sample Hits Of The SOM For The Shapes (a) Square, (b) Round, (c) Coarse And (d) Irregular
To determine the size of the microcalcification, a simple algorithm was utilized. The system will just count the number of pixels with value of one. Table 1 shows the distribution of number of pixels in every size with its equivalent diameter in millimeters.
Table 1: Distribution Of Area In Pixels With Its Corresponding Diameter in Millimeter And Its
Representation In Size Discrete Values
Size Area (Pixels) Diameter (mm)
Min Max Min Max
Small 1 4 0.2985 0.5971
Medium 5 16 0.6676 1.1942
Large 17 49 1.2310 2.0898
3.4 Naïve Bayes Classifier
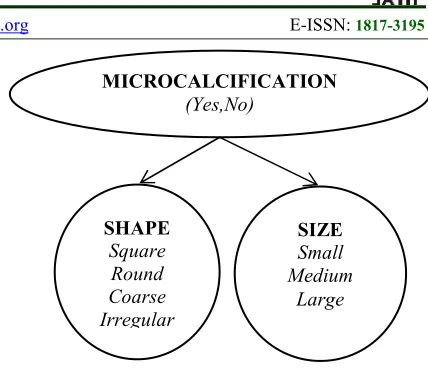
The extracted features from the window are used to determine its likelihood of being a microcalcification. The features are evaluated using a Naïve Bayes Classifier (NBC). It is a classifier that generates a probability of a certain set observations belonging to a class, in this case for a given shape and size being a microcalcification. Figure 5 shows the simple belief network of the classifier used.
Figure 5: The Belief Network Of The System Naïve Bayes Classifier
[image:4.612.94.318.73.243.2]In NBC, the results of the training are Conditional Probability Tables (CPTs). The NBC is trained using same 100,000 images of size 7 x 7 pixels used in training the SOM. After training the classifier, the Tables 2 and 3 are the CPTs for microcalcification given shape and size.
Table 2: Conditional Probability Table For Microcalcification Given Shape
Shape Microcalcification
No Yes
Square 99,372/99,373 = 1 85/627 = 0.1356 Round 0/99,373 = 0 516/627= 0.8330 Coarse 0/99,373 = 0 26/627 = 0.0415 Irregular 1/99,373 = 0 0/627 = 0.0000
Table 3: Conditional Probability Table For Microcalcification Given Size
Size Microcalcification
No Yes
Small 0/99,373 = 0.00 93/627 = 0.15 Medium 26,035/99,373 = 0.26 460/627 = 0.73 Large 73,338/99,373 = 0.73 74/627 = 0.12
The inference formula used with the system NBC network is:
The BNC was tested using the same data used during learning the CPTs. Given 100,000 data, the efficiency of BNC in classifying windows as to microcalcification or not is 91,670/100,000 or 91.67%.
MICROCALCIFICATION (Yes,No)
SHAPE Square
Round Coarse Irregular
SIZE Small Medium
[image:4.612.92.300.396.462.2]ISSN: 1992-8645 www.jatit.org E-ISSN: 1817-3195 4. MICROCALCIFICATION
CLASSIFICATION MODULE
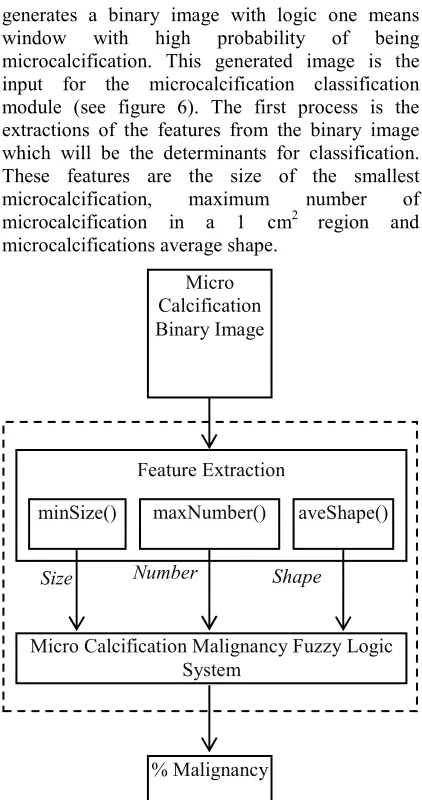
[image:5.612.89.300.138.538.2]The microcalcification detection module generates a binary image with logic one means window with high probability of being microcalcification. This generated image is the input for the microcalcification classification module (see figure 6). The first process is the extractions of the features from the binary image which will be the determinants for classification. These features are the size of the smallest microcalcification, maximum number of microcalcification in a 1 cm2 region and microcalcifications average shape.
Figure 6: Microcalcification Classification Module
A Matlab function regionprops() was used to determine the smallest size of microcalcification. The regionprops() has a capability to get all the areas of the objects within a binary image. To get the maximum number of microcalcification clustered within an area of 1 cm2, another window was used with a dimension of 1 cm2 or 37 x 37 pixels. It scans the image and utilized again the area property of regionprops() to count the number of microcalcification within the window. Every number of microcalcification for every window is documented in a matrix and after all the scanning is done, the largest number of microcalcification can be determined. As for the average shape of the
microcalcifications, the roundness of the microcalcification was considered. To get the roundness of an object within a region of interest, the formula is:
The points are generated using the boundaries property of regionprops(). These features are the crisp values for this module Fuzzy Logic (FL) classifier.
4.1 Microcalcification Malignancy Fuzzy Logic System
This classifier system is Takagi – Sugeno Fuzzy Logic that classifies the binary image of microcalcification generated by the microcalcification detection module in terms of percentage of malignancy. Given the size of the smallest microcalcification, largest number of microcalcification clustered within 1 cm2 and their average shape, the FLS generates a degree of malignancy. The FLS design is illustrated in figure 7 where and are the inputs Size, Shape and Number, , and are the membership functions for the linguistic values of linguistic variable Size (Small, Medium and Large), , and are for the linguistic values of linguistic variable Shape (Round, Coarse and Irregular), and are for the linguistic values of linguistic variable Number (Few and Many) and
[image:5.612.316.519.522.707.2]( ) are the rules.
Figure 7: Microcalcification Fuzzy Logic classifier network
Size
Numbe Shape
Degree Inputs Fuzzification Rules Defuzzification
Micro Calcification Binary Image
% Malignancy Feature Extraction
Size
minSize() maxNumber() aveShape()
Micro Calcification Malignancy Fuzzy Logic System
ISSN: 1992-8645 www.jatit.org E-ISSN: 1817-3195 4.2 Microcalcification FLS Membership
Functions
[image:6.612.313.523.202.427.2]The crisp values from the feature extractions are converted into fuzzy set through fuzzification process using the membership functions for FLS input and output. Shown in figures 8 – 10 are the membership functions of the linguistic variables Size, Shape and Number.
Figure 8: Microcalcification size membership function
[image:6.612.88.300.216.413.2]Figure 9: Microcalcification shape membership function
Figure 10: Microcalcification number membership function
4.3 Microcalcification FLS Rule Base
The lexicons used in the evaluation of microcalcification are size, shape and number. Microcalcifications associated with malignancy are often as small as 0.1 to 0.3 mm in diameter and usually < 0.5 mm. However, larger granular forms, up to 2 mm, and longer fine linear forms of microcalcifications, may occasionally be seen.The
[image:6.612.91.298.478.598.2]presence of a focal group of five heterogeneous microcalcifications in a volume of 1 cm3 of tissue has beenaccepted as suspicious. Small round to oval dense punctuate calcifications located in cystically dilated acini are considered benign lobular microcalcifications. Table 4 summarizes this knowledge in a FLS rule –based format.
Table 4: The Knowledge Base for Microcalcification Classification FLS
Size Shape Number Findings
R1: SM RO MA Malignant
R2: SM CO MA Malignant
R3: SM IR MA Malignant
R4: ME RO MA Malignant
R5: ME CO MA Malignant
R6: ME IR MA Malignant
R7: SM RO FE Benign
R8: SM CO FE Benign
R9: SM IR FE Benign
R10: ME RO FE Benign
R11: ME CO FE Benign
R12: ME IR FE Benign
R13: LA RO FE Benign
R14: LA RO MA Benign
R15: LA CO FE Benign
R16: LA CO MA Benign
R17: LA IR FE Benign
R18: LA IR MA Benign
5. MICROCALCIFICATION CLASSIFICATION MODULE
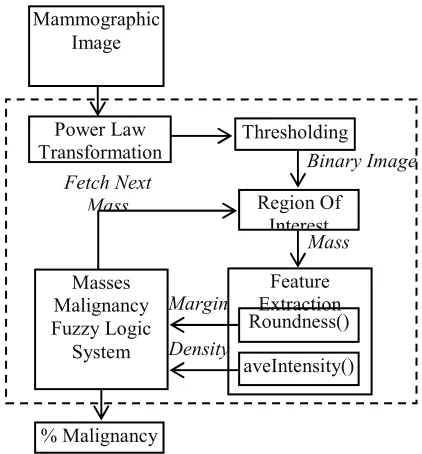
Following the detection of microcalcifications is the detection of masses and its classification. Figure 11 shows the structure of the mass classification module.
Figure 11: Mass classification module
Density Margin
Binary Image
Masses Malignancy Fuzzy Logic
System
Feature Extraction
aveIntensity() Roundness()
Region Of Interest Thresholding Power Law
Transformation Mammographic
Image
% Malignancy
Fetch Next Mass
[image:6.612.311.522.491.718.2]ISSN: 1992-8645 www.jatit.org E-ISSN: 1817-3195 Before processing of the digital mammographic
image, it is transformed first into binary image for easier processing of the system. The image is first enhanced using Power Law Transformation method below:
The enhanced image is segmented using a thresholding method similar to the microcalcification detection module. The result of the segmentation is a binary image containing the regions of interest of the masses. A region of interest is selected and features required by the classifier are extracted. These features are the density and the margin of the mass detected. The density is calculated using the equation below:
Margin is determined using the roundness formula (3). This module also used FLS as classifier. Using the features as the system input crisp values, it generates a degree of malignancy for that given mass. Then fetch again a new region of interest to classify. The process is repeated until all the detected masses are classified.
[image:7.612.314.524.230.334.2]5.1 Mass Malignancy Fuzzy Logic System
Figure 12: Mass Fuzzy Logic classifier network
This classifier is another Takagi – Sugeno FL system that classifies the masses detected by generating a degree of malignancy given the densities and margins of the masses. The FLS design is illustrated in figure 12 where and are the inputs Margin and Density, and are the membership functions for the linguistic values of
linguistic variable Margin (Circumscribed and Spiculated) and , and are for the linguistic values of linguistic variable Density (Low, Isodense and High) and ( ) are the rules.
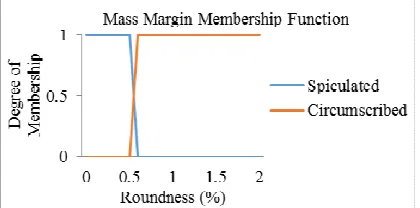
5.2 Mass FLS Membership Functions
[image:7.612.311.523.230.475.2]Shown in figures 13 and 14 are the membership functions of the linguistic variables Density and Margin.
Figure 13: Mass destiny membership function
Figure 14: Mass margin membership function
5.3 Mass FLS Rule Base
The lexicons used in the evaluation of masses are density and margin. The mammographic mass is a space – occupying lesion seen in two different projections. Mammographic analysis of the mass is based on its shape, density and margin. But in this study, shape is not included in margin is relative to its shape such as oval or round shape with circumscribed margin. Increasing spiculations increase the probability of malignancy. Assessment of the lesion margin adds important distinguishing information. Circumscribed lesions with sharp, distinct margins are mostly always benign. Table 5 summarizes this knowledge in a FLS rule –based format.
Margin ( )
)
Density
( ) Degree
[image:7.612.90.298.448.615.2]ISSN: 1992-8645 www.jatit.org E-ISSN: 1817-3195 Table 5: The Knowledge Base for Mass Classification
FLS
Findings Findings Findings
R1: SP LO Malignant
R2: SP IS Malignant
R3: SP HI Malignant
R4: CI LO Benign
R5: CI IS Benign
R6: CI HI Benign
6. BI – RADS CATEGORIZATION
The final stage of the system is the integration of the degrees of malignancy generated by the microcalcification classification module and mass classification module. This module is just a simple program that determines the highest malignancy between masses and microcalcifications. Then categorize the highest malignancy into BIRADS.
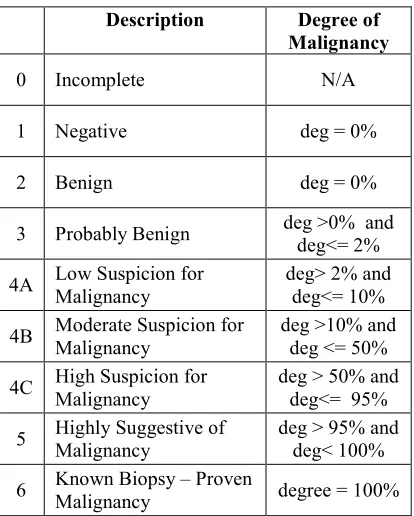
[image:8.612.311.522.433.567.2]The Breast Imaging Reporting Data System (BIRADS), a consortium of medical experts, was developed to improve the quality of mammography reporting and early breast cancer detection. The reporting system uses a standardized format for the mammographic report, noting available comparison films, breast tissue composition, a concise description of any significant findings and a final assessment with appropriate recommendations. The mammographic study is classified by BIRADS according to one of the decision categories shown in the table below.
Table 6: BI-RADS Assessment Categories
Description Degree of
Malignancy
0 Incomplete N/A
1 Negative deg = 0%
2 Benign deg = 0%
3 Probably Benign deg >0% and deg<= 2%
4A Low Suspicion for Malignancy
deg> 2% and deg<= 10%
4B Moderate Suspicion for Malignancy
deg >10% and deg <= 50%
4C High Suspicion for Malignancy
deg > 50% and deg<= 95%
5 Highly Suggestive of Malignancy
deg > 95% and deg< 100%
6 Known Biopsy – Proven
Malignancy degree = 100%
The system can only generate categories 1 – 5. The system excludes categories 0 and 6 because the system has no capability of evaluating if the image is incomplete and that to prove if the given abnormality is malignant is only possible through biopsy.
7. RESULTS AND DISCUSSION
During the testing of the system, only 55 out of 322 images from the MIAS are used because the system is limited only with the following abnormalities: microcalcifications, circumscribed masses and spiculated masses. The efficiency of the modules and the system as a whole is determine through comparison between the system result with that of the MIAS. The results of mass classification and microcalcification detection and classification modules are compared with MIAS observations (see section 7.2 – 7.4). The results of the system are also compared with the MIAS final diagnosis (see section 7.5).
7.1 The System Graphical User Interface Design
The system is a graphical user interface with figure divided into three panels, mammographic image, masses and microcalcification as shown in figure 15.
Figure 15:The graphical user interface of the system
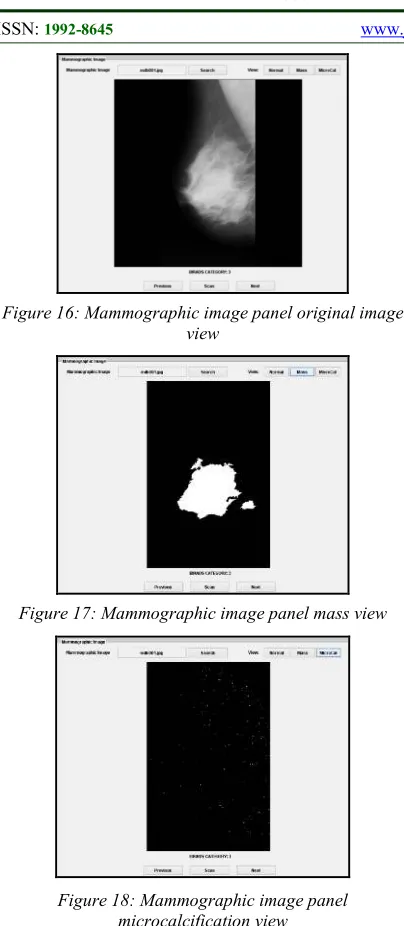
The mammographic image panel (see figure 16) is showing the current mammography image. It has displayed the final assessment in terms of BIRADS category right below the image. Initially, this assessment has a value of N/A if the image is not yet evaluated. The panel has three navigation buttons for viewing the previous image or the next image and the scan to start the image evaluation. It has also three viewing modes, mammographic original image and the mass and microcalcification binary images (see figures 16 – 18).
Mammographic Image Panel
Mass Panel
[image:8.612.92.299.469.727.2]ISSN: 1992-8645 www.jatit.org E-ISSN: 1817-3195
Figure 16: Mammographic image panel original image view
Figure 17: Mammographic image panel mass view
Figure 18: Mammographic image panel microcalcification view
The mass panel below shows a list of masses detected. By selecting from the list, it shows the mass image, its margin, density and degree of malignancy.
Figure 19: The system mass panel
The microcalcification panel below displays the size of its smallest microcalcification, their average shape and maximum number of microcalcification clustered within 1 cm2 region.
Figure 20: The system microcalcification panel
7.2 Efficiency of Microcalcification Detection Module
The module is tested using 100,000 mix 7x7 crop images of known microcalcifications, normal tissue and masses. The crop images are randomly cropped from random mammographic images. The result of the testing is 91,670/100,000 hits or 91.67%.
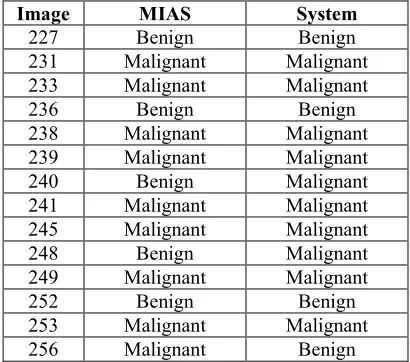
7.3 Efficiency of Microcalcification Classification Module
[image:9.612.93.295.67.530.2]The efficiency of this module is determined by comparison between the system generated a degree of malignancy and the MIAS severity of abnormalities of images with known microcalcifications shown in the table 7. The system successfully detected the microcalcifications but fail to classify some microcalcifications. Not all classifications of the system match with the classification from MIAS. Among the MIAS malignant microcalcification, the system classifies them as malignant while all MIAS benign microcalcifications are classified by the system as malignant also due to additional detections. But scanning only the region specified by MIAS, the system yielded a satisfying result. The efficiency, therefore of the microcalcification classification module is 18/23 or 78.26%.
Table 7: Comparison Between System and MIAS Severity of Abnormalities - Microcalcification
Image MIAS System
209 Malignant Malignant
211 Malignant Malignant
213 Malignant Malignant
216 Malignant Malignant
218 Benign Benign
219 Benign Malignant
222 Benign Malignant
223 Benign Benign
[image:9.612.135.252.590.709.2]ISSN: 1992-8645 www.jatit.org E-ISSN: 1817-3195 Table 7: Comparison Between System and MIAS Severity
of Abnormalities – Microcalcification (Cont.)
Image MIAS System
227 Benign Benign
231 Malignant Malignant
233 Malignant Malignant
236 Benign Benign
238 Malignant Malignant
239 Malignant Malignant
240 Benign Malignant
241 Malignant Malignant
245 Malignant Malignant
248 Benign Malignant
249 Malignant Malignant
252 Benign Benign
253 Malignant Malignant
256 Malignant Benign
7.4 Efficiency of Mass Classification Module
[image:10.612.93.298.120.301.2] [image:10.612.93.301.484.727.2]The efficiency of this module is determined also by comparison between the generated a degree of malignancy by the system and the MIAS severity of abnormalities of images with known masses shown in the table 8. Still, not all classifications of the system match with the classification from MIAS. Among the MIAS malignant masses, the some of the masses are classified by the system correctly. The efficiency, therefore of the masses classification module is 21/32 or 65.63%.
Table 8: Comparison Between System and MIAS Severity of Abnormalities - Masses
Image MIAS System
1 Benign Malignant
2 Benign Benign
5 Benign Benign
10 Benign Benign
12 Benign Benign
15 Benign Benign
19 Benign Malignant
21 Benign Benign
23 Malignant Malignant
25 Benign Malignant
28 Malignant Benign
69 Benign Benign
80 Benign Benign
91 Benign Benign
132 Benign Malignant
141 Malignant Benign
142 Benign Benign
148 Malignant Malignant
178 Malignant Malignant
Table 8: Comparison Between System and MIAS Severity of Abnormalities – Masses (Cont.)
Image MIAS System
179 Malignant Benign
181 Malignant Malignant
184 Malignant Malignant
186 Malignant Malignant
190 Benign Benign
191 Benign Benign
193 Benign Malignant
198 Benign Malignant
199 Benign Malignant
202 Malignant Malignant
204 Benign Benign
244 Benign Benign
315 Benign Malignant
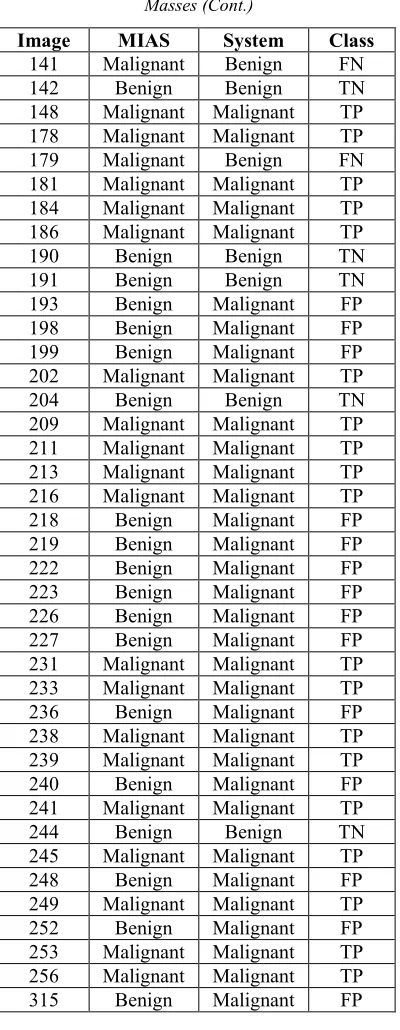
7.5 Efficiency of the System
The metrics used to determine the performance of the system are sensitivity and specificity. Before calculating these metrics, the result must be tabulated using confusion matrix containing the number of true and false positive (TP and FP) and true and false negative (TN and FN). Basing on the confusion matrix, the metrics are calculated using the equations below:
Table 9: Comparison Between System and MIAS Severity of Abnormalities – Microcalcification and
Masses
Image MIAS System Class
1 Benign Malignant FP
2 Benign Benign TN
5 Benign Benign TN
10 Benign Benign TN
12 Benign Benign TN
15 Benign Benign TN
19 Benign Malignant FP
21 Benign Benign TN
23 Malignant Malignant TP
25 Benign Malignant FP
28 Malignant Benign FN
69 Benign Benign TN
80 Benign Benign TN
91 Benign Benign TN
ISSN: 1992-8645 www.jatit.org E-ISSN: 1817-3195 Table 9: Comparison Between System and MIAS
Severity of Abnormalities – Microcalcification and Masses (Cont.)
Image MIAS System Class
141 Malignant Benign FN
142 Benign Benign TN
148 Malignant Malignant TP 178 Malignant Malignant TP
179 Malignant Benign FN
181 Malignant Malignant TP 184 Malignant Malignant TP 186 Malignant Malignant TP
190 Benign Benign TN
191 Benign Benign TN
193 Benign Malignant FP
198 Benign Malignant FP
199 Benign Malignant FP
202 Malignant Malignant TP
204 Benign Benign TN
209 Malignant Malignant TP 211 Malignant Malignant TP 213 Malignant Malignant TP 216 Malignant Malignant TP
218 Benign Malignant FP
219 Benign Malignant FP
222 Benign Malignant FP
223 Benign Malignant FP
226 Benign Malignant FP
227 Benign Malignant FP
231 Malignant Malignant TP 233 Malignant Malignant TP
236 Benign Malignant FP
238 Malignant Malignant TP 239 Malignant Malignant TP
240 Benign Malignant FP
241 Malignant Malignant TP
244 Benign Benign TN
245 Malignant Malignant TP
248 Benign Malignant FP
249 Malignant Malignant TP
252 Benign Malignant FP
253 Malignant Malignant TP 256 Malignant Malignant TP
315 Benign Malignant FP
Basing on in table 9, the resulting confusion matrix is tabulated below.
Table 10: Confusion Matrix
True False
Positive 19 12
Negative 20 4
Basing on the confusion matrix and using equations 7 and 8, the system sensitivity and specificity are:
The system sensitivity of 82.61% means that most of the MIAS malignant findings were classified correctly by the system as malignant. And the system specificity of 62.50% means that more than half of the MIAS benign findings were classified as benign.
8. CONCLUSION
The objectives of the study are to develop a computer-aided detection, computer-aided diagnosis and BI-RADS generation and integrate these systems into one. The system is able to detect microcalcifications and circumscribed and spiculated masses and is able to classify some of these abnormalities into the degree of malignancy. The system is also capable categorizing the mammographic image into BI-RADS.
The system was tested using the data provided by MIAS. The system efficiency on detecting microcalcifications using the Naïve Bayes classifier and masses using conventional programming is high about 91.67% and 100% respectively. The meaning of these is that the system is efficient enough in detecting these abnormalities. As for the microcalcification detection, the efficiency rate is lower than that of the study of Yoshida et al. (1996) which is 95%.
And the system efficiency on classifying these abnormalities using a fuzzy logic system is 78.26% for microcalcifications and 65.63% for the masses. The efficiency is low for both microcalcification and masses classifications compare to that of the studies of Rangayyan et al. (1997) which is 95% and Kallergi (2004) which is 100% for microcalcification and mass classification respectively.
[image:11.612.95.295.127.627.2]ISSN: 1992-8645 www.jatit.org E-ISSN: 1817-3195 Based on the results using the available images
from MIAS, it can be concluded that using Naïve Bayes Classifier for detecting microcalcification and Fuzzy Logic System to classify microcalcifications and masses as to benign or malignant would yield to lower efficiency rate. This maybe because the membership functions of the FLS is not tuned enough due to limited number of images used.
9. RECOMMENDATIONS
The membership functions of the fuzzy logic system are not tuned enough due to the lack of training data available. The number of images available is not enough to have a more converge membership functions resulting to a system with not so high specificity. In line thereof, for the researchers that would like to conduct further study on computer – aided medical systems using similar methods used in this research or a different approach, more data is recommended.
REFERENCES:
[1] Basha, S. S., & Prasad, K. S. (2009). Automatic detection of breast cancer mass in mammograms using morphological operators and fuzzy c – means clustering.Journal of Theoretical & Applied Information Technology, 5(6).
[2] Bird, R. E., Wallace, T. W., & Yankaskas, B. C. (1992). Analysis of cancers missed at screening mammography.Radiology, 184(3), 613-617.
[3] Geiger, M. L. (1999). Computer-aided diagnosis, AAPM/RSNA Categorical Course in Diagnostic Radiology Physics: Physical Aspects of Breast Imaging–Current and Future Considerations. Haus A. and Yaffe M., eds, 249-272.
[4] Kopans, D. B. (1992). The positive predictive value of mammography.AJR. American journal of roentgenology, 158(3), 521-526. [5] Lee, C. H. (2002). Screening mammography:
proven benefit, continued
controversy.Radiologic Clinics of North America, 40(3), 395-407.
[6] Orel, S. G., Kay, N., Reynolds, C., & Sullivan, D. C. (1999). BI-RADS Categorization As a Predictor of Malignancy 1. Radiology, 211(3), 845-850.
[7] Yoshida, H., Doi, K., Nishikawa, R. M., Giger,
M. L., & Schmidt, R. A. (1996). An improved computer-assisted diagnostic scheme using wavelet transform for detecting clustered
microcalcifications in digital
mammograms. Academic Radiology, 3(8),
621-627.
[8] Rangayyan, R. M., El-Faramawy, N. M.,
Desautels, J. L., & Alim, O. A. (1997).
Measures of acutance and shape for
classification of breast tumors. IEEE
Transactions on medical imaging, 16(6), 799-810.
[9] Kallergi, M. (2004). Computer-aided diagnosis
of mammographic microcalcification