IJPSR (2013), Vol. 4, Issue 8 (Research Article)
Received on 10 April, 2013; received in revised form, 10 May, 2013; accepted, 27 July, 2013; published, 01 August, 2013
DEVELOPMENT AND VALIDATION OF SIMULTANEOUS ESTIMATION FOR PIPERINE AND GALLIC ACID IN ZEAL HERBAL GRANULES BY HPTLC METHOD
A. Shah 1, N. Gurav*2, B. Solanki 2, P. Patel 2 and J. Modi 1
Parul Institute of Pharmacy and Research 1, P.O. Limda, Tal. Waghodia- 391 760 Vadodara, Gujarat, India
Vasu Research Center, A Division of Vasu Healthcare Pvt. Ltd. 2, 896/A GIDC, Makarpura, Vadodara, Gujarat, India
ABSTRACT: A simple HPTLC method has been developed for the
estimation of Gallic acid and Piperine in methanolic extract of Zeal herbal granules [ZHG], a Polyherbal formulation. The separation was performed on TLC aluminum plates precoated with silica gel 60 F254,
good separation was achieved in the mobile phase of toluene: ethyl acetate: formic acid (11: 15: 1v/v/v) and densitometry determination of Gallic acid (0.50 Rf) and Piperine (0.70 Rf) was carried out at single
wavelength scanning at 254 nm. The method validated as per ICH guideline, shows regression co-efficient value for Piperine 0.9992 and 0.9979 for Gallic acid in range of 40-90 µg/mL Recovery of Piperine and Gallic acid in final product found in range of 98-102%. Precision study (interday & intraday) showed that the relative standard deviation is less than 2%, showing method is well precise. Quantification study shows 0.23 % w/w of Piperine and 0.37 % w/w of Gallic acid in ZHG. Present study shows that developed method is simple, precise, specific, robust and accurate, and could find application in routine quality-control analysis of Polyherbal formulation.
INTRODUCTION: The plants Piper longum
(Pipli), Piper nigrum (maricha), are universally known and widely cultivated all over warm part of India. The main active constituents of Piper longum
and piper nigrum are Piperine (4-5%) and volatile oil (1%) 1. These plants are mainly used as analgesic, used in cough and congestion, antiseptic, antispasmodic, aphrodisiac, carminative, diuretic, febrifuge, laxative, rubefacient, stomachic, tonic 2-4. Another plant, Emblica officinalis (amala),
Terminalia balerica (baheda) are also widely cultivated plants of India.
QUICK RESPONSE CODE
DOI:
10.13040/IJPSR.0975-8232.4(8).3175-83
Article can be accessed online on: www.ijpsr.com
DOI link: http://dx.doi.org/10.13040/IJPSR.0975-8232.4(8).3175-83
They are mainly used as anti-oxidant, it increases the immunity power to overcome diseases, antacid, useful in dyspepsia, constipation, piles, enlarged liver and spleen. It is considered as one of the foremost rejuvenative drugs imparting a long healthy life and weight gain. Gallic acid is the main constituent of these plants which shows immune modulating activity 5.
This Zeal herbal granules used for common cough, cold, chronic congestion, respiratory infection contains these plants as source of Piperine and Gallic acid and also contains Glyzirrhiza glabra (Yashtimadhu), Cinnamonum tamala (Tamala),
Adhatoda vasica (Vasaka), Ocimum sanctum
(Tulsi), Zingiber officinalis (Shunthi),
Solanumxanthocarpam (Kantkari), Cinnamonum zeylanicum (Twak), Curcuma longa (Haridra),
Cassia occidentalis (Kasmard), Sarcostema acidum
(Soma), Tylophora asthmatica (Antmool), Mentha
Keywords:
HPTLC, Piperine, Gallic acid, single wavelength scanning, simultaneous
estimation, Zeal Herbal Granules Correspondence to Author:
Nilesh Gurav
Vasu Research Center, A Division of Vasu Healthcare Pvt. Ltd., 896/A GIDC, Makarpura, Vadodara, Gujarat, India
sylvestris (Pudina), Peppermint oil. So, the main objective of the present work was to develop an accurate, specific, precise and reproducible method for the estimation of Piperine and Gallic acid from these Zeal herbal granules.
Literature review reveals that there are few methods available for estimation of Piperine and gallic acid individually and simultaneously but no method is there which shows single wavelength scanning for simultaneous estimation of Piperine and gallic acid. In addition reported mobile phases did not show resolved spectra for Piperine and gallic acid in zeal herbal granules.
Therefore an attempt has been made to develop the method which can simultaneously resolve Piperine and gallic acid at single wavelength densitometry 6-12
.
MATERIALS AND METHODS:
Marker, solvents and raw materials: Piperine standard was isolated at Vasu Research Centre, A division of Vasu Healthcare Pvt. Ltd., Vadodara and checked the purity against Piperine standard (99.15% pure) procured from THS (Total Herbal solution), Mumbai.
Gallic acid was procured from HI Media laboratories Pvt Ltd. Solvents were procured from Merck specialties Pvt. Ltd. Mumbai. Zeal herbal granules and other raw materials were procured from Vasu Healthcare Pvt. Ltd.
Equipment: A Camag HPTLC system comprising of Linomate V automatic sample applicator, Hamilton Syringe 100µL, Camag TLC Scanner-4, Camag WinCATS software, Camag Twin trough chamber and stationary phase precoated Merck silica gel 60 F254 were used.
Standard Piperine solution (1000 µg/mL): 10 mg of standard Piperine was weighed accurately and diluted up to 10mL with methanol. This solution was used as standard stock solution.
Standard Gallic acid solution (1000 µg/mL): 10 mg of standard Gallic acid was weighed accurately and diluted up to 10mL with methanol. This solution was used as standard stock solution.
Working standard for calibration curve: 5mL aliquot from 1000µg/mL was transferred to 50mL
volumetric flask and made up to the mark with methanol to prepare 100µg/mL working standard for both Gallic acid and Piperine. Both 100µg/mL working standards were mixed in equal proportion. From this working standard mixture, aliquots (4, 5, 6, 7, 8, 9mL) were pipetted out and diluted up to 10mL to make 40µg/mL, 50 µg/mL, 60 µg/mL, 70 µg/mL, 80 µg/mL, 90 µg/mL respectively.
Sample solution: Accurately weighed ZHG (275 mg) in 25mL iodine flask and add 10mL methanol to it. Refluxed for 30 minutes on water bath to dissolve it. After reflux, let it cooled down and filter through Whatman No. 1 filter paper. This was applied as test solution.
Optimization and selection of Mobile Phase: Based on sample solubility, stability and suitability various mobile phase compositions were tried to get a good resolution and sharp peaks. The standard and sample solution were run in various mobile phases, showed that Toluene, Ethyl acetate and Formic acid in proportion of 11: 15: 1(v/v/v) was best suitable for Zeal Herbal Granules.
Optimized Chromatographic condition:
Stationary phase : HPTLC precoated, silica gel 60 F254 (Merck)
TLC plate thickness : 0.2 mm Mode of application : Band Band width : 8 mm Application volume : 6µL Separation technique : Ascending Temperature : 25 ± 3° Saturation time : 30 min. Migration distance : 80 mm Measurement mode : Absorbance Slit dimension : 6.0 x0.45mm
Scanning mode : Single level Scanning Scanning Wavelength : 254 nm
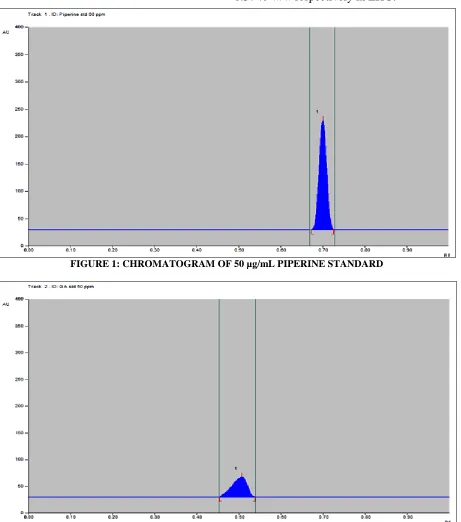
Validation of the method: ICH guidelines were followed for the validation of analytical method developed for system suitability, specificity, linearity, precision, and accuracy and robustness13. RESULTS AND DISCUSSION: An attempt to optimize mobile phase, toluene-ethyl acetate-formic acid mixtures in different proportions were investigated. Use of toluene-ethyl acetate-formic acid 11: 15: 1(v/v/v) resulted in sharp, well defined Piperine peak at Rf 0.70±0.02 (Figure 1) and Gallic
[image:3.612.80.541.191.713.2]acid peak at Rf 0.50±0.02 (Figure 2). ZHG showed the presence of both actives (Figure 3). Figure 4 represented the overlay spectra of standards and ZHG. Well defined bands were obtained only when the chamber was saturated with the mobile phase for 30 min at room temperature before plate development. Peak purity was established through spectral detection of particular peak (figure 5 for Gallic Acid and figure 6 for Piperine). Piperine and gallic acid content was found to be 0.23 % w/w and 0.37 % w/w respectively in ZHG.
FIGURE 1: CHROMATOGRAM OF 50 µg/mL PIPERINE STANDARD
FIGURE 3: CHROMATOGRAM OF ZEAL HERBAL GRANULES SHOWING GALLIC ACID AND PIPERINE GA- Gallic acid in ZHG, P- Piperine in ZHG
FIGURE 4: OVERLAY CHROMATOGRAM OF STANDARDS AND ZHG.
[image:4.612.116.498.527.745.2]GA – Gallic acid, P – Piperine 1 – Spectra of Piperine standard, 2 – Spectra of Gallic acid standard, 3 – Spectra of ZHG
FIGURE 6: PEAK PUURITY FOR PIPERINE IN STANDARD AND ZHG Peak purity spectra of 1 – Piperine standard, 2 – Piperine in ZHG Method validation results:
System Suitability: 6µL of 50µg/mL working standard mixture of Piperine and Gallic acid
[image:5.612.112.503.533.743.2]solution were applied under optimized chromatographic conditions to evaluate the suitability of system. The values of system suitability parameters were shown in Table 1. TABLE 1: SYSTEM SUITABILITY DATA
Conc. (µg/mL)
Gallic Acid Piperine
Rf PA (AU) % RSD Rf PA (AU) % RSD
Rf PA Rf PA
50 0.50 466.5
1.8 0.98
0.71 1667.5
1.15 1.45
50 0.49 468.5 0.72 1677.0
50 0.49 462.5 0.73 1711.0
50 0.49 462.5 0.72 1681.6
50 0.51 456.6 0.73 1725.8
µg-microgram, mL-milliliter, Rf- Retardation Factor, AU- Area Under Curve, RSD-Relative Standard Deviation, Conc
.-Concentration, PA- Peak Area.
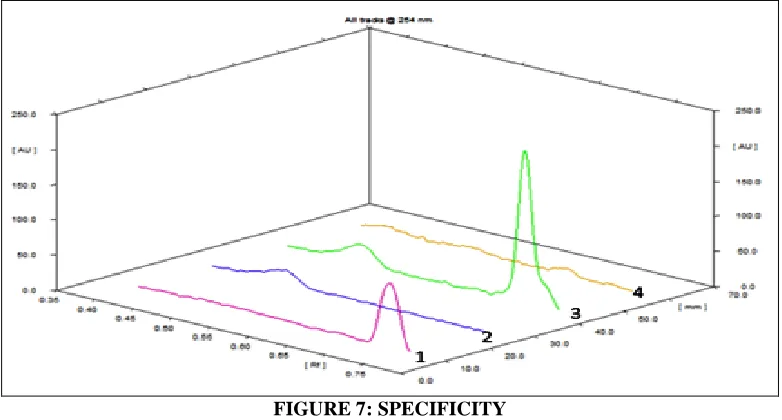
Specificity: Specificity of the HPTLC method was demonstrated by the separation of the analytes from other potential components such as impurities, degradants or Excipients. A volume of 6μL of working placebo sample (Figure 7) solution was
applied and the chromatogram was recorded. No peaks were found at retention time of Piperine and Gallic acid. Hence, the proposed method was specific for Piperine and Gallic acid.
FIGURE 7: SPECIFICITY
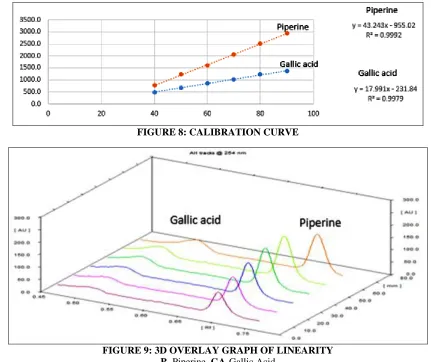
Linearity: The linearity of calibration curve in pure solution, over the concentration range of 40-90µg/mL through proposed HPTLC method was carried out and regression co-efficient was obtained
0.9992 & 0.9979 (Figure 8) for Piperine and Gallic acid respectively. The data are represented in Table 2 and overlay spectra of linearity are shown in (Figure 9).
TABLE 2: LINEARITY DATA FOR MIXTURE OF STANDARDS
Conc. (µg/mL) GA P
Rf PA(AU) Rf PA (AU)
40 0.51 473.0 0.71 773.6
50 0.51 678.0 0.70 1235.6
60 0.51 850.0 0.69 1601.9
70 0.51 1030.0 0.69 2066.8
80 0.50 1228.3 0.69 2519.7
90 0.50 1366.2 0.68 2937.2
µg- microgram, mL- milliliter, Rf- Retardation Factor, AU- Area under Curve, Conc.-Concentration, P- Piperine, GA- Gallic
[image:6.612.89.520.242.604.2]Acid, PA- Peak Area.
FIGURE 8: CALIBRATION CURVE
FIGURE 9: 3D OVERLAY GRAPH OF LINEARITY P- Piperine, GA-Gallic Acid
Accuracy: Recovery studies were performed by standard addition method at three different levels (80%, 100% and 120% of final concentration).A known amount of standard pure marker was added
pre-analyzed sample powder and the sample was then analyzed by proposed method. Satisfactory results achieved for the accuracy, which are shown in Table 3 & 4.
TABLE 3: ACCURACY DATA FOR PIPERINE
Conc. in ZHG(µg/mL) STD spiked (µg/mL) Amount recovered (µg/mL) % Recovery
49 40 89.38 102.00
49 50 97.50 100.96
49 60 108.24 101.90
TABLE 4: ACCURACY DATA FOR GALLIC ACID
Conc. In ZHG (µg/mL) STD spiked (µg/mL) Amount recovered (µg/mL) %Recovery
16 40 55.78 99.67
16 50 64.78 98.20
16 60 76.57 100.79
µg-microgram, mL-milliliter, STD-Standard, Conc.-Concentration, ZHG- Zeal Herbal Granules
Precision: The precision of the method was determined by interday and intraday precision. Intraday precision was determined by applying three sets of different concentrations in the same
day. Peak area was measured and RSD was calculated which is shown in Table 5 for Piperine and Table 6 for Gallic acid.
TABLE 5: INTRADAY PRECISION DATA FOR PIPERINE.
Conc. (µg/mL) PA (AU) SD %RSD
Set 1 Set 2 Set 3 AVG
40 773.60 780.0 781.00 776.07 4.0 0.5
50 1235.60 1240.2 1241.00 1237.40 2.9 0.2
60 1601.90 1600.0 1605.00 1602.93 2.5 0.2
70 2066.80 2067.5 2065.00 2066.20 1.3 0.1
80 2519.70 2520.0 2522.00 2520.47 1.3 0.0
90 2937.20 2940.0 2942.00 2938.80 2.4 0.1
µg-microgram, mL-milliliter, PA- Peak Area, AU- Area under Curve, Conc. - Concentration, AVG-Average, SD-Standard Deviation, RSD-Relative Standard Deviation.
TABLE 6: INTRADAY PRECISION DATA FOR GALLIC ACID.
Conc. (µg/mL) PA(AU) SD %RSD
Set 1 Set 2 Set 3 AVG
40 473.00 480.00 475.00 476.00 3.61 0.76
50 678.00 675.00 680.00 677.67 2.52 0.37
60 850.00 855.00 856.00 853.67 3.21 0.38
70 1030.00 1032.00 1028.00 1030.00 2.00 0.19 80 1228.30 1230.00 1230.50 1229.60 1.15 0.09 90 1366.20 1370.00 1365.00 1367.07 2.61 0.19
µg-microgram, mL-milliliter, PA- Peak Area, AU- Area under Curve, Conc. - Concentration, AVG-Average, SD-Standard Deviation, RSD-Relative Standard Deviation.
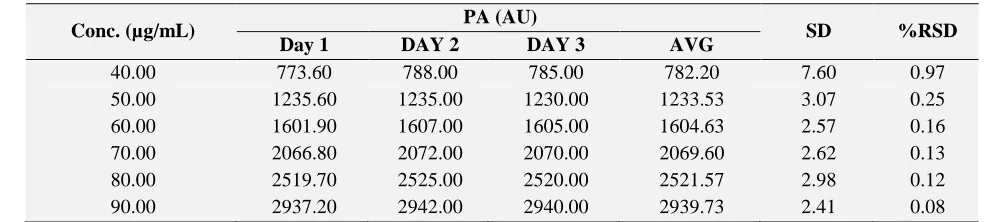
Inter-day precision was determined by applying three sets of different concentrations on three different days. Peak area was measured and RSD
[image:7.612.55.552.558.669.2]was calculated. Results are shown in Table 7 for Piperine and Table 8 for Gallic acid.
TABLE 7: INTERDAY PRECISION DATA FOR PIPERINE
Conc. (µg/mL) PA (AU) SD %RSD
Day 1 DAY 2 DAY 3 AVG
40.00 773.60 788.00 785.00 782.20 7.60 0.97 50.00 1235.60 1235.00 1230.00 1233.53 3.07 0.25 60.00 1601.90 1607.00 1605.00 1604.63 2.57 0.16 70.00 2066.80 2072.00 2070.00 2069.60 2.62 0.13 80.00 2519.70 2525.00 2520.00 2521.57 2.98 0.12 90.00 2937.20 2942.00 2940.00 2939.73 2.41 0.08
TABLE 8: INTERDAY PRECISION DATA FOR GALLIC ACID Conc.
(µg/mL)
PA (AU)
SD %RSD
Day 1 DAY 2 DAY 3 AVG
40 473.00 480.00 480.00 477.67 4.04 0.85
50 678.00 690.00 685.00 684.33 6.03 0.88
60 850.00 850.00 855.00 851.67 2.89 0.34
70 1030.00 1040.00 1035.00 1035.00 5.00 0.48 80 1228.30 1232.00 1230.00 1230.10 1.85 0.15 90 1366.20 1366.00 1365.00 1365.73 0.64 0.05
µg-microgram, mL-milliliter, PA- Peak Area, AU- Area under Curve, Conc. - Concentration, AVG-Average, SD-Standard Deviation, RSD-Relative Standard Deviation
Limit of Detection and Limit of Quantification: Limit of Detection (LOD) and Limit of Quantification (LOQ) were determined by using the formula based on the standard deviation of the response and the slope. LOD and LOQ were calculated by using equations,
LOD=3.3 x σ/slope and LOQ=10 x σ/slope. Where, σ = standard deviation of y-intercept, Slope = slope of the calibration curve
LOD were obtained 0.39 & 1.28 µg/mL and LOQ 1.29 & 3.86 µg/mL for Piperine and Gallic acid respectively.
Robustness: The robustness of the HPTLC method was evaluated by analyzing the system suitability parameters after varying the detection wave length (± 2%), mobile phase volume (± 2%). None of these alterations caused a significant change in peak area RSD. The results were represented in Table 9 & 10.
TABLE 9: CHANGE IN WAVELENGTH FOR ROBUSTNESS.
% Change Change in wavelength GA P
PA (AU) % RSD PA (AU) % RSD
-2% 249 nm 1672.5
1.34
3700.0
2.45
0% 254 nm 1701.4 3756.9
2% 259 nm 1755.0 3800.0
PA- Peak Area, AU- Area under Curve, RSD-Relative Standard Deviation
TABLE 10: CHANGE IN MOBILE PHASE VOLUME FOR ROBUSTNESS.
% Change Change in mobile phase ratio (v/v/v) GA P
Rf % RSD Rf % RSD
- 2 % 10.7 : 15.3 : 1 0.51
1.15
0.71
1.41
0 % 11: 15: 1 0.52 0.72
+ 2 % 11.3 : 14.7: 1 0.50 0.70
Rf - Retardation Factor, PA- Peak Area, AU- Area under Curve, RSD- Relative Standard Deviation
CONCLUSION: This developed method was found to be simple, precise, specific, robust and accurate, and could find application in routine quality-control analysis of Polyherbal formulation. ACKNOWLEDGEMENT: The authors like to acknowledge to Vasu Research Centre, A division of Vasu Healthcare Pvt. Ltd, Vadodara, India, for state of the art testing facility and financial support to carry out this research work and Parul Institute of Pharmacy and Research, Limda, Vadodara for throughout support & guidance.
Conflict= NIL
REFERENCES:
1. Quality standards of Indian medicinal plants, part I, vol. I,
Indian council of Medical Research, New Delhi 2003; 168.
2. Indian Ayurvedic Pharmacopoeia, Government of India ,
ministry of health and family planning, department of health, New Delhi (2003), part-1, volume 2, 45-116.
3. The Indian Pharmacopoeia. Published by The Indian
Pharmacopoeia Commission Ghaziabad, 6th edition, 2007; 3: 2522, 2530, 2471, 2484.
4. Kokate C.K, Purohit AP, Gokhale SB Pharmacognosy by
Nirali Prakashan. (2010): 45th edition, 1.14, 1.16, 7.10, 9.3,
9.5.
5. Quality standards of Indian medicinal plants, part I, vol. -
III Indian council of Medical Research, New Delhi 2005; 198, 205.
6. Patel S, Patel J, Patel K, “Comparison and quantification of
marker compound of Triphala Guggulu by HPTLC”
7. Pattanayak P, Mohapatra P, Jenna RK, Panda SK, “Standardization of Sulaharan yoga: An ayurvedic tablet formulation” Indian Journal of Pharmaceutical Science, 2011; 73(1): 65-70
8. Gupta.V& Jain.U: Status of Piperine content in Ayurvedic
formulation: Method standardization by HPTLC. Research Journal of Pharmaceutical, Biological and Chemical Sciences 2011; 2(2): 524-532.
9. Kumar A, Lakshman K, Jayaveera K, Mani tripathi S,
Satish K: Estimation of Gallic acid, Rutin, Quercetin in Terminalia chebula by HPTLC. Jordan Journal of Pharmaceutical Sciences 2010; 3: 63-67.
10. Tapadiya G, Metku M, Deokate M, Khadabadi S, Szboo S,
Sahu K: Quantitative estimation of Piperine from
pharmaceutical dosage form by HPTLC. Asian Journal of Pharmaceutical and Clinical Research 2009; 2: 47-50.
11. Srinivasa. H, Padh H, Rajani M: A rapid densitometry
method for simultaneous quantification of gallic acid and Ellagic acid in herbal raw materials using HPTLC. Journal of Separation Science 2005; 28: 581–584.
12. Pathak S, Niranjan K, Padh H, Rajani M: TLC
densitometry method for the quantification of Eugenol and Gallic acid in clove. Chromatographia, (2004):60, 241244.
13. ICH Harmonized Tripartite Guidelines (Q2R1). Validation
of analytical. Validation of analytical procedures: Text and Methodology. International Conference on Harmonization, European commission, Japan and USA 2005.
All © 2013 are reserved by International Journal of Pharmaceutical Sciences and Research. This Journal licensed under a Creative Commons Attribution-NonCommercial-ShareAlike 3.0 Unported License.
This article can be downloaded to ANDROID OS based mobile. Scan QR Code using Code/Bar Scanner from your mobile. (Scanners are available on Google Playstore)
How to cite this article: