International Journal of Emerging Technology and Advanced Engineering
Website: www.ijetae.com (ISSN 2250-2459,ISO 9001:2008 Certified Journal, Volume 3, Issue 8, August 2013)
472
Comparison of AODV and R-AODV Routing Protocols by
varying Network Mobility, Network Area and Network Density
Pravanjan Das
M. Tech., SVNIT, Surat, India
Abstract— A Mobile Ad hoc Network (MANET) is a temporary network with increased flexibility and mobility and lack of fixed infrastructure. Factors such as network mobility, network area and network density play an important role while evaluating the overall network performance of various on-demand MANET routing protocols. In this paper a comparative study between one of the most widely studied on-demand routing protocol, AODV (Ad hoc On-Demand Distance Vector) and a modified version of AODV, namely Reverse-AODV (R-AODV) has been presented by varying the above mentioned factors. Basically this paper evaluates the impact of these factors based on performance metrics such as packet delivery fraction and average end-to-end delay. A NS-2 based simulation study shows that R-AODV provides a reasonably good result as compared to AODV for almost all types of network scenarios.
Keywords— AODV, R-AODV, MANET, NS-2, Network Mobility, Network Area, Network Density
I. INTRODUCTION
A MANET [1] is a collection of mobile nodes that can dynamically form a network to exchange information without using any pre-existing fixed network infrastructure. The special features of MANET bring this technology great opportunity together with severe challenges. A variety of MANET routing protocols [1][2] have been proposed in the recent years, those can be classified into three major categories: Proactive or table driven, Reactive or on demand and Hybrid routing protocols.
In this paper, the focus has been concentrated on one of the reactive routing protocol AODV [1-3]. The main advantage of this protocol includes on-demand route establishment feature and use of sequence number concept to built fresh and loop free routes. But the performance of the protocol is mainly affected due to three important factors: increased randomness of routing environment, increased network area and highly congested network.
AODV and most of the on-demand routing protocols use single old route entry for each of the destination in the nodes route table and single unicasted route reply packet [4-9] along the reverse path. Due to increased mobility or larger network size, the likelihood of packet loss increases.
The effect can be significantly observed in case of RREP packets as each of such packets are obtained at a cost of flooding the entire or partial network with RREQ packets. So loss of a single RREP packet increases packet delivery ratio, communication delay and overhead of the network.
So a modified version of AODV called as R-AODV [9] was proposed in order to counterpart all the above discussed issues. R-AODV broadcasts the RREP packet throughout the network [9-12] instead of unicasting it along the reverse path which provides the source node a chance of discovering multiple routes for a particular destination. This increases the chance of discovering routes and delivering data packets successfully. In this paper a comparative analysis of AODV and R-AODV has been presented based on three major network parameters: network mobility, network area and network density.
II. OVERVIEW OF ROUTING PROTOCOLS
This section briefly describes both AODV and modified version of AODV (R-AODV) based on which the detailed analysis is to be carried out.
A. Ad hoc On-demand Distance Vector (AODV)
The Ad hoc On-Demand Distance Vector (AODV) [1][3] is a destination initiated reactive routing protocol that enables multi-hop routing between participating mobile nodes in an ad-hoc network. It combines the features of both DSDV and DSR by maintaining sequence numbers for loop free routing and initiating route discovery process on demand respectively.
International Journal of Emerging Technology and Advanced Engineering
Website: www.ijetae.com (ISSN 2250-2459,ISO 9001:2008 Certified Journal, Volume 3, Issue 8, August 2013)
473
The route reply (RREP) packet generated by the target node is unicasted back to the source node along the reverse path.
AODV uses periodic hello messages for the active routes in order to check the connectivity between neighbour nodes and assure the validity of routes. When a node detects that the link to a neighbour is no longer valid, it initiates a route error (RERR) packet and broadcasts it to its neighbour nodes. This process is repeated until the RERR packet reaches the source node. After receiving RERR packet, the source node either checks for a new route in the routing table or initiates new route discovery process.
B. Reverse AODV (R-AODV)
The Reverse Ad-hoc On-Demand Distance Vector AODV) [9] utilizes the concept of reverse route request (R-RREQ) in order to overcome the effect due to loss of single unicasted RREP packet along the reverse path in the route discovery process. The working principle of R-AODV includes the following four processes [11]: RREQ generation, RREQ reception and processing, R-RREQ reception and processing and RERR generation and processing.
Based on demand a RREQ packet is broadcasted throughout the network until it reaches the destination node. The intermediate node creates a reverse route entry for the RREQ source address and further broadcasts it if the packets destination address does not match nodes own address. The primary intention is to maintain the link disjointness among various discovered routes as far as possible.
The destination node floods the R-RREQ in the network in order to discover multiple routes for the source node [9-10]. When a node receives the R-RREQ packet and finds that it is not the intended destination of the packet, it further broadcasts the packet after creating or updating the forward route entry. The source node starts delivering data packets using the first received R-RREQ packet whereas the late arrived packets are stored for future use. A node puts limit on the route count for a particular destination by discovering number of routes to that destination equal to number of neighbour nodes. The generation and processing of RERR packet is carried out in the same manner as explained in case of AODV.
III. SIMULATION MODEL
The simulation tool used in this paper is NS-2 [15], one of the widely accepted simulators for networking research.
NS-2 uses OTCL (Object tool command language) that takes into account mobility scenario and traffic pattern parameters and C++ source code for creating and updating routing protocols. Various scripting languages such as awk or perl scripting can be used to analyze the trace file and generate performance graphs.
Different simulation parameter specifications have been considered for three different network parameters such as network mobility, network area and network density and are provided in table II, III and IV respectively.
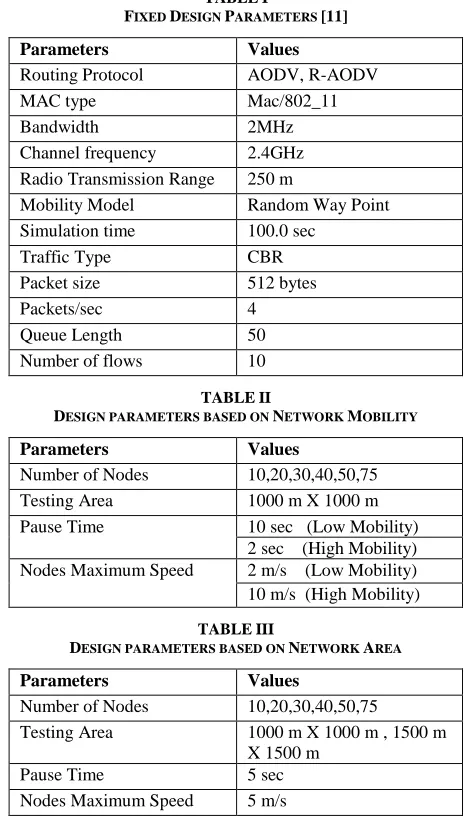
TABLEI
FIXED DESIGN PARAMETERS [11]
Parameters Values
Routing Protocol AODV, R-AODV
MAC type Mac/802_11
Bandwidth 2MHz
Channel frequency 2.4GHz Radio Transmission Range 250 m
Mobility Model Random Way Point Simulation time 100.0 sec
Traffic Type CBR
Packet size 512 bytes
Packets/sec 4
Queue Length 50
Number of flows 10
TABLEII
DESIGN PARAMETERS BASED ON NETWORK MOBILITY
Parameters Values
Number of Nodes 10,20,30,40,50,75 Testing Area 1000 m X 1000 m Pause Time 10 sec (Low Mobility)
2 sec (High Mobility) Nodes Maximum Speed 2 m/s (Low Mobility) 10 m/s (High Mobility)
TABLEIII
DESIGN PARAMETERS BASED ON NETWORK AREA
Parameters Values
Number of Nodes 10,20,30,40,50,75
Testing Area 1000 m X 1000 m , 1500 m X 1500 m
Pause Time 5 sec
[image:2.612.326.558.262.682.2]International Journal of Emerging Technology and Advanced Engineering
Website: www.ijetae.com (ISSN 2250-2459,ISO 9001:2008 Certified Journal, Volume 3, Issue 8, August 2013)
474
TABLEIV
DESIGN PARAMETERS BASED ON NETWORK DENSITY
Parameters Values
Number of Nodes 25, 50
Testing Area 1000 m X 1000 m
Pause Time 2 sec
Nodes Maximum Speed 2,5,10,25,50,75 m/s
IV. SIMULATION RESULTS AND ANALYSIS
The simulation results are obtained on the basis of following two performance metrics [9]:
Packet Delivery Fraction: It is the ratio of number of packets received to that of number of packets transmitted from source to the destination.
Average End-to-End Delay: It is the average time taken by packets to travel from source node to the destination node across the network, which includes buffering of data packets during route discovery, queuing at the interface queue and retransmission delays at the MAC.
Here the performance metrics are observed by varying number of nodes and nodes maximum speed [9-14].
[image:3.612.325.566.131.302.2]A. Simulation Results based on Network Mobility
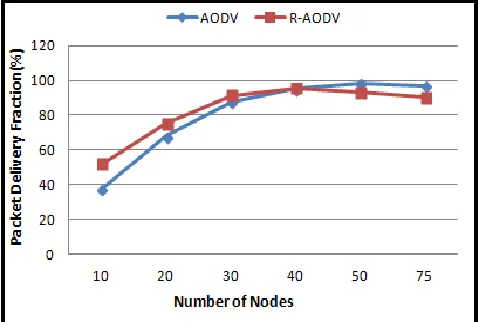
[image:3.612.55.281.157.226.2]Figure 1: Packet Delivery Fraction based on Low Mobility
Figure 2: Packet Delivery Fraction based on High Mobility [11]
[image:3.612.325.564.386.550.2]Figure1 and 2 show that for both the scenarios (low and high mobility), R-AODV has better packet delivery ratio than AODV at lower densities because R-AODV utilizes multiple recent routes at the source node which are fresh enough.
[image:3.612.51.289.414.589.2]International Journal of Emerging Technology and Advanced Engineering
Website: www.ijetae.com (ISSN 2250-2459,ISO 9001:2008 Certified Journal, Volume 3, Issue 8, August 2013)
[image:4.612.52.290.126.300.2]475
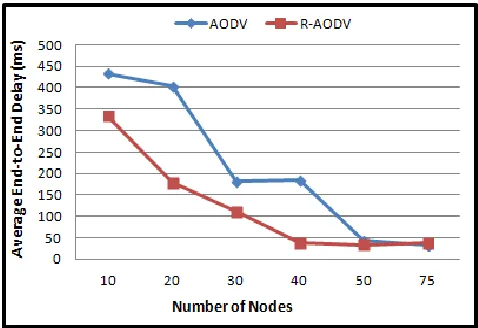
Figure 4: Average End-to-End Delay based on High Mobility [11]
From Figure 3 and 4, it is clear that use of multiple routes and successful delivery of route reply packets reduces the average end-to-end delay for R-AODV in all types of mobility scenarios.
[image:4.612.323.566.131.299.2]B. Simulation Results based on Network Area
[image:4.612.327.566.334.503.2]Figure 5-8 show that for larger network (1500 m X 1500 m), R-AODV performs better than AODV at all network densities. As we move towards higher densities in larger networks, the maximum path length increases and is more in case of AODV as compared to R-AODV [13]. A long path is more prone to link breakages and requires high control overhead for its maintenance. It reduces the packet delivery fraction and increases average end-to-end delay in case of AODV as compared to R-AODV for larger networks. The same can be handled by multiple recent routes stored at the source node in case of R-AODV.
Figure 5: Packet Delivery Fraction based on Network Area 1000 m X 1000 m
[image:4.612.50.290.523.684.2]Figure 6: Packet Delivery Fraction based on Network Area 1500 m X 1500 m
Figure 7: Average End-to-End Delay based on Network Area 1000 m X 1000 m
[image:4.612.327.566.533.697.2]International Journal of Emerging Technology and Advanced Engineering
Website: www.ijetae.com (ISSN 2250-2459,ISO 9001:2008 Certified Journal, Volume 3, Issue 8, August 2013)
476
[image:5.612.322.564.128.301.2]C. Simulation Results based on Network Density
[image:5.612.48.289.150.334.2]Figure 9: Packet Delivery Fraction based on 25 Number of Nodes [11]
Figure 10: Packet Delivery Fraction based on 50 Number of Nodes
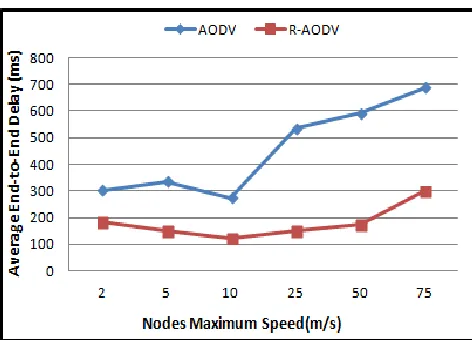
[image:5.612.49.292.338.504.2]Figure 11: Average End-to-End Delay based on 25 Number of Nodes [11]
Figure 12: Average End-to-End Delay based on 50 Number of Nodes
From Figure 9-12 it can be concluded that packet delivery ratio and average end-to-end delay is better for R-AODV as compared to R-AODV when number of nodes is 25. Both AODV and R-AODV perform equally well when the number of nodes is changed to 50. It can also be observed that the packet delivery fraction for both the protocols is significantly improved (more than 88 %) when number of nodes is 50 as compared to 25.
V. CONCLUSION
A comparative simulation study between AODV and R-AODV based on two major performance metrics such as packet delivery ratio and average delay results in a set of conclusions. The results show that R-AODV completely outperforms AODV for larger network size and low density networks with lower network mobility. AODV performs significantly well for higher network densities as compared to R-AODV.
REFERENCES
[1] Elizabeth M. Royer, Chai-Keong Toh, "A Review of Current Routing Protocols for Ad Hoc Mobile Wireless Networks", IEEE Personal Communications, Vol. 6, No. 2, pp. 46-55, April 1999. [2] S.R. Das, R. Castaneda, J. Yan, and R. Sengupta, ―Comparative
performance evaluation of routing protocols for mobile, ad hoc networks,‖ 7th Int. Conf. on Computer Communications and Networks (IC3N), pages 153–161, October 1998.
[3] ―Ad hoc On-Demand Distance Vector (AODV) Routing‖, available at URL: http://www.ietf.org/rfc/rfc3561.txt.
[4] M. K. Marina and S. R. Das ―On-Demand Multi Path Distance Vector Routing in Ad Hoc Networks,‖ Proc. ICNP 2001, pp. 14– 23, Nov. 2001.
[image:5.612.51.287.522.692.2]International Journal of Emerging Technology and Advanced Engineering
Website: www.ijetae.com (ISSN 2250-2459,ISO 9001:2008 Certified Journal, Volume 3, Issue 8, August 2013)
477 [6] W. Lou and Y. Fang, ―A Multipath Routing Approach for Secure
Data Delivery,‖ Proc. MILCOM’01, vol. 2, pp. 1467–1473, 2001. [7] Néeraj Rathore, Umesh Barahdiya and Pawan jain, ―Performance
Evaluation of Multipath AODV Routing Protocol‖, International Journal Of Engineering And Computer Science ISSN: 2319-7242, Volume 2, Issue 2, Feb 2013.
[8] A. Tsirigos and Z. J. Haas, ―Multipath Routing in the Presence of Frequent Topological Changes,‖ IEEE Communications Magazine, vol. 39, no. 11, pp. 132–138, Nov. 2001.
[9] Chonggun Kim, Elmurod Talipov, and Byoungchul Ahn, "A Reverse AODV Routing Protocol in Ad Hoc Mobile Networks" , LNCS 4097, pp. 522 531,2006.
[10] Rua Yang; Zhi-yuan Li, "A stablity routing protocols base on Reverse AODV," Computer Science and Network Technology (ICCSNT), 2011 International Conference on , vol.4, no., pp.2419,2423, 24-26 Dec. 2011.
[11] Pravanjan Das and Upena D Dalal, ―A Comparative Analysis of AODV and R-AODV Routing Protocols in MANETS‖, International Journal of Computer Applications 72(21):1-5, June 2013.Published by Foundation of Computer Science, New York, USA.
[12] Humaira Nishat, Vamsi Krishna K, Dr. D.Srinivasa Rao and Shakeel Ahmed ―Performance Evaluation of On Demand Routing Protocols AODV and Modified AODV (R-AODV) in MANETS‖, International Journal of Distributed and Parallel Systems, vol. 2, no. 1, January 2011.
[13] Khafaei Taleb and Khafaie Behzad, ―Comparison of RAODV and AODV Networking Routing Protocols Based on Number of Hops in Path‖, International Conference on Advanced Computer Theory and Engineering, 2011.
[14] Bhabani Sankar Gouda, "A Comparative Analysis of Energy Preservation Performance Metric for ERAODV, RAODV, AODV and DSDV Routing Protocols in MANET." International Journal of Computer Science & Engineering Technology (IJCSET) vol. 3, no. 10, pp. 516-524, Oct. 2012.