Structural changes in the Polish economy
- the analysis of input-output
Olczyk, Magdalena
Gdańsk University of Technology
2011
Online at
https://mpra.ub.uni-muenchen.de/33659/
Magdalena Olczyk
Katedra Nauk Ekonomicznych
Politechnika Gdańska, Wydział Zarządzania i Ekonomii Ul. Traugutta 79
emial: [email protected]
STRUCTURAL CHANGES IN THE POLISH ECONOMY –
THE ANALISIS OF INPUT-OUTPUT
Abstract
This paper analyses the structure of Polish economy using three input-output tables for years 1995, 2000 and 2004. Applying the traditional methods proposed by Rasmussen the sector’s backward and forward linkages are identified. Industries with large backward and forward linkages are named “key sectors” and play an important role in the development strategy of a country, so the outcome of the paper may be used for the development strategy of Polish economy.
At the beginning of the article the idea of input-output table and Rasmussen’s methodology of identifying the key sectors are discussed in detail. Then, based on three input-output tables, the key sectors in the Polish economy are selected and the role of these sectors over the years 1995-2004 is examined.
Key words: input-output tables, backward and forward linkages, key sectors.
Introduction
Among several key issues currently being discussed in Poland, the issue of structural
changes is undoubtedly one of the most important. Process of transition of the Polish
econo-my is connected with large structural changes among others in the consumption, the
invest-ments, the final demand and particularly in the process of production. Of course, since 1990
Polish sectors of production have been developing in different ways, with different speeds
and they provide different opportunities for our economy. Now, it is very important to
identi-fy these sectors, which were crucial for Polish economy during twenty years of
transforma-tion. What is most needed, is the “sectoral route map”, which could be very helpful for
gov-ernment to clearly indicate key sectors and accelerate their development.
The identification of the most valuable sectors in economy is based on the assumption that
sectors of production don’t exist in vacuum. Each economy consists of many inter-industry
lin-kages among sectors. Each of these sector has different (weak or strong) connections with the
other sectors. The size of a sector has in this case no significance. This is why key sector is
de-fined as “a sector which, on one hand, is largely dependent on other industries, that is, it
sec-tors use its output as an intermediate product in their production processes. Investments in key
sectors would thus initiate economic development due to the tight interrelations with other
production sectors” (Temurshoev 2004).
Analytical tool for identifying key sectors is the input-output table (discussed further
below). The principle behind I/O analysis is simple: each industryproduces to satisfy the final
demand for its output but also the intermediate demands of all other sectors in the economy
that use this output as a factor of production (input). So the production process in the
econo-my involves a network of cross-sectoral linkages and the strength of these relationships is a
criterion to indicate the most crucial sectors.There are two types of linkages, which measure
the economic interdependences of sectors in terms of the magnitude transactions: backward
and forward. Backward and forward linkages, which were first proposed by Rasmussen
(1956), are calculated from the Leontief concept. The backward linkages based on the
Leon-tief inverse matrix are defined as the column sums of the inverse matrix and measure the
im-pact on supplier industries of a unit increase in final demand. Forward linkages, in turn, are
defined as the row sums of the Leontief inverse matrix and they measure the effect on total
output of all sectors associated with a unit change in the primary inputs of selected sector. The
value of indicators used by Rasmussen (1956) for the assessment of such backward and
for-ward linkages will allow indentify the most critical sectors in the Polish economy.
The structure of the paper is as follows. This introductory part, which deals with
im-portant issues to be addressed in this paper, is followed by a discussion on methodology and
data. The author then takes a look at the results of the data analysis, followed by a concluding
section that includes some policy recommendations as well.
The input-output analysis and key sectors of economy – theoretical aspects
Theoretical basis for the analysis of key sectors was founded by W. Leontief, an
American scientist, Nobel laureate in economics in 1973. His analysis of the inputs and
out-puts, based on dependency of matrices among sectors in the economy, is also known as
in-put-output analysis. For graphical presentation of his scientific analysis the classic structure of
W. Leontief input-output table is shown in figure 1.
Source: B.Wixted, N.Yamano, C.Webb : Input-output analysis in an increasingly globalised world. Application of OECD’s harmonized internationals table, OECD working paper 2006/07, pp.8.
The first part of the table is a square matrix of transactions (called domestic
interme-diate matrix), presenting the interaction between national suppliers (grouped in rows) and
customers (grouped in columns) that occur in production processes in the economy.
Other-wise, this matrix presents the intermediate demand (production) in an economy that is sectoral
spending on raw materials, supplies and services. Part of the table with the number 2, located
below the matrix of transactions, includes in the rows the value of imports of intermediate
goods and services and related subsidies mines taxes (net taxes). The sum of lines 1 and 2 are
part of the table "input-output," giving us a total value of inputs (intermediate goods), in the
purchase price. In the third part of the input-output table the value of each sector is added,
informing at the same time about other costs of production. Value added is the sum of wages,
surplus and gross operating taxes (less subsidies) associated with the production. The fourth
part of classical "input-output” table, called the matrix of domestic investment, represents the
final demand for particular products, or the part of the products which have been produced
(described in columns) private consumption, public consumption, export minus imports,
in-vestment and business expenses related to the change in inventories. It is worth remembering
that the concept of "input-output analysis" based on the assumption that final demand is
ex-ogenous to the sectors of production i.e. it is not dependent on the level of production in these
sectors.
The fifth and last part of the analyzed table is a matrix of import demand (called imported
investment matrix), which contains a value of imported final goods with subsidies (less taxes)
associated with those goods. The parts of number 4 and 5 of "input-output” table together
constitute the total final demand in the economy in the purchase price. Already completed
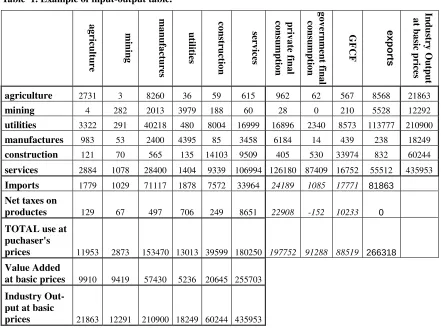
[image:5.595.69.510.285.613.2]example input-output table is shown below.
Table 1. Example of input-output table.
a g ri cu lt u re m in in g m a n u fa ct u re s u til it ie s co n st ru ct io n se rv ic es p ri v a te f in a l co n su m p tio n g o v er n m en t f in a l co n su m p tio n G F C F e x p o rt s In d u st ry O u tp u t a t b a si c p ri ce s
agriculture 2731 3 8260 36 59 615 962 62 567 8568 21863
mining 4 282 2013 3979 188 60 28 0 210 5528 12292
utilities 3322 291 40218 480 8004 16999 16896 2340 8573 113777 210900
manufactures 983 53 2400 4395 85 3458 6184 14 439 238 18249
construction 121 70 565 135 14103 9509 405 530 33974 832 60244
services 2884 1078 28400 1404 9339 106994 126180 87409 16752 55512 435953
Imports 1779 1029 71117 1878 7572 33964 24189 1085 17771 81863
Net taxes on
productes 129 67 497 706 249 8651 22908 -152 10233 0
TOTAL use at puchaser's
prices 11953 2873 153470 13013 39599 180250 197752 91288 88519 266318
Value Added
at basic prices 9910 9419 57430 5236 20645 255703
Industry Out-put at basic
prices 21863 12291 210900 18249 60244 435953
Source: B.Wixted, N.Yamano, C.Webb : Input-output analysis in an increasingly globalised world. Appli-cation of OECD’s harmonized internationals table, OECD working paper 2006/07, pp.9.
Analysis of table 1 shows that the sum of all rows in a matrix of transactions and a
ma-trix of investment illustrate the total demand for the production in the country and it amounts
to 435 953 monetary units in the example shown. However, the sum of the columns of the
of intermediate goods and services (part 2 table) show the total value of production in the
economy. In our case, it also amounts to 435 953 , because the value of total consumption for
each production sector (which incidentally is equal to the total demand for the production of
the sector) must be equal to the value of output produced by this sector. Of course, this
equal-ity only occurs when the sum of final demand is equal to the value added and value of imports
of intermediate goods and services.
Based on the above mentioned dependencies, W.Leontief writes the following balance
equation:
∑
= +
= n
j
i ij
i X Y
X
1
i=1,…..n (1)
where:
xi- total output of sector i
xij- intermediate input of sector i to sector j
yi- final demand
Equation (1) can be written differently, if we enter the input coefficient (aij) into the equation.
The term input coefficient refers to the quantity of inputs required from each industry to
pro-duce one zloty’s worth of a given industry’s output.1 The sum of the elements in the j th
col-umns of the input coefficients matrix is usually known as the direct backward linkage.
By replacing the
∑
= nj ij x
1
in equation (1) by aij we obtain the following equation:
∑
=
+
= n
j
i j ij
i a X Y
X
1 (2)
The equation (2) can be expresses in the matrix form X= AX+Y and re-written as
(3)
where:
X is a column vector of total output X= [x1 x2……xn]
Y is a column vector of final demand Y= [ y1 y2….yn]
A is an (n x n) matrix of input coefficient aij
I is the (n x n) identity matrix.
The (I-A)-1 is called the “ Leontief inverse” or “total requirements” matrix and is used to find the main linkages in economy. Rasmussen (1956) uses the sum of columns of the
“Leontief inverse matrix” to measure the both direct and indirect backward linkage. The
1
bij= xij/xj
total backward linkages shows the total inputs requirements for a unit increase in the final
demand for the jth sector. It is defined as:
j n
i ij j
k
B
BL
∑
==
=
1.
(4) where:BLj is the backward linkage of sector j of Rasmussen’s method.
kij is the ij th element of Leontief inverse matrix
B. j is the sum of column elements in sector j and n is the number of sectors.
The effects from supply-side of input-output model are called forward linkages. The direct forward linkages are defined as the sum of the rows of direct-input coefficients
ma-trix and can be written as:
i n
i ij i
g
F
FL
∑
==
=
1.
FLi is the forward linkage of sector i of Rasmussen’s method.
gij is the ij th element of Leontief inverse matrix
F. i is the sum of row elements in sector i and n is the number of sectors.
Rasmussen (1956) uses the sum of rows of the “Leontief inverse matrix” to measure the both
direct and indirect forward linkages.
To inter-industry comparisons Rasmussen (1956) uses the backward indices called “ Power
of Dispersion Index” (5) and the forward indices called “ Sensitivity of Dispersion Index”(6)
They are defined as
∑
= = n j j j B n n j B n U 1 . * 1 . 1 (5)∑
= = n j i i F n n i F n U 1 . * 1 . 1 (6)The direct and indirect forward and backward linkages are the indices for identification the
key sectors in an economy. Analysis of these indicators allows to identify sectors that as a
"sellers" or "buyers" of semiproducts for intermediate consumption play the most important
role in economy. If Ui > 1 it means that the unit growth in demand in all sectors will result in
above-average growth in the sector i e.g. that products of sector i will be in greatest demand
the products of sector j will cause an above-average growth in production throughout the
economy.On the basis of these indicators, according to Rasmussen (1956), the key sectors
will be identified. These sectors have strong ties to a "forward" and "backward" and their
development involves the development of the whole economy.
The methods proposed by P. Rasmussen and A. Hirschman are the subject of frequent
criticism. Mostly it relies on the argument that using these methods, links occurring in the
economy are double counted. Because if first industry sells products to the second sector,
then for the primary sector the forward link in the economy is listed and for the second sector
the backward linkage is noticed. It also indicates, that forward and backward linkages,
pro-posed by P.Rasmussen and A. Hirschamn are not weighted. Hence the proposition of B.
Ha-zary, L. Jones and P. Laumasa take into account the relative role of each sector in meeting the
final demand and in the formation the value added in economy. They propose for the
calcula-tion of backward linkage to use the weight of sector's share in final demand, while the weight
uses to estimate the forward link is participation of the sector in the generation of value added
throughout the economy.
P. Rasmussen's approach to the identification of key sectors is known in the literature
as the traditional approach. To the newest methods to separate the most important sectors of
the economy belong the primarily hypothetical extraction method of Miller and Lahr (called a
hypothetical extraction method) and the method for an integrated approach with the matrix
(called a matrix holistic approach). Currently, the most popular is the first one, involving the
extraction of sequence analyzed sectors of the economy and the measurement of the effects of
such operations in the percentage changes in production compared to the baseline scenario
without extraction. The higher the percent of change, the more important sector of the
econo-my. In view of some editorial limits, the author will use traditional methods for identifying
key sectors in the Polish economy.
Backward and forward linkages in the Polish economy – the identification of key sec-tors – practical example.
The major data sources for the empirical part of the this paper come from input-output
(IO) tables, downloaded from OECD database STAN. The author uses all (three) tables
avail-able for Polish economy domestic I/O for years 1995, 2000, 2004, in basic price. In the
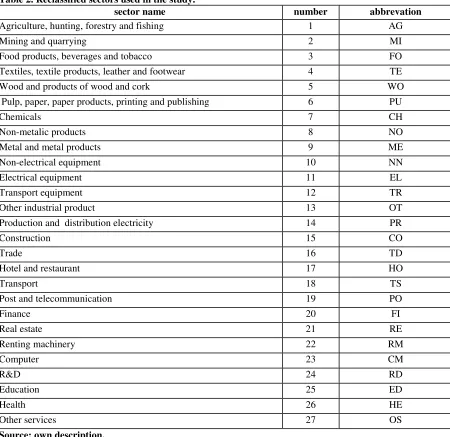
and comparability all sectors are reclassified and aggregated into 27 single sectors (as shown
[image:9.595.72.522.119.556.2]in table 2).
Table 2. Reclassified sectors used in the study.
sector name number abbrevation
Agriculture, hunting, forestry and fishing 1 AG
Mining and quarrying 2 MI
Food products, beverages and tobacco 3 FO Textiles, textile products, leather and footwear 4 TE Wood and products of wood and cork 5 WO Pulp, paper, paper products, printing and publishing 6 PU
Chemicals 7 CH
Non-metalic products 8 NO
Metal and metal products 9 ME
Non-electrical equipment 10 NN
Electrical equipment 11 EL
Transport equipment 12 TR
Other industrial product 13 OT
Production and distribution electricity 14 PR
Construction 15 CO
Trade 16 TD
Hotel and restaurant 17 HO
Transport 18 TS
Post and telecommunication 19 PO
Finance 20 FI
Real estate 21 RE
Renting machinery 22 RM
Computer 23 CM
R&D 24 RD
Education 25 ED
Health 26 HE
Other services 27 OS
Source: own description.
Firstly, author performs the descriptive analysis, to show what is the role of each
indi-vidual sector in generating the total output and the total value added in Polish economy
be-tween 1995-2004. Analysis of table 3 shows that five sectors (out of 27 ) are responsible for
generating almost 50% of value of total production in the Polish economy. In 1995 these
sec-tors are trade, foods, agriculture, construction and real estate (49,8%), in year 2000 trade,
food, construction, other services, agriculture (52,7%), whereas in 2004 to this group belong
trade, food, other services, construction and transport sector (48,7%). Locomotives of the
Polish economy, which determine the level of total production and which in each analyzed
and construction.
Table 3. Sectors with the highest share in total output in years: 1995, 2000, 2004.
no sector 1995 sector 2000 sector 2004 1 Trade 12,4 Trade 15,8 Trade 14
2
Food products,
beve-rages and tobacco 12,2
Food products, beverages and
tobacco 10,9
Food products, beverages
and tobacco 11,5
3
Agriculture, hunting,
forestry and fishing 9,8 Construction 10,8 Other services 9,1
4 Construction 7,9 Other services 8,7 Construction 7,9
5 Real estate 7,5
Agriculture, hunting, forestry
and fishing 6,5 Transport 6,2
6 Other services 6,5 Transport 4,8
Agriculture, hunting,
forestry and fishing 5,8
7
Metal and metal
products 5,5 Real estate 4,3 Metal and metal products 4,9
8 Chemicals 5,2
Production and distribution
elec-tricity 4 Real estate 4,7
9 Transport 5,1
Metal and metal
products 3,9 Chemicals 4,5
10
Non-electrical
equipment 4,5 Chemicals 3,5
Production and
distribu-tion electricity 4,2
Source: own calculation.
Between 1995-2004 large changes have occurred among the sectors that generate the
highest value of production in the Polish economy (see table 4). Among the five most gaining
the importance in generating the value of output are: the health sector, electrical equipment,
finance, trade and transport sector. Unfortunately, for three of these sectors i.e. the other
ser-vices, electrical equipment and finance sector is this growth the result of a low base i.e. the
low position in year 1995. However, trade and transport sectors, consistently and gradually
increase their share in total production in the Polish economy between 1995-2005.
Table 4. The sectors with the greatest rise and fall of shares in total production between 1995-2004 (in percentage points).
Rise of share Fall of shares Other services 2,6 Agriculture -4,2 Electrical equipment 2,3 Real estate -2,8 Finance 1,8 Non-electrical equipment -2,5
Trade 1,6
Textiles, textile products,
leather and footwear -1,4 Transport 1,1 Mining and quarrying -1,3
Source: own calculation.
[image:10.595.77.521.603.721.2]value of output in the Polish economy are agriculture, real estate, non-electrical equipment,
textiles and mining sector. These decreases indicate permanent structural changes in the
sec-tors, which determine the value of production in Poland. It is worth to notice the significant
decline in the role of agricultural and mining sectors in the growth of Polish economy.
Next the author analyzes the positions of individual sectors in the generation of value
[image:11.595.70.523.209.472.2]added in the Polish economy and its changes between 1995-2004 (see table 5).
Table 5. Sectors with the highest share in value added in years: 1995, 2000, 2004.
no sector 1995 sector 2000 sector 2004 1 Trade 18,5 Trade 18,7 Trade 20,5
2 Other services 10,5 Other services 17 Other services 12,5
3
Agriculture, hunting,
forestry and fishing 7,7 Construction 7,4 Construction 6,5
4 Construction 6,3 Real estate 6,5 Transport 4,7
5 Real estate 5,2 Transport 4,8 Education 4,5
6 Education 4,4 Education 4,6
Production and distribu-tion electricity 4
7
Production and
dis-tribution electricity 4,3 Health 4 Health 3,9
8
Non-electrical
equipment 4,2
Agriculture, hunting,
forestry and fishing 3,5 Real estate 3,7
9 Health 4,1
Food products,
beve-rages and tobacco 3,3
Agriculture, hunting,
forestry and fishing 3,6
10
Food products, beve-rages and tobacco 4,1
Production and
distri-bution electricity 3,1 Non-metalic products 3,5
Source: own calculation.
In this analysis, the similar concentration as among the sectors with the highest share
of total added value is observed. Five of 27 sectors in the Polish economy generates nearly
half its added value in Polish economy. The analysis of table 5 shows that in year 1995 these
sectors are: trade, other services, agriculture, construction and real estate (48, 2%), in year
2000 trade, other services, construction, real estate, transport (54,4%), whereas in 2004 to
this group belong trade, other services, construction and education sector (48,7%).
Trade sector is the undisputed leader both in terms of share of this sector in the
genera-tion the value added as well as in terms of its role in the growth of Polish economy. This
sec-tor occupies first place in all years analyzed, having in each of these years the highest share in
generating the value added as well as in the total output of Polish economy. It should also
stress the importance of the construction sector and other services sector in the creation of
value added in the Polish economy. In all examined years, they belong to the TOP 5 of the
When considering the participation of analyzed sectors in the creation of value added
in the Polish economy, it is worth emphasizing significant changes in the role of particular
[image:12.595.67.517.156.297.2]sectors between the years 1995-2004 (see table 6).
Table 6.The sectors with the greatest rise and fall of shares in total value added between 1995-2004 (in percentage points).
wzrost udziałów
spadek udzia-łów Electrical equipment 2,6 Agriculture, hunting, forestry and fishing -4,1
Trade 2 Non-electrical equipment -1,8
Finance 1,8 Real estate -1,5
Other services 1,7 Mining and quarrying -0,9 Non-metalic products 0,8 Textiles, textile products, leather and
foot-wear
-0,9
Source: own calculation.
To the five sectors, which shares in the generation of added value between 1995-2004 mostly
increased belong: electrical equipment, trade, finance, other services and a sector of
non-metallic products. Among them, especially in trade and in finance sectors this increasing trend
is clearly observed in the years 1995-2004. In turn, the sectors that record the strongest (in
percentage points) drop in its shares in total added value in the Polish economy are
agricul-ture, non-electrical equipment, real estate, mining and textiles sector. These decreases indicate
permanent structural changes in the sectors, which determine the total value added in Poland.
It is also worth to notice, that the same five sectors (agriculture, non-electrical equipment, real
estate, mining, textiles) lose mostly their significance both in the growth of Polish economy
(measured by drop in its share in total value of output) and in generation of the total added
value between 1995-2004.
The next step in this analysis is to calculate and analyze the direct links between the
sectors in the Polish economy. It is worth to mention that the first attempts to supply
quantita-tive evaluation of backward and forward linkage were made by Chenery and Watanabe in
their analyses on the international study of the structure of production.
In table 7 the direct backward and direct forward linkages in Polish economy are presented.
There are ten sectors (the same throughout the period considered) with the strongest backward
linkages in Poland. These sectors are: agriculture, food and beverages products, wood and
products of wood, pulp and paper production, non-metalic products, metal and metal
prod-ucts, transport equipment, other industrial prodprod-ucts, construction, transport. In turn, seven
sectors belong to group of sectors with the largest forward linkages throughout the period
electricity, trade, post and telecommunication and the sector of other services.
Table 7. Direct backward and forward linkages.
direct backward linkages direct forward linkages 1995 2000 2004 1995 2000 2004 1 Agriculture, hunting, forestry and fishing 0,544 0,600 0,450 1 0,881 0,648 0,572 2 Mining and quarrying 0,376 0,339 0,271 2 0,532 0,421 0,319 3 Food products, beverages and tobacco 0,700 0,687 0,684 3 0,367 0,541 0,493
4
Textiles, textile products, leather and
foot-wear 0,470 0,370 0,370 4 0,355 0,122 0,111 5 Wood and products of wood and cork 0,549 0,503 0,540 5 0,249 0,311 0,289
6
Pulp, paper, paper products, printing and
publishing 0,508 0,427 0,490 6 0,500 0,355 0,364 7 Chemicals 0,525 0,363 0,410 7 0,725 0,604 0,608 8 Non-metalic products 0,479 0,463 0,462 8 0,498 0,484 0,496 9 Metal and metal products 0,600 0,496 0,489 9 0,612 0,624 0,599 10 Non-electrical equipment 0,474 0,419 0,444 10 0,529 0,249 0,151 11 Electrical equipment 0,013 0,442 0,413 11 0,003 0,233 0,217 12 Transport equipment 0,002 0,582 0,487 12 0,109 0,251 0,163 13 Other industrial product 0,473 0,521 0,518 13 0,253 0,155 0,168 14 Production and distribution electricity 0,489 0,489 0,451 14 0,708 0,788 0,721 15 Construction 0,530 0,521 0,480 15 0,257 0,551 0,499 16 Trade 0,408 0,420 0,368 16 1,571 1,837 1,780 17 Hotel and restaurant 0,527 0,587 0,450 17 0,108 0,088 0,073 18 Transport 0,490 0,432 0,482 18 0,605 0,543 0,570 19 Post and telecommunication 0,381 0,467 0,352 19 0,316 0,415 0,366 20 Finance 0,611 0,482 0,374 20 0,256 0,538 0,482 21 Real estate 0,586 0,369 0,370 21 0,901 0,204 0,256 22 Renting machinery 0,001 0,182 0,308 22 0,003 0,064 0,078 23 Computer 0,099 0,355 0,320 23 0,003 0,122 0,187 24 R&D 0,000 0,322 0,384 24 0,003 0,107 0,182 25 Education 0,181 0,153 0,156 25 0,017 0,033 0,036 26 Health 0,283 0,242 0,249 26 0,048 0,068 0,080 27 Other services 0,385 0,310 0,327 27 0,161 1,185 1,241
Source: own calculation.
What is important, up to 21 out of 27 surveyed sectors are characterized in 2004 by a weaker
direct backward linkages in comparison to 1995. In particular, this trend is evident in the
agri-cultural and financial sector. However, the group of six sectors, in which an increase of the
index of direct backward is observed, consists of sectors such as: electrical equipment,
trans-port and other industrial products, renting machinery, computer and R & D. These increases,
however, are in all sector connected with the effect of low base.
In turn, according to the direct forward linkages, only in 12 sector devaluations of direct
for-ward linkages are observed. They are most strongly evident in agriculture, non-electrical
lin-kages with another sectors are strengthened during years analyzed, in three of them a strong
increasing tendency are noticed. They are: an electrical equipment sector, a construction and
a trade sector. Among all sector a trade sector in all years analyzed is characterized by a four
times greater value of direct forward linkages than mean value for all sectors.
Next, total (direct and indirect) backward and forward linkages for Poland in years
[image:14.595.75.530.203.648.2]1995,2000, 2005 are calculated (table 8).
Table 8. Direct and indirect forward and backward linkages.
direct and indirect backward linkages
direct and indirect forward linkages
1995 2000 2004 1995 2000 2004 1 Agriculture, hunting, forestry and fishing 2,109 2,200 1,812 1 2,707 2,313 2,048
2 Mining and quarrying 1,730 1,597 1,464 2 2,165 1,866 1,632
3 Food products, beverages and tobacco 2,495 2,410 2,261 3 1,725 1,971 1,828 4 Textiles, textile products, leather and footwear 1,915 1,640 1,623 4 1,588 1,177 1,152 5 Wood and products of wood and cork 2,108 1,946 1,970 5 1,396 1,461 1,419 6 Pulp, paper, paper products, printing and publishing 2,009 1,739 1,841 6 1,946 1,632 1,624
7 Chemicals 2,039 1,633 1,684 7 2,482 2,114 2,097
8 Non-metalic products 1,933 1,818 1,795 8 1,965 1,882 1,864
9 Metal and metal products 2,175 1,892 1,847 9 2,250 2,064 1,981
10 Non-electrical equipment 1,930 1,749 1,763 10 2,079 1,436 1,238 11 Electrical equipment 1,037 1,787 1,709 11 1,006 1,397 1,334 12 Transport equipment 1,037 2,063 1,835 12 1,236 1,394 1,249 13 Other industrial product 1,938 1,955 1,921 13 1,467 1,254 1,256 14 Production and distribution electricity 1,919 1,844 1,733 14 2,457 2,363 2,195 15 Construction 2,052 1,955 1,848 15 1,515 2,066 1,922
16 Trade 1,814 1,754 1,635 16 3,993 4,332 4,075
17 Hotel and restaurant 2,023 2,176 1,858 17 1,181 1,164 1,130
18 Transport 1,904 1,771 1,831 18 2,295 2,113 2,121
19 Post and telecommunication 1,718 1,790 1,568 19 1,539 1,765 1,655 20 Finance 2,232 1,886 1,613 20 1,412 2,047 1,837 21 Real estate 2,191 1,664 1,635 21 3,062 1,390 1,461 22 Renting machinery 1,109 1,320 1,508 22 1,006 1,109 1,121
23 Computer 1,121 1,600 1,511 23 1,278 1,188 1,288
24 R&D 1,306 1,551 1,640 24 1,390 1,142 1,253
25 Education 1,346 1,265 1,262 25 1,032 1,047 1,052
26 Health 1,561 1,413 1,405 26 1,083 1,092 1,106
27 Other services 1,735 1,543 1,549 27 1,275 3,181 3,184
Source: own calculation.
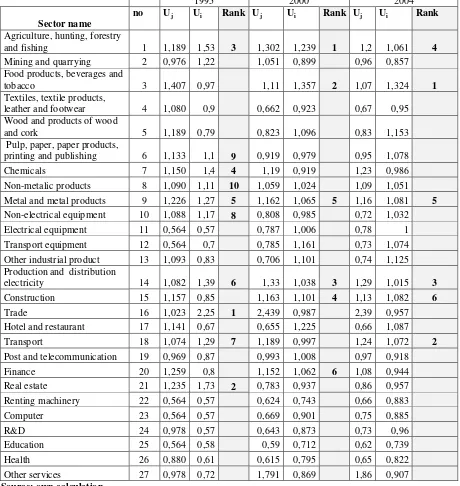
To identify “ key sector” the author takes into account the value of both indices e.g
in-dices of backward (BL) and forward linkages (FL). If a sector has the value of backward and
forward linkage greater than one, it means that this sector has a greater impact on the
suppli-ers of the inputs and that simultaneously it (as a supplier) has greater impact on the producsuppli-ers.
are the value of BL and FL indices. The key sectors with highest value are ranked (see table
9). Based on the values of the ranks of the indices obtained, it is found that the number of key
sector between 1995-2004 decreased from 10 in 1995 to 6 in the 2000 and 2004.
The most important key sector in the Polish economy is the sector of food products, beverages
and tobacco (ranked second in 2000 and first in 2004). Its strong position is a result of being
a main supplier for other sectors. In analyzed period the transport sector gained the most,
[image:15.595.70.530.247.733.2]be-cause it was ranked seventh in 1995 and second in 2004
Table 9. Power of dispersion and sensitivity of dispersion.
1995 2000 2004
Sector name
no Uj Ui Rank Uj Ui Rank Uj Ui Rank
Agriculture, hunting, forestry
and fishing 1 1,189 1,53 3 1,302 1,239 1 1,2 1,061 4
Mining and quarrying 2 0,976 1,22 1,051 0,899 0,96 0,857
Food products, beverages and
tobacco 3 1,407 0,97 1,11 1,357 2 1,07 1,324 1
Textiles, textile products,
leather and footwear 4 1,080 0,9 0,662 0,923 0,67 0,95
Wood and products of wood
and cork 5 1,189 0,79 0,823 1,096 0,83 1,153
Pulp, paper, paper products,
printing and publishing 6 1,133 1,1 9 0,919 0,979 0,95 1,078
Chemicals 7 1,150 1,4 4 1,19 0,919 1,23 0,986
Non-metalic products 8 1,090 1,11 10 1,059 1,024 1,09 1,051
Metal and metal products 9 1,226 1,27 5 1,162 1,065 5 1,16 1,081 5
Non-electrical equipment 10 1,088 1,17 8 0,808 0,985 0,72 1,032
Electrical equipment 11 0,564 0,57 0,787 1,006 0,78 1
Transport equipment 12 0,564 0,7 0,785 1,161 0,73 1,074
Other industrial product 13 1,093 0,83 0,706 1,101 0,74 1,125
Production and distribution
electricity 14 1,082 1,39 6 1,33 1,038 3 1,29 1,015 3
Construction 15 1,157 0,85 1,163 1,101 4 1,13 1,082 6
Trade 16 1,023 2,25 1 2,439 0,987 2,39 0,957
Hotel and restaurant 17 1,141 0,67 0,655 1,225 0,66 1,087
Transport 18 1,074 1,29 7 1,189 0,997 1,24 1,072 2
Post and telecommunication 19 0,969 0,87 0,993 1,008 0,97 0,918
Finance 20 1,259 0,8 1,152 1,062 6 1,08 0,944
Real estate 21 1,235 1,73 2 0,783 0,937 0,86 0,957
Renting machinery 22 0,564 0,57 0,624 0,743 0,66 0,883
Computer 23 0,564 0,57 0,669 0,901 0,75 0,885
R&D 24 0,978 0,57 0,643 0,873 0,73 0,96
Education 25 0,564 0,58 0,59 0,712 0,62 0,739
Health 26 0,880 0,61 0,615 0,795 0,65 0,822
The strength of this sector is connected with a high dependency on transport services in our
economy. Four sectors namely agriculture, metal, production of electricity and construction
belong, during all period, to the TOP 6 of Polish key sectors due to a great impact on the
sup-pliers of inputs. In table 9 the normalized values of backward and forward linkages of i.e. the
power of dispersion and sensitivity of dispersion are shown
Summary
The aim of this paper is to find better understanding of the pattern of structural changes in
industries and identify key sectors in Polish economy. To reach the details structural changes
the author applied a simple method, based on input-output framework.
Firstly, author performs the descriptive analysis, to show what is the role of each individual
sector in generating the total output and the total value added in Polish economy between
1995-2004. Locomotives of the Polish economy, which determine the level of total
produc-tion and which in each analyzed year are in TOP 5 of most productive sectors are: trade, food
products, beverages & tobacco and construction sector. The similar concentration among the
sectors with the highest share of total added value in our economy is observed. Five of 27
sectors generates nearly half its added value in Polish economy in each year analyzed. Three
of this five are most important i.e.: a trade sector, other services and construction.
Trade sector is the undisputed leader both in terms of share of this sector in the generation the
value added as well as in terms of its role in the growth of Polish economy. This sector
occu-pies first place in all years analyzed, having in each of these years the highest share in
gene-rating the value added as well as in the total output. On the other hand, the agriculture is
un-luckily the leader of strongest (in percentage points) drop in it shares in total added value and
in the total growth of the Polish economy.
Moreover, the results of analysis based on backward and forward linkages ( direct and total
linkages) allows to confirm the hypothesis about small structural changes in our economy.
Consistently, the same group of ten sectors has the strongest forward linkages in years 1995,
2000, 2004, with the agriculture’s sector as the leader. Thus the agriculture, although it loses
its position in generating the economic growth in Poland and also in creating the added value
in the Polish economy, still this sector is strongly linked with other sectors.
Also the role of six sectors, having the greatest impact of economy as suppliers in three
ana-lyzed years, have changed little. Among these sectors with largest backward linkages, food
The sector with both highest value of backward and forward linkages is identified as a key, so
in the last part of analysis the author tries to find the key sectors in Polish economy. First of
all it is observed that the number of key sector between 1995-2004 decreased from 10 in
1995 to 6 in the 2000 and 2004. At the end of the period analyzed to the group of the most
important sector in Polish economy belong: food products, beverages and tobacco (the
lead-er); transport; production and distribution electricity; agriculture, hunting, forestry and
fish-ing; metal and metal products and construction sector. Surprisingly, the trade sector is not
qualified for the group of key sectors in 2000 and 2004, although in 1995 the sector has been
a leader in the ranking of key sectors.
Comprehension check.
1.Describe the assumptions and the concept of input-output analysis.
2.Discuss the differences between forward and backward linkages in the economy.
3.Describe the methodology of key sector’s identification, proposed by P. Rasmussen.
Recommended readings.
1. Leontief W., Quantitative Input-Output Relations in the Economic System of the United
States, Review of Economics and Statistics, no 3, August 1936.
2. Leontief W, Input . Output Economics. Second ed., Oxford University Press, New York,
1986.
3. Rasmussen P.N., Studies in inter-sectoral Relations, North-Holland Publishing Company,
Amsterdam, 1956.
REFERENCES:
1. Andreosso-O’Callaghan B., Yue G., (2004), Intersectoral Linkages and Key Sectors in Chi-na, 1987-1997, Asian Economic Journal, no 18 (2), pp.165-183.
2. Aydin H., (2007), An Analysis of Input-Output Inter Industry Linkages in the Turkish Economy, Papers of the 16th International Input-Output Conference, Istanbul.
3. Bulmer-Thomas V., Input-Output Analysis in Developing Countries, John Wiley & Sons Ltd., 1982.
4. Bon R., (1986), Comparative stability analysis of deman-side and supply-side input-output models, International Journal of Forecasting, vol.2, no.2, pp.231-236
5. Cella G., (1984), The Input-Output Measurement of Interindustry Linkages, Oxford Bulle-tin of Economics and Statistics, no 46 (1), pp.73-84.
7. Claus I., Inter industry linkages in New Zealand, New Zealand Treasury Working Paper 02/09, 2002.
8. Department of Statistics, Poland, (1995), Polish Input-Output Tables 1995. 9. Department of Statistics, Poland, (2000), Polish Input-Output Tables 2000. 10. Department of Statistics, Poland, (2004), Polish Input-Output Tables 2004.
11. Dietzenbacher E (2002), Interregional Multipliers: Looking Backward, Looking Forward, Regional Studies, vol.36, no.2, pp.125-136.
12. Dietzenbacher E., van der Linden J.A, (1997), Sectoral and Spatial Linkages in the EC Production Structure, Journal of Regional Science, no. 37, pp. 235-257.
13. Ghosh A.,(1958), Input-Output Approach in an Allocative System. Economica, no 25, pp.58-64.
14. Hazari B. (1970), Empirical indentification of key sector in the Indian economy, Review of Economics and Statistics, vol.52, no 3, pp.301-305.
15. Leontief W., Quantitative Input-Output Relations in the Economic System of the United States, Review of Economics and Statistics, no 3, August 1936, pp. 105-125.
16. Leontief W, Essays in Economics. Theories, theorizing, facts, and policies. New Bruns-wick and Oxford, 1985.
17. Leontief W, Input . Output Economics. Second ed., Oxford University Press, New York, 1986.
18. Laumas P., (1975), Key sectors in some undeveloped countries., KYKLOS, no. 28, pp.62-79.
19. Laumas P., (1976), Key sector in some underdeveloped countries: A replay, KYKLOS, vo.29, no 4, pp.767-769.
20. McGilvray J., (1977), Linkages, key sectors and development stategy, Cambridge Univer-sity Press, Cambridge.
21. Miller R., Blair P.D, Input-Output Analysis, Prentice-Hall, 1985.
22. Rasmussen P.N., Studies in Inter-sectoral Relations, North-Holland Publishing Company, Amsterdam, 1956.
23. Robles L., Sanjuan J., Comparative analysis of input-output tables in time, Estadistica Espanola, vol. 47, no 158, pp.143-177.
24. Rose A., Chen Ch.,(1991), The join stability of Input Output production and allocations coefficients, Advances in Input-Output Analysis: Technology, Planning and Development, New York, Oxford University Press.
25. Schultz S, (1977), Approaches to Identifying Key Sectors Empirically by Means of Input-Output Analysis, Journal of Development Studies, no. 14, pp.77-96.
26. Sonis M., Guilhoto, J.J.M., Hewings, G.J.D Martins, E.B., (1995), Linkages, Key Sectors, and Structural Change: Some New Perspective, The Developing Economies, XXXIII (3), pp. 233-270.
27. Sonis M., Geoffrey J., Hewings M., Guo J. (2000), A New image of classical Key Sector Analysis: Minnimum Information Decomposition of the Leontief Inverse, Economic System Research, vol.12, no 3, pp.401-423.
28. Strassert G., (1968), .Zur Bestimmung strategischer Sektoren mit Hilfe von Input-Output- Modellen, Jahrbucher fur nationalokonomie und Statistik, no182, pp. 211-215.
29. Temurshoev U., (2004), Key Sectors in the Kyrgyzstan Economy, Discussion Paper No. 2004-135, Charles University.
30. Verspagen B., (2002), Structural change and technology, A long view, Eindhoven Centre of Innovation Studies- Working paper 02.13, Eindhoven University of Technology, Eindho-ven.