Universal Journal of Educational Research 7(1): 164-170, 2019 http://www.hrpub.org DOI: 10.13189/ujer.2019.070121
How the Length and Characteristics of Routing Module
Affect Ability Estimation in ca-MST?
Nagihan Boztunç Öztürk
Lifelong Learning Center, Hacettepe University, Turkey
Copyright©2019 by authors, all rights reserved. Authors agree that this article remains permanently open access under the terms of the Creative Commons Attribution License 4.0 International License
Abstract
In this study, how the length and characteristics of routing module in different panel designs affect measurement precision is examined. In the scope of the study, six different routing module length, nine different routing module characteristics, and two different panel design are handled. At the end of the study, the effects of conditions on measurement precision are examined by estimating correlation, RMSE and SEE for final theta estimation values. According to the results, it is seen that as the routing module length increases, lower RMSE and higher correlation are obtained. Nevertheless; good results were obtained in both panel designs even if the a and c distributions were outside the range suggested in the literature where routing module length is 15 and above. In addition, the three-stage panel design generally yielded better results in terms of measurement accuracy.Keywords
Computerized Multistage Testing, Routing Module, Routing Module Length, Item Characteristics, Measurement Precision1. Introduction
Computer adaptive test (CAT) which is conducted on a computer and the process of which depends on the test-taker’s answers has a wide range of application internationally. While CAT, in which item level based individualization is done, is a highly popular method in terms of providing fast and reliable results in proficiency estimation, ca-MST (computerized multistage testing), in which module level based individualization is done, has recently become more popular.
ca-MST is a good combination of linear test forms and traditional item-level CAT since it has both sides’ advantages. One thing is that with its quality of being adaptive, ca-MST is more effective than linear tests. Another advantage is that in ca-MST test developers can review test forms before application and test takers are allowed to review and revise answers [26].
As it can be seen in Figure 1 below, the algorithm based approach of a ca-MST refers to the tests in which the algorithm selects the items which are previously combined and called modules, and this test is constructed in stages. At the first stage of testing (module I in Figure 1) in a ca-MST an initial set of items, which sometimes can be named as routing module, is administered to the test takers. Based on their performance, then at the second stage, test takers are scattered to one of the many different modules whose adaptation is based on the test taker’s estimated proficiency level. The design of the ca-MST defines the number of stages and the number of available modules in each stage [22].
An example of a ca-MST application constructed according to 1-2-3 panel design is represented in Figure 1 below.
Here, one module (routing module) in the first stage, two modules (easy and difficult) in the second stage, and three modules (easy, medium, and difficult) in the third stage take place. The six possible pathways for test takers who take the test of that panel design are Routing-Easy-Easy, Routing -Easy-Medium, Routing-Easy-Hard, Routing-Hard-Easy, Routing-Hard-Medium, Routing-Hard-Hard. These pathways have an important role in test design, test assembly and application [13].
The first individualization in ca-MST application is provided by the scores that the individuals got from the routing module. It is expected that the routing module is usually constructed with enough items and average difficulty [22, 23]. Besides, a long routing module causes less fault in deciding on the module that an individual will take in the next stage [11, 16].
Figure 1. An example of a three-stage multistage testing structure [19].
Normally in a fixed test length, unless the routing module is not well adjusted in terms of length, second and third stages have the shortage of items and also the test cannot be adapted anymore. On the contrary, when the length of the routing module is not long enough, the measurement of ability for the second-stage adaptation can be not good enough [16]. Moreover, the measurement precision of the ability estimation is greatly affected by the statistical characteristics of the routing module [11]. For these reasons, the length and characteristics of the routing module has an important role both in ability estimation and for new researches.
In the literature, it is seen that there are also different studies which show how basic components affect the proficiency estimation when they are exposed to different conditions [2, 3, 4, 12, 14, 17, 21, 22] in addition to the fact that different applications have been tried to decrease the disadvantages of ca-MST application [9, 25].
In this study, the effect of routing module which is one of the basic components of ca-MST on measurement precision in condition that it has different lengths and item characteristics. While b parameters of the items in the routing module is kept constant in every condition, it is examined whether the distribution of a and c parameters are in between the value ranges suggested in the literature. In routing module length, on the other hand, the effect of the values which are above or below the suggested values of module length in literature on the ability estimation is investigated. Both variables are examined in both two and three-stage panel designs.
2. Method
In this study, it is aimed to examine the effect of routing module on proficiency estimation when it has different length and item characteristics.
Data construction: MSTGen [8] simulation software
tool is used to construct simulee and item data within the scope of the study. While 5000 simulees are simulated in the study, these individuals’ proficiency distribution is derived from a normal distribution (N(0,1)), the average of which is 0 and the standard deviation of which is 1. In the study, for ca-MST two different panel designs, one of which is 1-3 [1, 15, 16, 18] and the other is 1-3-3 [5, 7, 14], are simulated. In ca-MST, module and test length display characteristics depending on the characteristic being measured [24]. Studies in the literature reveal that while module lengths vary between 5 and 30, 20-item module is regarded as the most popular length [11, 24]. Besides, in previous MST studies, the dichotomous items ranging from 33 to 60 were used for test lengths [3]. In the study, routing module having different lengths is considered as the independent variable, and its effect on the proficiency estimation of different lengths is examined.
For this reason, the length of routing module varies between 5 and 30 items. In the second stage of panel design 1-3, modules length is 20 items, whereas in the second and third stage of panel design 1-3-3 modules consist of 10 items. According to that, item numbers in the stages and the test length of ca-MST are presented in Table 1.
Table 1. ca-MST panel designs
Panel Design = 1-3 Panel Design = 1-3-3
Number of Items
in Stages Length Test Number of Items in Stages Length Test
5-20 25 5-10-10 25
10-20 30 10-10-10 30
15-20 35 15-10-10 35
20-20 40 20-10-10 40
25-20 45 25-10-10 45
30-20 50 30-10-10 50
[image:2.595.308.538.594.721.2]166 How the Length and Characteristics of Routing Module Affect Ability Estimation in ca-MST?
simulee takes are made up of 25, 30, 35, 40, 45, and 50 items.
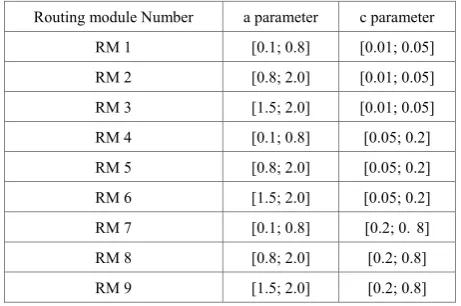
[image:3.595.59.290.314.467.2]b parameters of the items taking place in the modules are chosen as to create normal distribution and theta values which are defined in the panel designs of the study are chosen as to be the average; and standard deviation is defined as 0.3. The routing module is constructed to reflect one TIF center (theta points of 0.0) and two/three stage modules are constructed to reflect three TIF centers (theta points of -1.0, 0.0 and 1.0). The items in all the modules except the ones in the routing module are formed so that parameter a has a uniform distribution of [0.8; 2.0] and parameter c has a uniform distribution of [0.05; 0.2] [6, 19]. While parameter a and c in routing module are formed to have a uniform distribution, value ranges differentiated. According to that, parameter a and c of the items in routing module are presented in Table 2.
Table 2. The properties of parameter a and c of the items in routing modules
Routing module Number a parameter c parameter
RM 1 [0.1; 0.8] [0.01; 0.05]
RM 2 [0.8; 2.0] [0.01; 0.05]
RM 3 [1.5; 2.0] [0.01; 0.05]
RM 4 [0.1; 0.8] [0.05; 0.2]
RM 5 [0.8; 2.0] [0.05; 0.2]
RM 6 [1.5; 2.0] [0.05; 0.2]
RM 7 [0.1; 0.8] [0.2; 0.8]
RM 8 [0.8; 2.0] [0.2; 0.8]
RM 9 [1.5; 2.0] [0.2; 0.8]
As seen in Table 2, it is seen that the items in routing module number 3 have the most distinctiveness and the least guessing parameters, while the items in routing module number 7 have the least distinctiveness and the most guessing parameters.
As a result, in this study the effect of 108 different simulation conditions (= 2 panel designs x 6 routing module lengths x 9 routing module characteristics) on proficiency estimation is examined.
ca-MST Components: For ca-MST application, MSTGen [8] simulation software tool is used. In the scope of the study, Minimum Fisher Information method (MFI) is used as the module selection method. In temporary proficiency level and ultimate proficiency estimation, Expected Posteriori Distribution is used as the estimation method. As the test start rule, random item selection method whose item difficulty level varies between -0.5 and 0.5 is chosen. 100 replications are used in the study. Content balancing and item exposure control strategies are not processed by the use of control methods.
Data Analysis: To define the measurement precision, coefficient of Pearson-Moment Correlation and RMSE values are calculated. Moreover, the changes in standard error of estimation (SEE) for final theta estimation are
investigated based on the proficiency level.
3. Findings
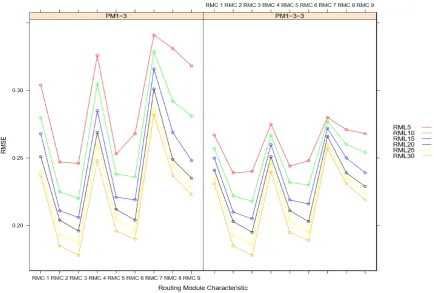
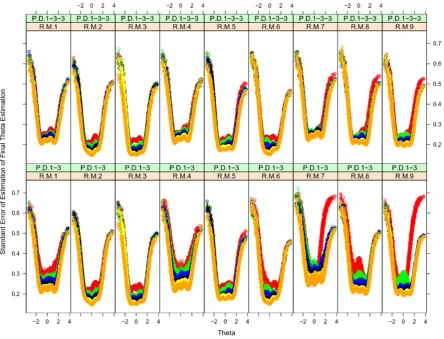
Correlation values obtained in the study are presented in Figure 2, those of RMSE are in Figure 3, and those of SEE for final theta are presented in Figure 4.
In Figure 2, it is seen that the highest correlation value in different lengths of routing modules in 1-3 panel design is obtained in RMC3, and the highest RMSE value is in RMC7. While RMC3 condition has the best distribution of a and c parameters in the routing module, RMC7 has the worst. As the length of the routing module increases, correlation values have also increased. When looking at the values in hand, it is clear that in different RMC conditions the lowest correlation values are in RML5 and the highest ones are in RML30. It is also seen that correlation values obtained in RMC2 and RMC3 conditions are very close to each other. However, the difference between correlation values increases in RMC8 and RMC9 conditions in which the distribution of a parameter is the same, but that of c parameter worsens.
The distribution of values obtained in 1-3-3 panel design also resemble to the one in 1-3 panel design. According to that, the highest correlation values in different lengths of routing modules which have the same routing module characteristics are obtained in RMC3, and the lowest ones are received in RMC7. The correlation values increase as the length of routing module in the same RMC condition increases. When the routing module length condition is considered, the lowest correlation values are derived in RML5, and the highest ones are in RML30.
When 1-3 and 1-3-3 panel designs are compared, it is observed that correlation values get closer to each other as the panel design switches from two-stage to three-stage structure. Increasing situation of correlation values can be more clearly seen in routing modules which are short and have bad distribution of a and c parameters. In RMC3 condition which has good routing module length and distribution of a and c parameters, the length of RML30 has almost the same correlation value; however, the biggest difference is observed in the correlation value of the length of RML5 in RMC7 condition.
Figure 2. Correlation values obtained in different routing module characteristics and different routing module length.
[image:4.595.80.515.439.732.2]168 How the Length and Characteristics of Routing Module Affect Ability Estimation in ca-MST?
Figure 4. Standard Errors of Estimation for Final Theta Estimation The distribution of values obtained in 1-3-3 panel design
also resemble to the one in 1-3 panel design. According to that, the lowest RMSE values in different lengths of routing modules are obtained in RMC3, and the highest ones are received in RMC7. Whereas RMC3 condition has the best distribution of a and c parameters in the routing module, RMC7 has the worst. As the length of the routing module increases, RMSE values have decreased. When looking at the values in hand, it is seen that the highest RMSE values are in RML5 and the lowest ones are in RML30. In RMC1, RMC4, and RMC7 conditions, a parameter in routing modules have the worst distribution, and for this reason RMSE values have been higher compared to other conditions.
When 1-3 and 1-3-3 panel designs are compared, it is observed that RMSE values have decreased as the panel design switches from two-stage to three-stage structure. This decrease can be more clearly seen in routing modules which are short and have bad distribution of a and c parameters. While in RMC3 condition which has good routing module length and distribution of a and c parameters, the length of RML30 has almost the same RMSE value, the biggest difference is observed in the RMSE value which RML5’s length has in RMC7 condition.
When Figure 4 is examined, in 1-3 panel design, it is
seen that in the peak-end proficiency distributions of different routing module lengths SEE values generally come closer to each other and they have high level of standard error. However, in RM7 and RM9 routing module conditions of RML5 condition there is a higher SEE in [2,4] proficiency parameter distribution. With the increase of the length of the routing module, this situation has disappeared. As the length of the routing module increases, the lowest SEE values are obtained in different RMC conditions. Especially in the [-2,2] range of the proficiency parameter distribution, close SEE values are obtained in the routing module of the same lengths.
In 1-3-3 panel design, too, it is seen that in the peak-end proficiency distributions of different routing module lengths SEE values generally come closer to each other and they have high level of standard error. However, when the panel design is 1-3-3, SEE difference that is received in the same RMC condition but different lengths of the routing module. Especially in RMC1, RMC4, and RMC6 conditions this situation is more obvious. As the panel design becomes three-staged, the high SEE values in the distribution of [2,4] proficiency parameter in RMC7 and RMC9 routing module in RML5 condition have disappeared.
RMC2, RMC3, RMC4 and RMC5 conditions are close to each other. Nevertheless, the lowest SEE values are obtained in RMC3 condition.
4. Conclusions
In this study, the effect of routing module length and routing characteristics in different panel designs on measurement precision is investigated. According to the results gathered in the end, it is observed that as the routing module length increases correlation values also increase, whereas RMSE values decrease. This situation occurs in both two-stage and three-stage panel designs. However, especially in conditions which have short routing module length, better results are reached in three-stage panel design.
For instance, when routing module length in RMC7 condition is 5 items, correlation value is .94 in two-stage panel design, while it is .96 in three-stage panel design. This value received in three-stage panel design is higher than many correlation values obtained in two-stage panel design. In RMC7xRLM5 condition which has the lowest value in three-stage panel design, in while a and c parameters have distributions other than the ones suggested in the literature in terms of routing module characteristic, it is very close to the correlation value gathered in RMC9xRML10 condition in two-stage panel design despite being the shortest routing module. However, in two-stage panel design RMC9xRML10 condition, different from RMC7xRML5 condition, is simulated in a better range than the range of a parameter and has the test length of 5 more items. Similar results are observed in examining RMSE values. It is seen that RMSE value in RMC7xRML5 condition is the highest in two-stage panel design. However, RMSE value obtained in three-stage panel design is seen to be closer to RMSE value in RMC9xRML10 condition in two-stage panel design.
While the changes of correlation and RMSE values obtained with the stage increase do not cause a significant difference in conditions whose long routing modules (RML25 and RML30), especially a and c parameters, are in ranges suggested in the literature (RMC2, RMC3, RMC5 and RMC6), they are very obvious in conditions where the ranges of short routing modules (RML5 and RML10), especially a and c parameters, are outside the ranges suggested in the literature (RMC1, RMC4, RMC7, RMC 8 and RMC9). These differences are much more in short routing module conditions (RML5 and RML10). In short, the distribution of a and c parameters affect panel designs which have short routing module more.
SEE values for the final estimation get closer to each other in almost every condition in peak-end proficiency distribution and received high values. In the distribution in [-2, 2] range of proficiency parameter, SEE values in different routing module lengths in two-stage panel design
are close to the ones in the same RMC condition. The difference among routing module lengths is more obvious in conditions where a and c parameters are outside the range suggested in the literature (RMC1, RMC4, RMC7, RMC 8 and RMC9) compared to the others that are inside. This difference is observed to decrease as the stage number increases in panel design.
Consequently, in conditions where routing module length is 15 and more, even though a and c distribution values of items in routing module are outside the range suggested in the literature, a better measurement precision is received in both two-staged and three-staged panel designs. According to that, if a short panel design is to be done, it is suggested that routing module length should not be under 15 items. If a module whose distribution values of a and c parameters in routing module are outside the suggested range and is to be used and the length is to be less than 15 items, it is strongly suggested that the stage number should be increased in panel design. As the item number in routing module increases, correlation values in each stage have increased but RMSE values have decreased. With the increase in routing module length, although there is a continuous improvement in measurement precision, it is necessary that routing module length should not be too much. In this case, researchers should consider the aims of their study and decide the routing module length accordingly.
The results obtained from the study generally support the findings in the literature [3, 11, 16]. According to the studies on routing module length in MST, Kim and Plake (1993) reported that the length of the routing module was important in reducing the size of the proficiency estimation errors, whereas Patsula (1999) and Kim, Tseng, Chung, and Dodd (2008) indicated that the length of the routing test has a little effect on the ability estimation. Considering the number of stage studies; it is seen that increasing the number of stages from two to three increases the measurement precision (10, 16).
170 How the Length and Characteristics of Routing Module Affect Ability Estimation in ca-MST?
number is fixed to 10 in three-staged design, so in different studies researchers may want to change the number of items in stages.
REFERENCES
[1] Adema, J. J. (1990). The construction of customized two-stage tests. Journal of Educational Measurement, 27(3), 241–253.
[2] Belov, D.I., & Armstrong, R.D. (2008). A monte carlo approach to the design, assembly, and evaluation of multistage adaptive tests. Applied Psychological Measurement, 32(2), 119-137.
[3] Chen, L-Y. (2010). An investigation of the optimal test design for multi-stage test using the generalized partial credit model (Unpublished Doctoral Dissertation). The University of Texas, Austin.
[4] Dallas, A. (2014). The effects of routing and scoring within a computer adaptive multi-stage framework (Unpublished Doctoral Dissertation). The University of North Carolina, Greensboro.
[5] Edwards, M. C., Flora, D. B. & Thissen, D. (2012) Multistage computerized adaptive testing with uniform item exposure. Applied Measurement in Education, 25:2, 118-141, doi: 10.1080/08957347.2012.660363
[6] Flaugher, R. (2000). Item pools. In H. Wainer (Ed.),
Computerized adaptive testing: A primer (pp.37-59). Mahwah, NJ: Lawrence Erlbaum.
[7] Hambleton, R. K. & Xing, D. (2006) Optimal and nonoptimal computerbased test designs for making pass– fail decisions. Applied Measurement in Education, 19:3, 221-239, doi: 10.1207/s15324818ame1903_4
[8] Han, K. T. (2013). MSTGen: simulated data generator for multistage testing. Applied Psychological Measurement. 37(8) 666–668. doi: 10.1177/0146621613499639
[9] Han, K.T. & Guo, F. (2013). An approach to assembling optimal multistage testing modules on the fly. GMAC Research Reports RR-13-01.
[10]Jodoin, M.G., Zenisky, A. & Hambleton, R. K. (2006) Comparison of the psychometric properties of several computer-based test designs for credentialing exams with multiple purposes. Applied Measurement in Education, 19:3, 203-220, doi: 10.1207/ s15324818ame1903_3
[11]Kim, H., & Plake, B. S. (1993). Monte carlo simulation comparison of two-stage testing and computerized adaptive testing. Paper presented at the Annual Meeting of the National Council on Measurement in Education (NCME) held between April 13-15, in Atlanta, GA.
[12]Kim, S., Moses, T. & Yoo, H. H. (2015). Effectiveness of item response theory (IRT) proficiency estimation methods under adaptive multistage testing. ETS Research Report Series ISSN 2330-8516. doi: 10.1002/ets2.12057
[13]Luecht, R. (2000). Test information targeting strategies for adaptive multistage testing designs. Paper presented at the
Annual Meeting of the National Council on Measurement in Education, Chicago, IL, (NCME Session A2).
[14]Luecht, R., Brumfield, T. & Breithaupt, K. (2006). A testlet assembly design for adaptive multistage tests. Applied Measurement in Education, 19(3), 189-202. doi.org/10.1207/s15324818ame1903_2
[15]Luecht, R. M., & Nungester, R. J. (1998). Some practical examples of computer-adaptive sequential testing. Journal of Educational Measurement, 35(3), 229–249.
[16]Patsula, L. N. (1999). A comparison of computerized adaptive testing and multistage testing (Unpublished Doctoral Dissertation). University of Massachusetts, Amherst.
[17]Rotou, O., Patsula, L., Manfred, S., & Rizavi, S. (2003).
Comparison of multi-stage tests with computerized adaptive and paper-pencil tests. Paper presented at the annual meeting of the American Educational Research Association (AERA) and the National Council on Measurement in Education (NCME) held between April 21-25, 2003, in Chicago, IL.
[18]Schnipke, D. L. & Reese, L. M. 1999. A comparison of testlet-based test designs for computerized adaptive testing. Computerized Testing Report 97-01. Newtown, PA: Law School Admissions Council.
[19]Urry, V. W. (1977). Tailored testing: a successful application of latent trait theory. Journal of Educational Measurement, 14(2), 181-196.
[20]Wang, K. (2017). A fair comparison of the performance of computerized adaptive testing and multistage adaptive testing (Unpublished Doctoral Dissertation). Michigan State University, Michigan.
[21]Xu, T. (2010). A review of exposure control strategies for CAT and potential applications in MST. Retrieved 13 September, 2018 from https://pdfs.semanticscholar.org/622 d/d2c4e5ae8da9657ecdd977b320f29bfd8a75.pdf
[22]Yan, D., Lewis, C., & von Davier, A. A. (2014). Overview of computerized multistage tests. S:3-20. In Yan, von Davier, & Lewis (Eds.) Computerized multistage testing Theory and Applications
[23]Zenisky, A. L., & Hambleton, R. K. (2004). Effects of Selected Multi-Stage Test Design Alternatives on Credentialing Examination Outcomes, NCME, San Diego, CA, April, 2004.
[24]Zheng, Y. & Chang, H-H. (2014). Multistage testing, on-the-fly multistage testing, and beyond. In Y. Cheng, & H-H. Chang (Eds.), Advancing methodologies to support both summative and formative assessments. Charlotte, NC: Information Age Publishing. S: 21-40
[25]Zheng, Y. & Chang, H-H. (2015). On-the-fly assembled multistage adaptive testing. Applied Psychological Measurement. 39(2), 104-118.
![Figure 1. An example of a three-stage multistage testing structure [19].](https://thumb-us.123doks.com/thumbv2/123dok_us/8766990.896964/2.595.308.538.594.721/figure-example-stage-multistage-testing-structure.webp)