Software Quality Methodology to Train Engineers as
Evaluators of Information Systems Development Tools
Laura Silvia Vargas Pérez
1, Agustín Francisco Gutiérrez Tornés
2,*, Edgardo Manuel Felipe Riverón
3,
Ana María Soto Hernández
1, Norma Ivone Peña Galeana
21Investigador del Instituto Tecnológico de Ciudad Madero, Tamaulipas, México 2Investigador de la Universidad Autónoma de Guerrero, México
3Investigador del Centro de Investigación en Computación, Instituto Politécnico Nacional, México
Copyright©2018 by authors, all rights reserved. Authors agree that this article remains permanently open access under the terms of the Creative Commons Attribution License 4.0 International License
Abstract
To have software tools that facilitate the rapid development of applications and generate information systems is a requirement in a globalized world. Worldwide in the engineers training field it is basic to apply measurements and evaluations to the rapid design tools used to obtain applications faster and generate quality information systems in order to determine the best for this purpose. This paper revises MECRAD and proposes its introduction in the formation programs of engineers which is a methodology for the technical evaluation of the visual environments tools to generate information systems where this type of commercial products are evaluated using as reference basic elements of international standards. With this methodology one can evaluate and select in an effective and easy way, those tools and development platforms best suited to create applications in visual environments, in order to generate information systems with quality and sustainability. It is useful for higher education institutions, organizations, companies and system’s end users, among others.Keywords
Software Quality, Technical Evaluation Qualimetric Model, Visual Environment, RAD Tools1. Introduction
To improve any software, it is necessary to measure attributes through a significant set of metrics that provide indicators that lead to a technical quality assessment of the product. By carrying out this process through a software qualimetric model, it is more probable that one will access the requirements to comply. The way in which the quality characteristics have been defined in most standards models
does not allow their direct measurement, so the establishment of metrics to correlate these features in a software product is needed.
The first step in designing a software qualimetric model is the determination of the relevant quality properties. Usually they are described through a hierarchical tree structure where the characteristics appear at the highest level, the sub-characteristics in the intermediate and the attributes in the lowest. Its goal is to facilitate the qualitative and quantitative evaluation of these components. [1] [2] [3] [4].
At an international level, tools to facilitate the creation of new information systems for the most diverse applications periodically emerge. It is imperative to identify and evaluate these tools as quick as possible, to determine whether they meet the quality requirements established globally or by the software houses that produce those [5], [6], [7], [8].
1.1. Objectives
When training world-class software and systems engineers, it is necessary to carry out evaluations of various products. Therefore it is essential to perform the evaluations of software applications designing and developing tools to determine, which are the best for the programmers to choose to work on. Actually, even some jobs proposals are focused on the software development processes evaluation.
order to select the most suitable has become today and updated technical necessity
That is the reason why, in this case, this article proposes the introduction in high level engineering programs of the training and manipulation of MECHDAV (Quality Evaluation of Application Development Tools in Visual Environments) and MECRAD (Rapid Applications Development Quality Evaluation Model) which particularly allow a comparative analysis of different tools of this type. They are based upon the following standards: IEEE 1061 (Software Quality Metrics aMethodology) and ISO/IEC 9126 (Software Product Quality), 14598 (Software Evaluation Process) and 25000 (SQuaRE-Software Quality Requirements and Evaluation). MECA (Modelo para la Evaluación de la Calidad), MACS (Metodología para el Aseguramiento de la Calidad del Software) and SUMI (Software Usability Measurement Inventory) models were also taken as reference for its stablishment [2] [3] [6] [7] [8] [9] [10].
1.2. State of the Art and Related Works
During the last three decades a varied type of software quality models have been proposed. They are very useful, but in turn very generic, so they should be adapted or reconfirmed in order to use them to articulate more particular and concrete applicable models [21] [22] [23] [24] [25] [26] [27] [28] [29].
Regarding RAD we have no knowledge of the existence
of any other evaluation model or tool but MECHDAV and MECRAD. These model and tool have been also used by others researchers and academics in their work in different areas [16] [17] [18] [19] [20].
2. Methodology
A proper methodology was generated (with models, processes, techniques and tools), that allows making comparisons and carrying out RAD tools technical evaluations, which is briefly describe ahead. The operation method is quite simple and the evaluators just must fulfill the data asked for by the program. The rest of the process is fully atomized. The complete evaluation process is carried out and culminates with a technical opinion of the quality reached by the product, together with the recommendations and criteria to be followed. This result can be analyzed by those interested according to the purposes of the evaluation, for example acquiring a product.
2.1. Evaluation Process
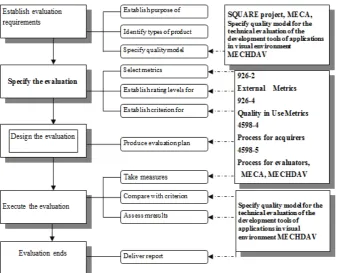
[image:2.595.129.467.451.724.2]When evaluating software quality, first one establishes the quality requirements model under which the evaluation is specified, designed and executed. The evaluation activities are then indicated in a process. In this proposal it comprises five activities as it is shown in Figure 1.
2. 2. Compacting MECRAD Pattern
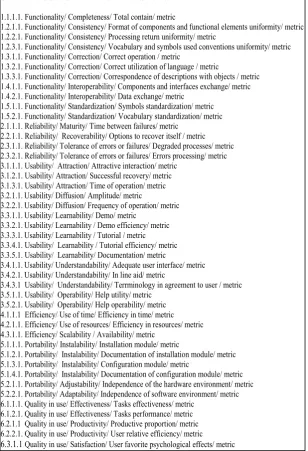
MECRAD´s complete model is shown in Figure 2. Since one of the purposes of this technical model is to provide a range for comparison for any kind of user (expert or beginner) the metrics suggested for beginner users are defined in a subset of this complete model, and are shown in Figure 3.
2.3. Metrics and Evaluation Scale Definition
The quantifiable attributes must be measured, quantitatively, through metrics. The result, the value measured, can then be mapped on a scale. This value does not show in itself the level of satisfaction of the requirements. For this purpose the scale is divided into
[image:3.595.145.454.284.736.2]ranges corresponding to the different degrees of satisfaction. There are several ways to do this. For example one can simply divide the scale in two categories: unsatisfactory and satisfactory, or create a scale with five levels (mandatory categories) for an evaluated product: levels A, B, C, D and E as shown in Figure 4 where level A is the best case, the one that would be the ideal level to achieve. Level B is considered achievable within the reasonable use of the available resources. Level C indicates the control point, the one should be maintained so that the system does not further deteriorate. Level D is the user’s acceptance limit value. Finally, the worst case is level E, where the product does not meet requirements minimum quality.
Figure 2. MECRAD`s complete model
Characteristic/ Sub Characteristic/ Attribute/ metric
1.1.1.1. Functionality/ Completeness/ Total contain/ metric
1.2.1.1. Functionality/ Consistency/ Format of components and functional elements uniformity/ metric 1.2.2.1. Functionality/ Consistency/ Processing return uniformity/ metric
1.2.3.1. Functionality/ Consistency/ Vocabulary and symbols used conventions uniformity/ metric 1.3.1.1. Functionality/ Correction/ Correct operation / metric
1.3.2.1. Functionality/ Correction/ Correct utilization of language / metric 1.3.3.1. Functionality/ Correction/ Correspondence of descriptions with objects / metric
1.4.1.1. Functionality/ Interoperability/ Components and interfaces exchange/ metric 1.4.2.1. Functionality/ Interoperability/ Data exchange/ metric
1.5.1.1. Functionality/ Standardization/ Symbols standardization/ metric 1.5.2.1. Functionality/ Standardization/ Vocabulary standardization/ metric 2.1.1.1. Reliability/ Maturity/ Time between failures/ metric
2.2.1.1. Reliability/ Recoverability/ Options to recover itself / metric 2.3.1.1. Reliability/ Tolerance of errors or failures/ Degraded processes/ metric 2.3.2.1. Reliability/ Tolerance of errors or failures/ Errors processing/ metric 3.1.1.1. Usability/ Attraction/ Attractive interaction/ metric
3.1.2.1. Usability/ Attraction/ Successful recovery/ metric 3.1.3.1. Usability/ Attraction/ Time of operation/ metric 3.2.1.1. Usability/ Diffusion/ Amplitude/ metric
3.2.2.1. Usability/ Diffusion/ Frequency of operation/ metric 3.3.1.1. Usability/ Learnability/ Demo/ metric
3.3.2.1. Usability/ Learnability / Demo efficiency/ metric 3.3.3.1. Usability/ Learnability / Tutorial / metric 3.3.4.1. Usability/ Learnability / Tutorial efficiency/ metric 3.3.5.1. Usability/ Learnability/ Documentation/ metric
3.4.1.1. Usability/ Understandability/ Adequate user interface/ metric 3.4.2.1. Usability/ Understandability/ In line aid/ metric
3.4.3.1 Usability/ Understandability/ Terrminology in agreement to user / metric 3.5.1.1. Usability/ Operability/ Help utility/ metric
3.5.2.1. Usability/ Operability/ Help operability/ metric 4.1.1.1 Efficiency/ Use of time/ Efficiency in time/ metric 4.2.1.1. Efficiency/ Use of resources/ Efficiency in resources/ metric 4.3.1.1. Efficiency/ Scalability / Availability/ metric
5.1.1.1. Portability/ Instalability/ Installation module/ metric
5.1.2.1. Portability/ Instalability/ Documentation of installation module/ metric 5.1.3.1. Portability/ Instalability/ Configuration module/ metric
5.1.4.1. Portability/ Instalability/ Documentation of configuration module/ metric 5.2.1.1. Portability/ Adjustability/ Independence of the hardware environment/ metric 5.2.2.1. Portability/ Adaptability/ Independence of software environment/ metric 6.1.1.1. Quality in use/ Effectiveness/ Tasks effectiveness/ metric
Figure 3. Subset of the MECRAD model suggested for the evaluation of the product by a novice user
Figure 4. Metric measurement scale ranges and ranks.
Since a metric is defined as "a quantitative measure of the degree to which a system, component or process possesses a given attribute " [5], in order to properly measure the different tool performance one must follow these guidelines: • Observation of the software performance in order to evaluate the difference between the current execution results and
the requirements specification (a view on test and quality validation).
• Unexpected occurrences on performance time or resources utilization during the software operation. 1.3.1.1. Functionality/ Correction/ Correct utilization of language / metric
3.1.3.1. Functionality/ Correction/ Correspondence of descriptions with objects / metric 1.5.1.1. Functionality/ Standardization/ Vocabulary standardization/ metric
1.5.2.1. Functionality/ Standardization/ Symbols standardization/ metric 3.1.1.1. Usability/ Attraction/ Attractive interaction/ metric
3.2.1.1. Usability/ Diffusion/ Amplitude/ metric
3.2.2.1. Usability/ Diffusion/ Frequency of operation/ metric 3.3.1.1. Usability/ Learnability/ Demo/ metric
3.3.2.1. Usability/ Learnability / Demo efficiency/ metric 3.3.3.1. Usability/ Learnability / Tutorial / metric 3.3.4.1. Usability/ Learnability / Tutorial efficiency/ metric 3.3.5.1. Usability/ Learnability/ Documentation/ metric
3.4.1.1. Usability/ Understandability/ Adequate user interface/ metric 3.4.2.1. Usability/ Understandability/ In line aid/ metric
3.4.3.1 Usability/ Understandability/ Terrminology in agreement to user / metric 3.5.1.1. Usability/ Operability/ Help utility/ metric
3.5.2.1. Usability/ Operability/ Help operability/ metric 5.1.1.1. Portability/ Instalability/ Installation module/ metric
5.1.2.1. Portability/ Instalability/ Documentation of installation module/ metric 5.1.3.1. Portability/ Instalability/ Configuration module/ metric
5.1.4.1. Portability/ Instalability/ Documentation of configuration module/ metric 6.3.1.1. Quality in use/ Satisfaction/ User favorite psychological effects/ metric
VALUE %FULFILLMENT MEANING / INTERPRETATION RANK
1.0 90-100 Excellent / Always A 0.8 70-89 Satisfactory / Almost always B 0.6 50-69 Acceptable / Regularly C 0.4 30-49 Deficient / Sometimes D 0 0-29 Unacceptable / Never or rare times E
[image:4.595.116.485.361.672.2]Therefore, evaluating all attributes belonging to a given sub characteristic one obtains an average value that evaluates that sub characteristic in particular. Then, evaluating all the sub characteristics of a given characteristic the user calculates another average value that evaluates that characteristic in particular. Finally, evaluating all the characteristics a new average value that corresponds to the software product as a whole is calculated. The mathematical method is the following: Quality indicator of the product t:
𝐼𝐼𝐶𝐶𝑡𝑡=∑ 𝐼𝐼𝐶𝐶𝐶𝐶𝑗𝑗 𝑛𝑛 𝑗𝑗=
𝑛𝑛
Where:
ICCj is the quality indicator of the characteristic j
n is the number of characteristics in the model Quality indicator of the characteristic j:
𝐼𝐼𝐶𝐶𝐶𝐶𝑗𝑗=∑ 𝐼𝐼𝐶𝐶𝐼𝐼𝐶𝐶𝑘𝑘 𝑚𝑚 𝑗𝑗=
𝑚𝑚
Where:
ICSCk is the quality indicator of the subcharacteristic k
m is the number of subcharacteristics within the characteristic k
Quality indicator of the subcharacteristic k:
𝐼𝐼𝐶𝐶𝐼𝐼𝐶𝐶𝑘𝑘=∑ 𝑉𝑉𝑉𝑉𝑉𝑉𝑥𝑥 𝑘𝑘 𝑥𝑥=
𝑘𝑘
Where:
VAAx is the assigned value to the attribute x
K is the number of attributes within the subcharacteristic k.
Thus, when applying the evaluation format you use three types of metrics:
• Direct instructions to the user for carrying out a specific task, taking note of certain indicators (for example: time, number of occurrences of certain event, etc.) The result will be a quantity within the proposed range.
• Direct questions to the user to determine the existence of an essential attribute within the evaluated tool. The result will be an affirmative () or a negative (0) one. • Metrics that depend on the value of certain indicator
derived from the realization of a certain task. They serve to calculate a set of parameters with values within the proposed interval.
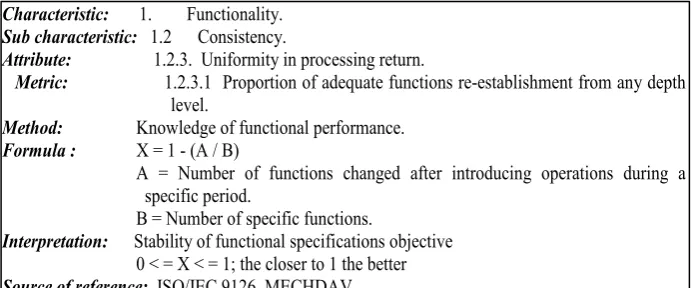
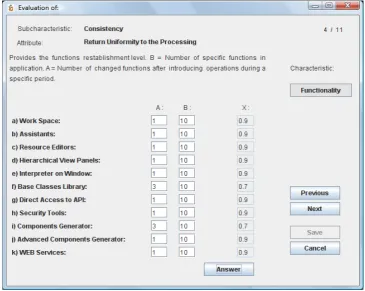
[image:5.595.125.471.388.532.2]In order to support the model, forty-four metrics were documented and developed, just as it appears in the formats in Figure 5 and 6. Another eleven metrics were adapted from SUMI [0], making a grand total of fifty-five metrics involved.
Figure 5. Documentation of a model metric Characteristic: 1. Functionality.
Sub characteristic: 1.2 Consistency.
Attribute: 1.2.3. Uniformity in processing return.
Metric: 1.2.3.1 Proportion of adequate functions re-establishment from any depth
level.
Method: Knowledge of functional performance.
Formula : X = 1 - (A / B)
A = Number of functions changed after introducing operations during a specific period.
B = Number of specific functions.
Interpretation: Stability of functional specifications objective
0 < = X < = 1; the closer to 1 the better
Figure 6. Automation example within MECRAD
Recording the partial and total results of the software quality evaluation is not an easy task. Simple and understandable formats must be chosen to obtain a quick and reliable assessment of their measurement values. Therefore checklists, simple relationship tables and control matrices are implemented. Checklists are questionnaires where assertions must confirmed by selecting one of the values given in a scale. These questions are in principle made in such a way that they generate ideas (valuations). They are used to control each separate phase or all the work to be done. A control matrix is a complementary tool related to all aspects of a process that serves to summarize the content and the development of a whole system. It usually includes a control variable (what is measured), the measurement form, place and time, the base standard, who does the analysis, who acts and how to act. The control matrices are important for the design, implementation and maintenance of the control system of the obtained results.
3. Results Discussion
The case studies chosen for the tests of the RAD tools are the commercial visual platforms Visual Studio.Net, Net Beans and Eclipse.The results obtained through the application of the MECRAD tool are the following:
VisualStudio.Net obtained a general average evaluation of 0.89 (89%) for beginners and a punctuation of 0.88 (88%) among experts (See Figure 7). Its weakness lies in portability. This is comprehensible, due to its dependence upon Microsoft´s Windows platform. Its quality classification level is Satisfactory, without recommendations, since it does not require modifications in its design (only updating) and it is accepted thoroughly.
The results obtained from the other two products in their evaluation, have only 2% of variability. The level of quality classification obtained in these development platforms was Excellent for Net Beans (See Figure 8) and Eclipse (See Figure 9).
Figure7. FinaltechnicalevaluationreportoftheVisualStudio.NETenvironmentversion20environmentversion4.4
Figure9. FinaltechnicalevaluationreportoftheEclipsevisual environment 7.0
4. Conclusions and Recommendations
Any of the three visual environment system mentioned above are considered technically advisable for application developments. For that reason, if one requires a decision about the acquisition of some of these environments, one must consider other important parameters, such as cost, platform, systems interacting within the environment, etc. The model does not contemplate these parameters, since it is limited to the technical quality evaluation of the visual tools themselves. MECHDAV AND MECRAD are already commercially in operation, therefore the information concerning its development and its source code is not available
As a future work, it would be advisable to make periodic revisions of the model for its improvement, attempting for example to introduce the evaluation of tools in the visual WEB sites environment.
As a conclusion we once more state that the inclusion of the training and manipulations of this kind of quality tools will enrich the professional stock of future system and software engineers.
Acknowledgments
Finally, the authors wish to thank the Center of Computer Research (CIC) and the National Polytechnic Institute (IPN), the Autonomous University of Guerrero (UAGro) and the Technological Institute of Ciudad Madero (ITCM), all of them located in Mexico, for their support in carrying out this research.
REFERENCES
[1] R. Pressman, Ingeniería de Software. Un enfoque práctico, McGraw Hill/Interamericana de España, S.A.U. Séptima Edición, 2005.
[2] A. Gutiérrez, Modelo de evaluación para el aseguramiento de la calidad del Software, Modelo MECA. Instituto Politécnico Nacional, 2003.
[3] A. Gutiérrez, Metodología para el aseguramiento de la calidad del Software MACS”. Instituto Politécnico Nacional, 1999.
[4] ISO924, Ergonomics of human-system interaction; Part 5 Guidance on World Wide Web user interfaces; and Industry Standards for User Centered Design, October 2000, www.usability.serco.com/trump, 2008.
[5] IEEE60, Software Engineering Standards Collection, Standard Glossary of Software Engineering Terminology. IEEE, Std. 60.2-90, 1994.
[6] IEEE06:992, Software Quality Metrics Methodology, IEEE 06 Standard for a Software Quality Metrics Methodology, 1992.
[7] ISO/IEC926, Software Product Evaluation; Parte : Quality, Characteristics and Guidelines for their Use; Parte 2: Métricas externas para una validación de la calidad de software; Parte 3: Métricas externas para una validación de la calidad de software, 1997.
[8] ISO/IEC4598, Information Technology, Software Product Evaluation. (Parts, 2, 3, 4, 5), 1998.
[9] ISO/IEC 25000 “SQuaRE System and Software Quality Requirements and Evaluation”, JTC C/SC7/ WG6 N2246. Plan y configuración de los requerimientos de calidad de software y evaluación. SQUARE2000, 2005.
[10] SUMI 2000, Human Factors Research Group, 2000. SUMI: Software Usability Measurement Inventory, European Directive on Minimum Health and Safety Requirements for Work with Display Screen Equipment (90/270/EEC). Ireland, 2000.
[11] M. Moreno, Aplicación de las Métricas de Calidad del Software en la Evaluación Objetiva de Gramáticas Independientes de Contexto Inferidas. I Simposio Avances en Gestión de Proyectos y Calidad del Software. Salamanca, España, pp. 209-220, 2004.
[12] L. Olsina, Medición y Evaluación de Calidad en Uso: Un Caso de Estudio para una Aplicación E-Learning. 9º Taller Iberoamericano de Ingeniería de Requisitos y Ambientes de Software, La Plata, Argentina, pp. 37-330, ISBN-0:950-34- 0360, 2006.
[13] M. Piattini, Métricas para la Evaluación de Modelos de Proceso de Negocio. 9º Taller Iberoamericano de Ingeniería de Requisitos y Ambientes de Software, La Plata, Argentina, pp. 49-432, ISBN-0:950-34-0360; pp. 49-43, ISBN-0:950-34- 0360, 2006.
[14] O. Pastor, Evaluación de la Usabilidad en un Entorno de Arquitectura Orientadas a Modelos. 9º Taller Iberoamericano de Ingeniería de Requisitos y Ambientes de Software, La Plata, Argentina, pp. 33-344, ISBN-0:950-34-0360, 2006.
[15] L.S. Vargas-Pérez, A.F. Gutiérrez- Tornés, E.M. FelipeRiverón. MECRAD: Model and Tool for the Technical Quality Evaluation of Software Products in Visual Environment. ICCGI5.2, 4th International Conference on Wireless and Mobile Communications (ICWMC 2008) and 3rd International MultiConference on Computing in the Global Information Technology (ICCGI 2008). Product Number E3275. BMS Part Number CFP0840B-CDR. ISBN 978-0-7695-3275-2. Library of Congress Number 200892637 pp. 07-2. IEEE Computer Society. IARIA. Athens, 2008.
[16] Villalba, M. T., Fernandez-Sanz, L., & Martínez, J. J. ; Empirical support for the generation of domain-oriented quality models. IET software, 4(1), 1-14, England, 2010. [17] Villalba, M. Teresa, et al.; Software quality evaluation for
security COTS products. International Journal of Software Engineering and Knowledge Engineering, vol. 20, no 01, p. 27-48, Singapur, 2010.
[19] Cruel, Mejía; Yomira Nathali; Caracterización de metodologías de métricas de software para la optimización del desarrollo web. Tesis Doctoral. Ecuador-PUCESE-Escuela de Sistemas y Computación, Ecuador. 2018.
[20] Villalba de Benito, M. T. Metodología de desarrollo de modelos de calidad orientados a dominio y su aplicación al dominio de los productos finales de seguridad de tecnologías de la información , Tesis Doctoral, Universidad de Alcalá, Departamento de Ciencias de la Computación, España. 2009.
[21] Karner, G. Resource estimation for objectory projects. Objective Systems SF AB, 17. 1993.
[22] Kitchenham, B., Pfleeger, S. L., & Fenton, N. Towards a framework for software measurement validation. IEEE Transactions on software Engineering 21(12), 929-944.1995.
[23] Lorenz, M., & Kidd, J. Object-oriented software metrics. (Vol. 131). Englewood Cliffs: Prentice Hall. 1994.
[24] Marchesi, M. OOA metrics for the Unified Modeling Language. Software Maintenance and Reengineering. Proceedings of the Second Euromicro Conference on (pp. 67-73), IEEE. 1998.
[25] McGarry, J., Card, D., Jones, C., Layman, B., Clark, E., Dean, J., & Hall, F., Objective information for decision makers Practical Software Measurement. 2002
[26] Ragland, B. Measure, metric or indicator: What's the difference? Crosstalk, 8(3), 29-30. 1995.
[27] Vázquez, P. J., Moreno, M. N., & Garcıa, F. J. Métricas orientadas a objetos. Informe técnico DPTOIA-IT-2001-02. Universidad de Salamanca, España. 2001.
[28] Baneres, David, Montse Serra, and M. Elena Rodriguez. Herramienta de soporte a la evaluación de la calidad docente de los estudios universitarios. Actas de las XXI Jornadas de la Enseñanza Universitaria de la Informática. Universitat Oberta La Salle. 2015.