International Journal of Emerging Technology and Advanced Engineering
Website: www.ijetae.com (ISSN 2250-2459, Volume 2, Issue 7, July 2012)124
Estimation of Soil Erosion using Remote Sensing and GIS and
Prioritization of Catchments
Sujata Biswas
Assistant Professor, Department of Civil Engineering, Bengal Engineering and Science University, Shibpur Howrah – 711 103, West Bengal, India
Abstract — Soil erosion is one of the most critical environmental hazards of recent times. A large area suffers from soil erosion, which in turn, reduces productivity. Methods such as the Universal Soil Loss Equation or Revised Universal Soil Loss Equation are widely used for the estimation of soil erosion from catchment areas. The paper deals with the estimation of soil erosion using Universal Soil Loss Equation in a GIS environment and prioritization of catchments on that basis. Upper Kangsabati catchment in West Bengal, India was taken as the study area. Satellite Images of IRS‐P6 LISS‐III have been georeferenced with respect to SOI toposheets(1:50,000 scale). The drainage network and the catchment have been identified from the mosaiced toposheet and updated from satellite imagery. Landuse, soil and slope maps were prepared from Survey of India maps and NBSS & LUP maps and integrated into GIS database. Soil erosion of each of the subcatchment was estimated from the integrated map. The subcatchments were prioritized based on the estimation of erosion. From the study it can be inferred that soil erosion estimation using Remote Sensing and GIS technique can be effectively used for prioritization of catchments and this helps in the way the catchments can be taken for treatment for conservation measures.
Keywords — erosion, GIS, prioritization, remote sensing, USLE
I. INTRODUCTION
Soil erosion is one of the most serious problems in recent times which affects both cultivable and forest lands. It creates serious problems in agriculture and water resources management by removing the top fertile soil and its subsequent deposition in reservoirs and lakes.
Integrated use of remote sensing and GIS can be used in soil erosion assessment studies. The input parameters required for soil erosion modeling can be generated by remote sensing. Geographical Information System helps in creation of a database for the catchment which is very much useful for carrying out spatial analysis thereby helping the decision makers in framing appropriate measures for critically affected areas.
In the recent past sediment yield and soil erosion studies using GIS and remote sensing technologies have been carried out by many investigators.
Soil erosion from a catchment is controlled by climatic, topographic, geologic and landuse characteristics. Scientific planning of soil conservation requires knowledge of the relations among those factors that cause loss of soil and help to reduce losses. Simple methods such as the Universal Soil Loss Equation, Modified Universal Soil Loss Equation etc. are used for estimation of surface erosion and sediment yield from catchment areas. A few of them are reported below.
International Journal of Emerging Technology and Advanced Engineering
Website: www.ijetae.com (ISSN 2250-2459, Volume 2, Issue 7, July 2012)125 In the present study, an attempt has been made to estimate soil erosion from a catchment and prioritize the subcatchments on that basis.
II. STUDY AREA
The study area taken is the Upper Kangsabati catchment which falls mostly in Puruliya district and partly in Bankura district of West Bengal which lies between 23000’N and 23030’N latitude and 86000’E and 86045’N longitude. The downstream of the catchment is Kangsabati reservoir.The total area of the catchment is approximately 1448 sq. Km. The area is falling under toposheets bearing no. 73 I/3, 73 I/7, I/8, I/11 and 73 I/12 published by Survey of India (SOI) on a 1:50,000 scale.
III. DATA USED
Satellite Image of IRS-P6 LISS-III (acquired on 2006) and Survey of India toposheets mentioned above of 1:50,000 scale as collateral data.
IV. METHODOLOGY
The Survey of India(SOI) toposheets for the study area have been procured, scanned and geometrically rectified so that each point represents correct geographical coordinates. Satellite Images of IRS-P6 LISS-III have been georeferenced with respect to toposheets and mosaiced. The drainage network (streams and tributaries) and the catchment have been identified from the mosaiced toposheet and updated from satellite imagery. The catchment was divided into subcatchments. The work has been carried out using Image Processing software ERDAS Imagine.
V. SOIL LOSS ESTIMATION BY USLE MODEL
The USLE model suggested by Wischmeir and Smith (1965) has been used for the computation of soil loss
where A is the soil loss per unit area, R is the rainfall factor, C is the cropping and management factor, K is the soil erodibility factor, LS is the slope length and steepness factor and P is the conservation practice factor. Here the erosivity of rain is represented by R and the erodibility of soil surface system by the factors KLSCP.
A. Computation of Cropping and Management factor C
Landuse map for the Puruliya district was collected from NATMO (National Atlas Thematic Mapping Organisation), Kolkata and district map from Survey of India. The district map was rectified with respect to SOI toposheets.
Landuse map was rectified with respect to district map. The landuse map for the catchment was extracted and vectorized using ERDAS Imagine software. The different types of landuse were added in ArcView GIS software. The C factor was calculated depending upon different landuse types as per the Table I.(Wischmeier, Smith (1978)).
TABLEI DIFFERENT C FACTOR VALUES
Landuse C factor
Open forest 0.02
Agricultural Land 0.27
Barren land 0.21
Settlement 0.15
B. Computation of Soil Erodibility Factor K
The soil map for the district was collected from SOI and rectified with respect to district map. The soil map for the catchment was extracted and vectorized using ERDAS Imagine software. The soil attributes were added in ArcView GIS software. Information about soil characteristics as obtained from NBSS & LUP Kolkata were used to determine the values of K factors. The values were estimated from Chowdhury and Nayak, 2003 following Table II.
TABLEII VALUES OF K FACTOR
Soil erodibilty factor(K)
Organic matter content(%)
<0.5 2.0 4.0
Sandy Loam 0.27 0.24 0.19
Sandy Clay Loam
0.27 0.25 0.21
C. Computation of P factor and LS factor
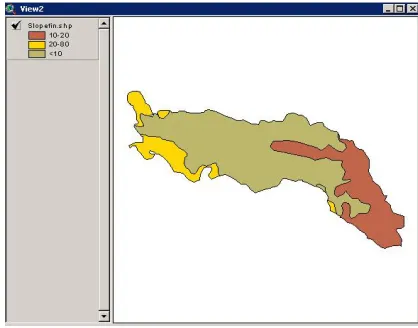
Slope map was collected and prepared from SOI maps. The various slope lengths in the catchment was calculated from the drainage network map of the catchment area.
RKLSCP
International Journal of Emerging Technology and Advanced Engineering
Website: www.ijetae.com (ISSN 2250-2459, Volume 2, Issue 7, July 2012)126 The LS factor was calculated from the following
formula,(Singh, 1994).
where is the slope length in feet
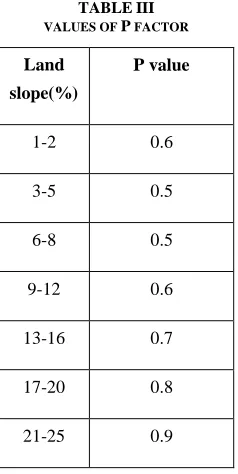
is the angle of slope and m depends on the slope. The P factor was estimated from Table III. (Singh, 1994)
TABLEIII VALUES OF P FACTOR
Land
slope(%)
P value
1-2 0.6
3-5 0.5
6-8 0.5
9-12 0.6
13-16 0.7
17-20 0.8
21-25 0.9
The R factor was determined using the formula,
R = 79+0.363Xa (Choudhury and Nayak, 2003) where Xa is the average annual rainfall in mm over the study area. The data was obtained from HYDROMET DIVISION, Indian Meteorological Department.
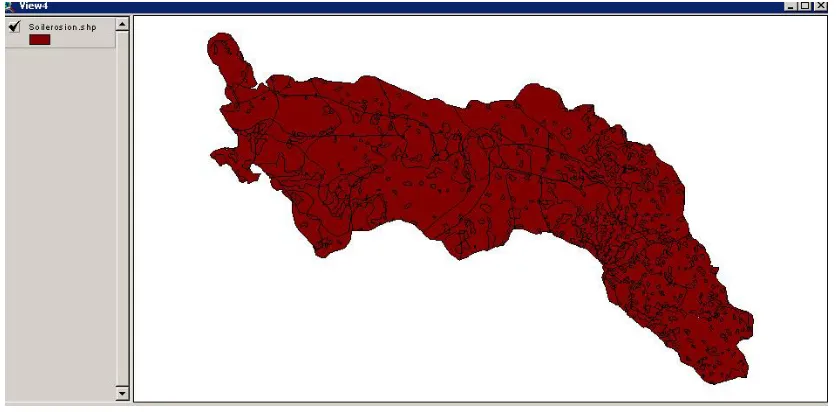
VI. PRIORITIZATION OF SUBCATCHMENTS BASED ON SOIL LOSS ESTIMATION
Soil, slope, landuse and subcatchment maps were integrated to compute the KLSCP factors and erosion for different subcatchments. Statistics were computed from GIS software to find the soil loss from each of the subcatchment. According to the computed value, the highest value indicates the subcatchment which is subjected to maximum erosion, next highest value is next higher erosion and so on.
VII. RESULTS AND DISCUSSIONS
The catchment with the drainage network is shown in Figure 1. The soil map is shown in figure 2.
Slope map is presented in figure 3.The landuse map with different types of landuse is shown in figure 4.
The value of Xa, i.e., average annual rainfall was calculated to be 115.8 mm and the value of rainfall factor R computed is 120.847 mm.
The integrated maps of soil, slope, landuse and subcatchment is shown in figure 5. The prioritization based on the estimated soil loss are shown in Table IV.
This study provided the category of soil loss in terms of risk areas as the result of the integration of the USLE factors. Subcatchment nos. 1 and 2 are subjected to moderate soil loss whereas the other subcatchments are subjected to mild soil loss from the catchments.
TABLEIV
PRIORITIZATION OF DIFFERENT CATCHMENTS
Subcatchment
No. SUM_AKLSCP Erosion(t/ha)
Priority No.
1 4317.4920 50.988 1
2 3450.4780 42.660 2
3 2967.8790 17.350 3
4 2815.9730 12.890 4
5 1826.9690 10.467 6
6 1714.1260 10.812 5
7 839.0910 7.603 8
8 2088.9050 10.423 7
REFERENCES
[1] Chandramohan, T. and Durbude, D.2002. Estimation of soil erosion potential using USLE, Journal of the Indian Society of Remote Sensing, 30(4), 181-190.
[2] Choudhury, M.K. and Nayak, T. (2003) Estimation of Soil Erosion in Sagar Lake Catchment of Central India, Proceedings of the International Conference on Water and Environment, December 15-18,2003, Bhopal, India, pp. 387-392.
[3] Das, B., Singal S.K. and Singh R. 2008. Estimation of soil erosion in a ungauged wetland catchment, Hydrology Journal, 31, 65-76.
)
065
.
0
sin
56
.
4
sin
41
.
65
(
)
6
.
72
/
(
2
m
[image:3.612.110.229.225.462.2] [image:3.612.324.560.292.649.2]International Journal of Emerging Technology and Advanced Engineering
Website: www.ijetae.com (ISSN 2250-2459, Volume 2, Issue 7, July 2012)127 1
3 4
2
5 6
7
8 2
[4] Hesadi, H., Jalili, Kh and Hadidi, M. 2003 Applying RS and GIS for Soil Erosion and Sediment Estimation by MPSIAC Model - A case
study of Kenesht watershed in Kermanshah, Iran,
http://www.gisdevelopment.net/application/natural_hazards/landslid es/ma06_175pf.htm.
[5] Martin, D. and Saha, S.K. 2007. Integrated approach of using remote sensing and GIS to study watershed prioritization and productivity, Journal of the Indian Society of Remote Sensing, 35(1), 21-30.
[6] Mongkolsawat, C.,Thirangoon, P. and Sriwongsa, S. 1994 Soil Erosion Mapping with Universal Soil Loss equation and GIS, http://www.aars.org/acrs/proceeding/ACRS1994/Papers/DIS94-1.htm.
[7] Singh, V.P. 1994 Elementary Hydrology, Prentice Hall.
[8] Wischmeier, W.H., Smith, D.D. (1978). Predicting rainfall erosion losses: a guide to conservation planning. U.S. Dep. Agric. Handbook
[image:4.612.164.486.248.430.2]No. 537.
Figure 1. Catchment with Drainage Network and Subcatchments
[image:4.612.339.548.484.648.2]Figure 2. Soil map of the catchment
[image:4.612.47.285.488.666.2]International Journal of Emerging Technology and Advanced Engineering
Website: www.ijetae.com (ISSN 2250-2459, Volume 2, Issue 7, July 2012) [image:5.612.75.561.130.372.2]128
[image:5.612.100.518.411.617.2]Figure 4. Landuse map of the catchment
Figure 5. Intersected map of soil, slope, landuse and subcatchments
Figure 5. Intersected map of soil, slope, landuse and subcatchments