BIROn - Birkbeck Institutional Research Online
von Hecker,
U. and Hahn,
Ulrike and Rollings,
J. (2016) Spatial
representation of coherence. Journal of Experimental Psychology: General
145 (7), pp. 853-871. ISSN 0096-3445.
Downloaded from:
Usage Guidelines:
Please refer to usage guidelines at or alternatively
Spatial representation of coherence
Ulrich von Hecker1, Ulrike Hahn2
and
Jasmine Rollings1
1School of Psychology, Cardiff University, UK.
2Birkbeck College, London, UK.
Word count: 8,262
Abstract
Four experiments examined spatial correlates of the experience of coherence, that is, the
extent to which propositions ‘fit together’. Experiment 1 demonstrates for Heiderian triads (i.e.,
sets of liking/disliking relations between three fictitious persons) that name pairs from balanced
triads, such as two friends commonly disliking a third person (high coherence) are seen as closer to
each other in physical space as compared to name pairs from unbalanced triads, such as two persons
disliking each other and having a common friend (low coherence). This pattern of results is
conceptually replicated in two further experiments for categorical syllogisms. Two terms in
conclusions from valid syllogisms (high coherence) were seen as spatially closer to each other than
when two terms came from invalid syllogisms (low coherence). In the final two experiments,
similar closeness effects are demonstrated for word pairs from scenarios that “made sense” in terms
of causal connectedness (latent causality) as opposed to word pairs from scenarios perceived as
causally unconnected. These findings are discussed in the context of spatial binding theories,
applied psychology, and embodied cognition in general, and their methodological implications are
highlighted.
1
In this research we seek to present evidence for spatial processing as a correlate, or mediating
mechanism, of the experience of coherence. ‘Coherence’, or the extent to which claims or pieces of
evidence ‘fit’ together, is a notion that is central to people’s evaluation of information. It has
consequently attracted interest from philosophers (e.g., Olsson, 2005; Bovens & Hartmann, 2003),
cognitive scientists interested in theory formation and explanation (e.g., Thagard, 2000), and
psychologists interested in the evaluation of evidence, testimony, and witness credibility (e.g.,
Berman & Cutler, 1996; Berman, Narby, & Cutler, 1995; Brewer, Potter, Fisher, Bond, & Luszcz ,
1999; Harris & Hahn, 2009). The concept has also been used to shape or reformulate theories on
action planning and goal-related reasoning (Thagard & Millgram, 1995), as well as impression
formation, where judgments about other people have to be generated based on piecemeal
information on traits and behaviours (Kunda & Thagard, 1996). Also, text and discourse
comprehension has been described as a coherence problem, involving the simultaneous assignment
of meanings to different words and expressions (Kintsch, 1988; MacDonald, Pearlmutter, &
Seidenberg, 1994).
At the most general level, coherence is seen as the degree to which a number of ideas make
sense as an entire set. This criterion can be applied to propositions within theoretical systems,
whereby coherence appears as a criterion for the truth of the whole system (e.g., Quine & Ullian,
1978). Closer to psychology, Thagard (2000) defined coherence in terms of parallel constraint
satisfaction problems, whereby in a process of “mental balancing” (p. 3) complementary and
conflicting pieces of information are integrated until they all fit together in a satisfying way. In this
view, positive constraints may arise from explanatory or causal relations between propositions,
from analogy, entailment, justification, or connectedness in a perceptual sense. Negative
constraints arise mostly from logical inconsistency or incompatibility, or from negative association
(Thagard, 2000). Philosophers, finally, have sought to define formal, probabilistic notions of
coherence (e.g., Shogenji, 1999; Olsson, 2002; Fitelson, 2003). These have then been used to
2
& Hartmann, 2003; Glass, 2007) and the extent to which more coherent testimony implies more
reliable witnesses (Olsson & Schubert, 2007). Without going into formal detail about these
definitions, what they have in common is that coherence derives from the degree of (probabilistic)
overlap between the individual propositions within a set of propositions, and positive relevance
between them. In other words, a set of propositions is more coherent if they are more likely to be
true (or false) together, and, if knowing one (or more) increases our belief in the truth of another.
Crucially, coherence is a feature of a set of propositions or perceptual elements, not of these
elements themselves.
Psychological research on coherence has tended to leave the notion unanalysed, and
concerned itself primarily with its consequences. Moreover, it has focussed on its impact on beliefs.
However, coherence may have other cognitive consequences. Specifically, the central idea
examined in this paper is the relationship between perceived coherence and perceptions of physical
space. If, as many researchers assume, people’s reasoning about abstract relationships maps these
on to physical relationships (e.g., Barsalou, 1999, 2008; Niedenthal, Barsalou, Winkielman,
Krauth-Gruber, & Ric, 2005) then the coherence of information sets may have other effects. Mental
representations of distinct concepts, ideas, or cognitive elements in general may be supported by
‘mental space’, as space may be used metaphorically to represent relations or processing steps
within reasoning (Kant, 1999; Holyoak & Patterson, 1981; Leth-Steensen & Marley, 2000). If so,
then elements that are coherent with each other within a context, a set of propositions, or a structure
in general, should be seen as ‘closer’ to one another in space, relative to elements that are less
coherent, as is manifest in the intuitive description of coherence in terms of the spatial metaphor of
‘fit’. Thus there may also be perceptual consequences of that ‘mental’ distance in terms of
observable patterns of responses in physical space.
Some support for this idea might be taken from recent findings concerning perceptual
correlates of causality, given that causal relations between propositions may engender coherence
3
Holcombe, 2002), spatial perception of two objects has been shown to be distorted such that two
objects are seen as closer together when they are causally linked to each other than when they were
not (Buehner & Humphreys, 2010). Previous research on causal binding had demonstrated that
binding effects resulted as a consequence of the perceiver performing a voluntary action which
eventually produced the causal effect (Haggard, Clark, & Kalogeras, 2002). Buehner & Humphreys
(2010) showed in addition that mere observation of visual event sequences is sufficient to produce
the spatial binding effects. Thus, the perception that two visually presented objects that are
perceived to be causally related are also perceived as closer in space than two objects that are not
causally related, can therefore be attributed more clearly to the level of mental representation, as
opposed to such spatial effects being epiphenomena of action intentions and motor planning
(Haggard et al., 2002).
Such effects may well be specific to causal relationships between concrete objects (arising for
example from the body’s need to coordinate information from multiple modalities, e.g., Stetson,
Cui, Montague, & Eagleman, 2006). It is nevertheless worth examining whether similar phenomena
might hold for other, more abstract entities and relationships. Coherence between propositions
provides an intriguing candidate for such an exploration. Sets of propositions may be coherent to
different degrees, so we sought to examine whether spatial proximity may represent such degrees of
coherence between elements within sets of propositions.
Below we report the results from five experiments designed to test this basic hypothesis. All
experiments examine the perception of physical distances as correlates, or concomitant phenomena,
of the experience of more or less coherent sets of propositions. Experiment 1 does so using
Heider’s (1958) concept of cognitive balance for the generation of coherent and incoherent sets,
Experiments 2a and 2b use categorical syllogisms for the same purpose, and Experiments 3a and 3b
investigate the spatial representation of coherence using small scenarios (as sets of propositions)
4
Experiment 1: Cognitive Balance
According to Heider (1958), ‘balance’ is a property of certain sets of propositions. These
propositions each represent a relation between two entities, and that relation can have a positive or a
negative valence. For example, two people may dislike (and be disliked by) a third person. In a
simple set of three such propositions, ‘balance’ can be read off from the number of positive (or
negative) relations. If the number of negative sentiment relations within the triad is uneven (that is,
e.g., one), for example, two friends holding opposing attitudes towards an issue, or two people
disliking each other, but each being friends with the same third person, then the triad is classified as
unbalanced. Otherwise, (i.e., zero or two negative relations) it is balanced. Balanced triads have
“Prägnanz”, and a “Good Gestalt”, which, as Heider (1958) claimed, also means they have a
quasi-perceptual quality. Using a variety of different paradigms, balanced patterns of social relations
such as triads have repeatedly been found to be learned more easily than unbalanced patterns
(Crockett, 1982; DeSoto, 1960; Picek, Sherman, & Shiffrin, 1975; Press, Crockett, & Rosenkrantz,
1969; Zajonc & Burnstein, 1965). Previous research has also repeatedly found that balanced social
triads are perceived as making more sense, and, conversely, unbalanced triads are seen as more in
need of additional explanations for them to make sense (Brown & van Kleeck, 1989; Crandall,
Silvia, N’Gbala, Tsang, & Dawson, 2007; Rudolph & von Hecker, 2006). In the present context,
we therefore assume that balanced triads would be seen as more coherent than unbalanced triads.
To test the specific spatial predictions following from the assumption that balanced triads are
more coherent than unbalanced triads, the present experiment uses pair-associate-learning (PAL) as
a paradigm that has been used repeatedly in the past to investigate the ease of learning balanced
versus unbalanced materials (e.g., Zajonc & Burnstein, 1965; Press et al., 1969; for an overview see
Crockett, 1982). Basically, name pairs referring to fictitious people are the stimuli, and binary
symbols denoting either mutual liking or disliking (e.g., “+” or “– “) are the responses. In a trial, a
participant is prompted with a name pair without a symbol, and then generates a response according
5
propositions (e.g., A and B like each other) occurs via multiple presentations of trials, where
feedback on correctness is given immediately after each PAL response. In terms of accuracy,
studies using this paradigm typically find balanced materials to be learnt more easily than
unbalanced materials, and, furthermore, consistently find positive relations to be learnt more easily
than negative relations (for an overview: Crockett, 1982; see also von Hecker, 1994). These two
effects are therefore predicted for the present Experiment as well, although they are not in the focus
of our inquiry.
As our main question, we examine the possibility that perceptions of coherence have physical
concomitants. Specifically, we sought to probe whether perceived distances in physical
representations of elements within triads were affected by whether or not the triad from which the
elements were drawn was balanced or not. We examined this idea by adding a spatial judgment
task to the basic PAL task just described. This task, described in detail below, required participants
to make a judgment concerning the physical distance between the names of two triad members as
they appeared on the screen. This perceptual task demands neither semantic processing of the
names nor the relationship between those named and avoided any direct or explicit metaphoric
mapping between the concepts of liking or disliking and space (like=close or dislike=distant, see
Baxter, 1984; Blum-Kulka & House, 1989; Spencer-Oatey, 1996). As explained in detail below,
the task merely required participants to make a judgment concerning the graphical layout on the
screen, without reference to the sentiment (‘like’/’dislike’) of the relation in question. The
perceptual task simply followed a learning trial concerning the sentiment value of the particular
relation. Thus knowledge of the sentiment could potentially infuse the spatial response being
generated, particularly because it was sufficiently difficult as to leave an amount of perceptual
uncertainty on each trial.
Method
6
Twenty-eight undergraduate students from Cardiff University (25 female, 3 male, mean age =
19.8 years) took part in the experiment. They received course credit for participation. Since a
novel effect was expected, optimal sample sizes could only be approximately planned. We relied
on previous research showing the targeted balance effect (15-20, see Crockett, 1982; von Hecker,
1994) and went slightly higher to accommodate what we expected to be a small spatial effect (as
one would expect severe limits on how much cognitive factors can bias perception).
Materials
12 names were selected from a thesaurus of English first names, six male and six female, of
approximately equal popularity. A stimulus would appear on the screen, e.g., “Trisha and Helen”,
and the response symbol would be either a “+” or a “–“. Participants were instructed that these two
symbols meant that the two people in the stimulus pair liked each other or disliked each other.
Stimuli and responses were prepared such that 12 stimulus-response pairs resulted, corresponding to
four triads. Two of these triads were balanced (one male, one female), and two were unbalanced
(one male, one female).
Procedure
Participants were seated at a distance of approximately 70 cm from a computer screen. For
one trial, one of the 12 stimuli was presented in the centre of the screen, in white ASCII typewritten
mode on a black background, with the plus or minus at the centre of the line (as feedback), and the
names to the left and right of the centre, at an overall lateral extension of approximately 30 mm on
each side. There were 12 such stimuli, meaning that a single block was comprised of 12 trials
presented in a random order.
There were 13 blocks overall, the first three without the spatial component. For a block
without spatial component, participants were presented the name pairs in a random sequence. They
were instructed to respond to each name pair accurately, without emphasis on a speeded response,
but within a response window of 5 seconds. Participants used the left and right arrow keys which
7
the screen, to assist response mapping. Upon presentation of each stimulus, participants indicated
which of the two signs was correct for the pair of persons on the screen. Participants were instructed
that, at the beginning, they would have to guess which sign would be correct, but that they would be
able to learn through repeated exposure to the same stimuli.
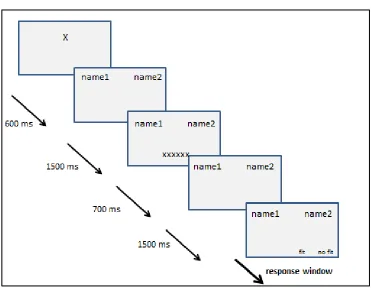
For a block including the spatial component, on each trial, a fixation cross was first presented,
mid-screen, for 600ms, upon which the two names were presented with a gap of 43mm width for
1500ms, with the centre of the gap replacing the fixation cross. Participants were instructed to keep
their gaze fixed at the midpoint of the gap between the names, where the cross had been.
After this time, a string of small x’s was presented for 700ms at a distance of 15cm below the
two names (see Figure 1). The number of x’s in the string was chosen such that in half of the trials,
the string would just fit into the gap between the two names, for the other half of trials it would
overshoot either at the left or right end by one character (with left or right randomly determined
each time). After this, the two names at a gap stayed on screen for another 1500ms, before a
prompt appeared, asking the participant to indicate fit (left arrow key) or no fit (right arrow key).
The available response window for this was five seconds. A fit response indicates that the perceiver
thinks the gap is wide enough for the x’s to go in, therefore the two names being sufficiently distant
from each other. A no fit response indicates that the gap is deemed too narrow, that is, the names
are too close together for the x’s to fit between them. Note that the nature of this spatial task has no
bearing on, or makes no reference to, the sentiment value of the relation between the two names, or
the configuration of the social triad where it was taken from. Test trials and post-experimental
interviews revealed that when a participant kept their gaze to the gap as instructed, it was indeed
fairly difficult at this stage of the task to exactly discern whether the string of x’s would fit into the
gap or not. Immediately after the response was made, the name pair was again presented at a
slightly lower position on the screen, without gap, and the participant was prompted to indicate
8
Instructions and procedure for the trial blocks with spatial component were designed such that
participants would anticipate themselves having to indicate the relation sign immediately after the
spatial task. We assumed that during the first three blocks, i.e., those without spatial component,
participants would have already encoded some knowledge about the associations between name
pairs and signs, such that the execution of the spatial task would proceed in the presence of such
knowledge.
Participants were informed about the differences in procedures between blocks of trials
excluding and including the spatial task by an additional set of on-screen instructions that was
presented to them after the third block was finished (i.e., after those blocks without the spatial task
had been completed). In all blocks, the interval between the participant’s final response to one
name pair and the appearance of the next pair was 2 seconds.
The experiment lasted about 25 minutes, including debriefing.
Results
One participant had to be excluded because of missing data due to not following instructions,
so the sample was reduced to N=27. As part of the post-experimental interviews, participants were
asked whether they perceived the triadic configurations amongst the pairwise relations they had to
learn and repeat in this experiment. None of the participants said they had noticed such
configurations.
Accuracy for like/dislike responses
Though not our main focus, we first present the basic results concerning participants’ learning
of the relevant relations. This simply allows us to set our study in the context of past research on
paired associate learning of Heiderian triads. In establishing that our PAL task replicates the main
findings of past studies, we show also that the addition of the spatial task does not alter or interfere
with participants’ acquisition of triad knowledge. For each participant, accuracy scores were
calculated as the proportions of correct responses out of the numbers of relations of a given
9
balanced/negative, 52 unbalanced/positive, and 26 unbalanced/negative. These scores were
subjected to a 2 (Type of triad: balanced vs. unbalanced) x 2 (Type of relation: positive vs.
negative) within-subjects ANOVA. Table 1 illustrates the means. Type of triad yielded a
significant effect, F (1,26) = 4.19, MSE =.01, p < .05, partial η2= .14, as did Type of relation, F
(1,26) = 7.08, MSE =.01, p < .01, partial η2= .21, as did the interaction, F (1,26) = 10.06, MSE
=.007, p = .004, partial η2= .28. Relations from balanced triads were learned better than those from
unbalanced triads, and positive relations were learned better than negative ones, thus replicating
past findings (Crockett, 1982; DeSoto, 1960; Picek, Sherman, & Shiffrin, 1975; Press, Crockett, &
Rosenkrantz, 1969; Zajonc & Burnstein, 1965).
Fit – no fit responses
The focus of our investigation, however, are participants’ fit/no fit responses. To interpret
these, we first analysed to what extent participants were accurate in saying that a given string of x’s
fit into the gap. That is, across all 10 blocks containing the spatial component, the proportion of
correct responses in terms of fit vs. no fit was calculated for each of the four categories of relations,
that is, balanced/positive, balanced/negative, unbalanced/positive, and unbalanced/negative (see
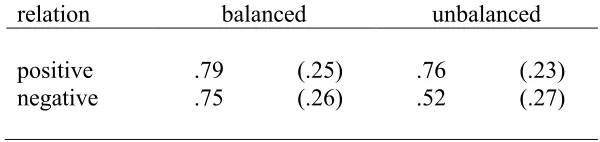
Table 2). Performance was more accurate than expected by chance in all four categories (all t’s
(26) > 3.88, p’s <.001, as tested against .50). We then evaluated these accuracy scores with a 2
(Type of Triad: balanced vs. unbalanced) x 2 (Type of relation: positive vs. negative)
within-subjects ANOVA. Type of Relation was significant as a main effect, F (1,26) = 8.12, MSE =.005, p
< .01, partial η2= .24, revealing that positive relations (M = .63) were given more correct spatial
responses than negative relations (M = .59). Neither Type of Triad nor the interaction were
significant. These analyses indicate that accuracy did not vary as a function of balance. Whatever
effects balance might have on perceived ‘fit’ is consequently not a result of purely perceptual
differences across trials.
Most crucially, to determine whether balance did have a biasing effect on fit/no fit responses
10
responses, irrespective of accuracy (see Table 3)1. In line with the main hypothesis, a main effect
of Type of Triad was observed, F (1,26) = 10.12, MSE =.004, p = .004, partial η2= .28, showing
that participants were more likely to say the string of x’s fitted into the gap when the name pair in
question came from a unbalanced triad (M = .45) than when it came from a balanced triad (M =
.41). There was also a tendency for Type of Relation to have an effect, F (1,26) = 4.02, MSE =.02,
p = .06, partial η2= .13, whereby positive relations (M = .46) were associated with more fit
responses than negative relations (M = .41). The interaction was not significant.
Additional SDT analyses
The results of these analyses are further confirmed by signal detection modelling (SDT, see
Macmillan & Creelman, 1991). Here, hit rates (the proportion amongst all trials in which the string
of x’s actually fitted in the gap, when the response was “fit”) and false alarm rates (the proportion
of trials in which the string of x’s did not fit in the gap, but the response was “fit”) were computed
for each participant for all four types of relations. Discrimination parameters d’ were estimated
from these proportions, with higher values corresponding to more accurate discrimination of
whether or not an objective fit was present. Response tendency parameters C were also estimated,
with higher values corresponding to greater tendencies to say “no fit” in general, that is,
independent of discriminative performance. Again, two analyses of variance, one for each type of
parameter, established that d’ values were higher for positive (M = .946) than for negative relations
(M = .601), F (1,26) = 10.44, MSE =.318, p = .003, partial η2= .28, with no other significant effects
on discrimination accuracy. C values were higher for relations that came from balanced (M = .429)
than unbalanced triads (M = .224), F (1,26) = 10.82, MSE =.108, p = .003, partial η2= .29, with no
other significant effects.
Re-analysis on the basis of subjectively perceived triads
The above analyses indicate both that participants generally learned the relations, and thus the
implied balance, as intended and that balance had the expected effect on judgments of fit. However,
11
‘coherence’, that matters, we also conducted a supplementary analysis that conditioned solely on
participants actual classifications. Such an analysis would lead to different results only if
participants had consistently discrepant beliefs about specific triads, which meant that these triads
were systematically assigned to a different experimental condition than assigned by design.
We re-analysed the proportions of fit responses with subjectively perceived balance as the
criterion. That is, in each trial block all triads were classified as balanced or unbalanced on the
basis of the participant’s responses, on that trial, as to whether the two persons liked or disliked
each other. For example, if the three relations from a given triad ABC, were presented in the
learning phase as balanced (“AB dislike, BC dislike, AC like”), but were remembered in that
particular block by the participant as “AB like, BC dislike, AC like” (thereby committing one error
at the first relation AB which changes the balance status of the triad), this triad was subjectively
classified as unbalanced in that block. In this way, each triad in each block was re-classified as
balanced or unbalanced, based on the subjective response pattern concerning the three likes or
dislikes that it had elicited from the participant in that block2. This led to a re-classification into a
different balance status for 23 percent of all triads presented in the experiment; that is, 256 triads
changed their designed balance status as the result of subjective analysis, as counted across 27
participants and 10 relevant trial blocks, each containing four triads (= 1080 presented triads in
total).
An ANOVA with the same design as above yielded a significant effect for Type of Relation,
F (1,26) = 7.54, MSE =.03, p = .01, partial η2= .22, whereby relations reported as positive (M =
.49) were associated with more fit responses than negative relations (M = .39). Supporting the main
hypothesis, a main effect of Subjective Type of Triad was observed, F (1,26) = 4.47, MSE =.009, p
= .04, partial η2= .14, showing that participants were less likely to say the string of x’s fitted into
the gap when the name pair in question came from a triad in which relations had been so reported,
irrespective of correctness, as to form a subjectively balanced triad (M = .42) than when it came
12
d’ values were only found different as a function of Type of Relation, F (1,26) = 4.19, MSE = 1.17,
p = .05, partial η2= .13, replicating the above finding that positive relations were better
discriminated (.89) than negative relations (.47), with no further effects. C values, however, only
differed as a function of balance, F (1,26) = 10.72, MSE =.148, p = .003, partial η2= .28, with no
other significant effects, showing as predicted that participants displayed a stronger tendency to say
“no fit” in the case of relations from balanced (M = .37) than unbalanced triads (M = .13). Thus
re-analysis on the basis of ‘subjective balance’ confirms the main results.
Discussion
Concerning basic accuracies for mutual like/dislike sentiments associated with the name pairs,
the observed positivity main effect is a classical finding and has been shown to occur regularly
when using the PAL, independently of balance effects (Crockett, 1982, von Hecker, 1994). Again
in line with these previous findings, accuracy levels for positive and negative relations were not
statistically different when part of a balanced triad. In terms of the binary response format of the
PAL, the positivity effect might reflect people’s mild tendency to assume mutual liking between
other people as a default (Nilsson & Ekehammar, 1987; Sears, 1983). The balance main effect, a
classical finding as well (see Crockett, 1982) appears to be, for a large part, carried by the simple
effect due to negative relations being especially well learned when part of a balanced triad (see the
significant interaction). Zajonc & Burnstein (1965, p. 161) already noticed the particularly high
error rates for negative relations from unbalanced triads.
The main interest, however, lies with the spatial judgment task. As the values in Table 2
show, the spatial task was quite difficult (which aligns with subjective, post-experimental reports),
although participants were able to perform better-than-chance. This state of affairs was intended as
part of our basic experimental setting. It seemed essential that the task should not leave participants
completely at random with respect to perceiving fit or no fit of the x’s into the gap, while at the
13
reasoned, would facilitate a process by which the spatial representation a participant might associate
with the particular name pair would have a chance to influence that response.
In line with this, the main result is that participants were more likely to say the string of x’s fit
into the gap when the name pair in question came from an unbalanced triad than when it came from
a balanced triad. We interpret this as the balanced triads “making sense” more than unbalanced
trials and therefore seeming more coherent than unbalanced triads (see Brown & van Kleeck, 1989;
Crandall, Silvia, N’Gbala, Tsang, & Dawson, 2007; Rudolph & von Hecker, 2006) which, in turn,
translated into greater ‘proximity’, that is, the constituent elements within balanced triads showed
shorter distances between each other than the constituent elements within unbalanced triads. In
terms of the SDT analysis, this main result corresponds to finding stronger response tendencies in
the no fit direction for balanced than unbalanced relations, independent of how well the objective fit
and no fit could be discriminated for balanced versus unbalanced materials. In sum, participants
clearly did not behave as if there was a mapping of (positive vs. negative) sentiment quality onto
distance, but rather as if the mapping was one of coherence onto distance. The same basic pattern
resulted when analyzing spatial responses as a function of subjectively perceived balance.
Of lesser interest, though nevertheless relevant, is that positive relations tended to be more
associated with fit responses than negative ones, which was not predicted. Metaphorical matching
(in this case, positive corresponding to close, and negative to distant) is unlikely to be responsible
for this, because the prediction from this would be the opposite pattern: If positive relations were
associated with shorter distances, and negatives with longer distances in a metaphoric way (Baxter,
1984; Blum-Kulka & House, 1989; Spencer-Oatey, 1996), one would expect more fit responses to
negative relations than positives, the opposite of what was observed. One possible explanation is
that the expressions fit and no fit, used as labels for the response options, were semantically
congruent with positivity versus negativity, which might have led participants to generate fit
14
as compared to when the name pair stood in a negative sentiment relation, all other things being
equal.
Finally, positive relations were associated with higher levels of fit-no-fit accuracy (as
corroborated by the d’ analysis), a finding which was also not expected and, again, is not central to
our argument here. A possible explanation lies in the general observation that negative information
attracts more attention than positive or neutral (for an overview see Rozin & Royzman, 2001),
making it possible that processing resources directed at the semantic content of the relation between
the two names were relatively more taxed in the negative than in the positive case. If so, resource
availability for the spatial task proper would suffer more in the negative than in the positive case.
Finally, the procedure used here proved unobtrusive in the sense that, as post-experimental
interviews showed, participants were not aware of the triadic configurations amongst the relations
they learn (see also von Hecker, 1994). Despite this, balance effects did emerge, not only in terms
of memory accuracy for the sentiment qualities of the relations, but also in terms of spatial effects
reported above. This may hint at the possibility that the cognitive processes in discerning higher
coherence in balanced than unbalanced triads do not necessarily operate at the conscious level.
Experiment 2a: Categorical syllogisms
The fact that the results of Experiment1 cannot be explained by a simple mapping of
‘positive’ to ‘close’ and ‘negative’ to ‘distant’, but rather rely on balance as a property of the entire
triad, suggests that the observed effect is based on a more abstract notion of coherence. One would
thus expect such effects of coherence in other tasks and domains. In particular, one would expect
effects of coherence even in domains that have no connection whatsoever with space. Arguably,
one of the most abstract domains possible is the evaluation of logical truth, given that logical truth
abstracts away from the specific semantic content of propositions and is determined only by logical
15
The present experiment therefore sought to test for effects of coherence on perceptions of
physical space in a second domain: categorical syllogisms. A categorical proposition is a
proposition that asserts or denies that all or some of the members of one category are included
within another category, for example: All birds are animals. A categorical syllogism (syllogism) is
a set of three categorical propositions, the first two of which are called premises, and the third
conclusion. Together, the whole set of three propositions forms an argument subject to logical
scrutiny, once premises and conclusion have been mentally represented (Johnson-Laird, 1983). In
particular, if the conclusion follows logically from the two premises, the syllogism as a whole is
called (logically) valid; if it does not follow, it is invalid. As a notion, logical validity involves
necessity: In a logically valid argument the conclusion must be true if the premises are true. This
necessity bestows coherence. For certain valid syllogisms such as “All A are B, all B are C,
therefore all A are C” coherence is, in fact, maximal in the formal sense described by Bovens and
Hartmann (2003). We assume here that valid syllogisms, once their logical validity is appreciated
by an individual, will be seen as more coherent (e.g., All A are B, all B are C, therefore all A are C),
than syllogisms which are invalid (e.g., All A are B, all B are C, therefore all C are A; see Appendix
B for valid and invalid syllogisms as used here). The present experiment tests the hypothesis that
the experience of coherence is reflected in spatial processes. More specifically, we test the
hypothesis that on-screen representations of the two concepts mentioned in the conclusion (A and
C, see above) should be perceived to be at a lesser distance to one another in the case that this
conclusion follows logically from the two premises (valid syllogism) as compared to a case when it
does not follow (invalid syllogism).
Recent research has shown that the content in syllogisms, particularly in the conclusions, can
have effects in terms of participants’ logical reasoning being triggered by their affective response
towards the content (Klauer and Singmann, 2013). Therefore in this experiment, materials were
generated from highly artificial contexts, such that strong affective responses towards them were
16 Method
Participants
Following a power analysis (Faul, Erdfelder, Lang, & Buchner, 2007) based on the proportion
of noovershoot responses, and on a required power of .70, sixty-two undergraduate students from
Cardiff University (49 female, 13 male, mean age = 22.2 years) took part in the experiment3.
Participants received course credit for their participation.
Materials
In order to minimize content effects, artificial contexts were created that would render
existing world knowledge irrelevant, as explained to participants in a general instruction
beforehand, as follows: “For all these syllogisms, please imagine you are in a garden where genetic
manipulation took place such that normal biological rules are not pertaining. There might be
unusual combinations of things and features, but just take it as science fiction. Instead, please focus
entirely on the logical structure in making your decision.” 12 syllogisms were constructed, six in
each of the categories valid (e.g., All apple-trees have a red mark; All trees with a red mark are
conifers; therefore: All apple-trees are conifers) and invalid (e.g., All fruits are ripe; All ripe fruits
are cubic eggs; therefore: All cubic eggs are fruits). The sets of valid and invalid syllogisms had the
same number of All- and Some- quantifiers and were made as equal with respect to their logical
form. That is, three of the valid syllogisms were of the form [All A are B, All B are C, therefore:
All A are C], and three were of the form [Some A are B, All B are C, therefore: Some A are C];
whereas amongst invalid syllogisms, three were of the form [All A are B, All B are C, therefore: All
C are A], and three were of the form [All A are B, Some B are C, therefore: Some A are C]. For a
complete list of materials in this experiment see Appendix B.
Procedure
Participants were seated in front of the computer. After reading instructions, they were
17
evaluations (valid vs. invalid), for the participant to clearly understand the concept of a categorical
syllogism, and to receive some clarification and training with respect to evaluating syllogisms.
Participants then received further training sheets without solutions for their individual practice,
containing syllogisms of the type to be tested upon in the main experiment, whereby explanations
were still available from the experimenter, until a criterion of one flawless sheet of evaluations was
reached.
After this preparatory stage, the remainder of the experiment was carried out at the computer,
and comprised four blocks. In each block, the 12 syllogisms were presented one by one, in a
random order. Syllogisms appeared on the screen one at a time and the participants were allowed to
consider them for as long as they wished. Participants were asked to evaluate each syllogism as
valid or invalid, without responding immediately, instead keeping their evaluation in mind for a
later response. This was done to ensure that the representation of the syllogism as valid (coherent)
or invalid (incoherent) remained active during the ensuing spatial task. The spatial task was then
administered in the same way as described in Experiment 1, now using the two concepts from the
conclusion of the syllogism at hand to create the gap on the screen. Different from Experiment 1,
the two response keys for the spatial task were now labelled ‘overshoot’ (left arrow key) and ‘no
overshoot’ (right arrow key). Note that whilst in Experiment 1 the case of the width of the x’s
being accommodated by the width of the gap was associated, on the response side, with a positive
expression (fit), it was now associated with a negative expression (no overshoot). These changes
were made in order to be able to generalise across different response formats, and to address
possible concerns about specific effects originating in the particular fit vs. no fit labelling (see
above)5.
Directly after responding to the spatial task, a five-second response window opened up for the
participant to press one of the arrow keys as indicated on the screen, to say whether the syllogism at
hand was valid or invalid. Feedback was given for this decision. The experiment lasted about 25
18 Results
Two participants were excluded for low accuracies (.50-.60 proportions correct) in solving the
syllogisms, so the sample was reduced to N=60.
Accuracy for valid/invalid responses
For each participant, accuracy scores were calculated as the proportions of correct responses
for valid and invalid syllogisms across all 4 blocks. Valid syllogisms were found to be judged as
valid more correctly (M = .87, SD = .12) than invalid syllogisms were as invalid (M = .74, SD =
.20), t(59) = 6.42, p<.001.
Overshoot – no overshoot responses
As to the perceptual task, it was first examined to what extent participants judged correctly
whether or not a given string of X’s would overshoot. Across all 4 blocks, the proportion of correct
responses in terms of overshoot vs. no overshoot was calculated for valid and invalid syllogisms
from which the elements for the perceptual task were taken. Performance was in the same range as
previously observed in Experiment 1, significantly better than chance (both t’s (30) > 5.00, p <
.001), and not significantly different (t < 1) between valid syllogisms (M = .59, SD = .14) and
invalid syllogisms (M = .61, SD = .13).
Central to the present hypothesis, we looked at the proportion of noovershoot responses
across all 4 blocks, irrespective of accuracy, as a function of validity. In line with the main
hypothesis, participants were more likely to say the string of x’s did not overshoot the gap when the
pair of concepts in question came from an invalid syllogism (M = .46, SD = .17) than when it came
from a valid syllogism (M = .41, SD = .16), t(59) = -2.17, p < .03, meaning that in the case of
invalid syllogisms, the gap between the two concepts were thought to be wider.
Additional SDT analyses
These data were analysed in terms of SDT. Hit rates (proportion amongst all trials in which
the string of x’s actually fitted in the gap, when the response was “no overshoot”) and false alarm
19
overshoot”) were computed for each participant for all four types of syllogisms. Higher
(conservative) values of response tendency parameters C meant greater tendencies to say
“overshoot” in general, that is, independent of discriminative performance. Discrimination
parameters did not differ between valid (d’ = .80, SD = 1.39) and invalid syllogisms (d’ = .81, SD =
1.05), t(59) = -.05, ns, but response tendencies were more conservative for valid (C = .38, SD = .84)
than for invalid syllogisms (C = .12, SD = .78), t(59) = 2.71, p < .01. This directly replicates the
findings with balanced and unbalanced triads of Experiment 1 above.
Re-analysis on the basis of subjective validity
Again, we conducted a supplementary analysis based on participants' subjective perceptions
of each syllogisms' validity as an alternative criterion. Across all four experimental blocks, a
spatial response to a trial was counted for the validity category that corresponded to the
participant’s own judgment (valid vs. invalid), rather than to factual validity. Proportions of no
overshoot responses were higher when the pair of concepts came from a syllogism that participants
found invalid (M = .47) than when it came from one they found valid (M = .44), although
statistically this was only a tendency, t(59) = -1.67, p < .05, one-tailed. Whilst average d’
parameters were not different between conditions, t(59) = -1.06, ns, response tendency parameters
C were significantly higher for valid (M = .32) than invalid syllogisms (M = .11), t(59) = 1.75, p <
.04, one-tailed.
Discussion
As in Experiment 1, participants performed significantly above chance at the spatial task, but
found this task quite difficult which presumably left some ambiguity in generating a response to
each spatial trial. Using materials and a response mapping (i.e., left arrow key: overshoot vs. right
arrow key: no overshoot) that were different from Experiment 1 this experiment conceptually
replicated the main finding from Experiment 1 which is that participants were less likely to say the
string of x’s fitted into the gap when the pair of words in question came from a coherent cognitive
20
demonstrated, logical validity did not have an influence on spatial discrimination performance per
se (d’), but did have an influence on the general tendency to say “overshoot”, irrespective of spatial
discrimination. In the present experiment we assumed that logically valid categorical syllogisms
would be experienced as more coherent than logically invalid ones, once their logical validity had
been appreciated. Thus, higher coherence of valid syllogisms would be represented by a tighter
(spatially closer) representation of the constituent terms in mental space. Importantly, all results
were paralleled by a re-analysis using the participants’ own classification of the syllogisms as valid
or invalid. As the logical evaluation of syllogisms is not a very common cognitive routine, we
made sure at the outset of the procedures that participants were familiar with the concepts of formal
logical validity, and, if necessary, were trained up to a criterion in performing the evaluation of
syllogisms. The present experiment extends our argument beyond Experiment 1 in that for the
syllogistic materials, it is possible to associate the observed spatial effect more precisely with a
concept of coherence that emphasizes the logical connection between elements of a cognitive
structure. The spatial effect of representing coherent cognitions as closer together than
non-coherent cognitions was again replicated, and was reflected in a more conservative response
tendency, independent of the discriminative performance at the spatial task, for valid versus invalid
syllogisms.
Experiment 2b: Replication and the role of conclusion believability
Given the novelty of the result, and given also that people’s logical reasoning abilities have
often been challenged (Stanovich, 1999) we sought to replicate the result in a further experiment. In
particular, it is an often reported finding in the logical reasoning literature that people’s judgments
of the validity of an argument –which pertains to a relationship between the premises and the
conclusions- is influenced by the intrinsic believability of the conclusion itself (e.g., Evans,
Narston, & Pollard, 1983; Oakhill, Johnson-Laird & Garnham, 1989; Newstead, Pollard, Evans, &
21
fallacious arguments (Evans, 2005). Adding in a manipulation of conclusion believability thus
provides an interesting further test of the extent to which the coherence based spatial bias effect is
based solely on coherence as opposed to intrinsic properties of individual propositions.
Method
Participants
Twenty-four undergraduate and post-graduate students, as well as university administrative
staff from Cardiff University (15 female, 9 male, mean age = 26.3 years) took part in the
experiment. The sample size was aimed at the same magnitude as in Experiment 1, in order to
detect an effect of a comparable size as found there3. The participants were recruited through the
University notice board and received £4.00 for their participation.
Materials
20 syllogisms were constructed, five in each of the categories valid/believable (e.g., All fruits
in the crate are sour fruits; All lemons are in the crate; therefore: All lemons are sour fruits),
valid/unbelievable (e.g., Some magicians can conjure; No human can conjure; therefore: Some
magicians are not humans), invalid/believable (e.g., All children like chocolates; Some dogs like
chocolates; therefore: Some children like dogs), and invalid/unbelievable (e.g., All glasses are in
the cupboard; Some things in the cupboard are plates; therefore: Some glasses are plates)4. Care
was taken to include only syllogisms with a maximum of two mental models (Johnson-Laird, 1983,
see Appendix B). This was done to ensure that the materials would not tap too much into logical
abilities, but would instead afford a clear and swift appreciation of the presence, or lack, of
coherence.
Procedure
All procedures were identical to those in Experiment 2a. Again we used ‘overshoot’ (left
arrow key) and ‘noovershoot’ (right arrow key) as response options. The experiment lasted about
22 Results
Accuracy for valid/invalid responses
As previously, we first analysed accuracy scores to check that we replicated standard effects
within the domain. In light of past research, participants’ accuracy data should show effects of
validity, believability and a validity x believability interaction. For each participant, accuracy
scores were calculated as the proportions of correct responses in each category of syllogisms across
all 4 blocks, that is, valid/believable, valid/unbelievable, invalid/believable, and
invalid/unbelievable. These scores were subjected to an ANOVA (see Table 4 for the means).
Validity yielded a significant effect, F (1,23) = 10.18, MSE =.02, p < .001, partial η2= .36, as did
Believability, F (1,23) = 12.05, MSE =.009, p = .002, partial η2= .34, as did the interaction, F
(1,23) = 16.75, MSE =.01, p < .001, partial η2= .42. Valid syllogisms (M = .87) were judged more
correctly than invalid syllogisms (M = .77), and unbelievable syllogisms (M = .85) were judged
correctly more often than believable syllogisms (M = .79). The difference in proportions correct
between believable and unbelievable conditions was not significant for valid syllogisms (p = .35),
the same difference was, however, significant for invalid ones, t(23) = -4.51, p<.001. An invalid
syllogism was significantly more often (falsely) judged as valid when its conclusion was believable
than when it was unbelievable, thus replicating the classical belief bias effect.
Overshoot – no overshoot responses
Our main interest, as in Experiment 1, lay in participants’ performance on the perceptual task.
We first examined the extent to which they judged correctly whether or not a given string of x’s
would overshoot. Across all 4 blocks, the proportion of correct responses in terms of overshoot vs.
no overshoot was calculated for each of the four categories of syllogisms from which the elements
for the perceptual task were taken, that is, valid/believable, valid/unbelievable, invalid/believable,
and invalid/unbelievable (see Table 5). Performance was more accurate than expected by chance in
23
(Validity: vaild vs. invalid) x 2 (Believability: believable vs. unbelievable) within-subjects ANOVA
these data showed no significant accuracy differences.
Central to the present hypothesis, we then looked at the proportion of noovershoot responses
(as comparable to the fit responses in Experiment 1) across all 4 blocks, irrespective of accuracy, as
a function of Validity and Believability (see Table 6). In line with the main hypothesis, a main
effect of Validity was observed, F (1,23) = 7.54, MSE =.009, p < .01, partial η2= .25, showing that
participants were more likely to say the string of x’s did not overshoot the gap when the pair of
concepts in question came from an invalid syllogism (M = .48) than when it came from a valid
syllogism (M = .43). No other effect was significant.
Additional SDT analyses
Again, the data were analysed in terms of SDT. Hit rates (proportion amongst all trials in
which the string of x’s actually fitted in the gap, when the response was “no overshoot”) and false
alarm rates (proportion of trials in which the string of x’s did not fit in the gap, but the response was
“no overshoot”) were computed for each participant for all four types of syllogisms. In two analyses
of variance no significant effects at all were found for d’ values, but response tendency parameters
C were found higher for valid (M = .435) than invalid syllogisms (M = .129), F (1,23) = 6.37, MSE
=.366, p = .019, partial η2= .21, with no other significant effects. This again replicates the findings
from the previous experiments.
Re-analysis on the basis of subjective validity
Once again, a supplementary analysis examined participants’ spatial judgments contingent on
participants' judgments of validity rather than actual validity. Across all four experimental blocks, a
spatial response to a trial was counted for the respective validity category (valid vs. invalid) that
corresponded to the participant’s own judgment about the particular syllogism as valid or invalid,
rather than its factual validity. Proportions of noovershoot responses were then analyzed as a
function of subjective validity and believability. Paralleling the previous results, a main effect of
24
participants were more likely to say the string of x’s did not overshoot the gap when the pair of
concepts came from a syllogism they found invalid (M = .475) than when it came from a syllogism
they found valid (M = .420). No other effect was significant. Average d’ parameters were not
found to be different between conditions at all, whereas response tendency parameters C were
found higher for valid (M = .489) than invalid syllogisms (M = .021), F (1,23) = 6.26, MSE =.840, p
= .02, partial η2= .21, with no other effects.
Discussion
Experiment 2b replicates the findings of Experiment 2a that logical validity as a relation
between a set of premises and a conclusion gives rise to the spatial judgment effect of coherence.
Furthermore, the believability manipulation indicates that the observed effect is based on coherence
between propositions and that intrinsic properties of the conclusion are insufficient to generate
biased spatial judgment. Whilst we replicated the standard belief bias in the validity evaluation data
(see Table 4) reflecting the classical pattern (see Klauer, Musch, & Naumer, 2000), conclusion
believability had no effect on spatial judgment.
It is worth noting that in the belief bias literature, it has been recently emphasized that SDT
methodologies as opposed to using ANOVA-based analyses of accuracy difference scores can
prevent misleading interpretations (e.g., Heit & Rotello, 2014). In particular, response bias
parameters C were used to account for belief bias effects in past experimental studies of logical
reasoning. In a similar vein we use SDT parameters here to analyse the spatial effect, relying
mainly on the interpretation of C parameters for which our approach makes predictions.
Participants’ tendency to say ‘overshoot’ was shifted in the conservative direction (i.e., a greater
proneness to say “overshoot”) in cases where a conclusion “makes sense” to the participant,
because the syllogism is logically valid.
25
This experiment was inspired by Bartlett’s (1932) early study “The War of the Ghosts” in
which he illustrated his concept of constructive memory. Presenting Western participants with a
text taken from a foreign culture, which did not make immediate sense to them, Bartlett (1932)
asked them to re-tell the content of this text to one another in a chain fashion, with a first participant
being read out the original text, and each participant afterwards listening to a rendition by an earlier
participant in the chain. With the chain length of six, the renditions of the text had become shorter
than the original, and more coherent from the perspective of typical Western concepts and story
lines. Bartlett’s (1932) point was to argue that the main functional quality of memory consisted in
the active reconstruction of materials at any point in time, using available schemata. In the present
paper so far, we have argued that coherence is the degree to which a set of propositions makes sense
as a whole, considered together. In the present experiment, we extend this idea to causality. But
unlike Buehner & Humphreys (2010) or Haggard et al. (2002), we did not present participants with
discrete events which could be constructed as cause and effect. Rather, we used small scenarios
consisting of three propositions. These propositions were not explicitly linked in a cause-effect sort
of way. However, when referring to applicable causal schemata, similar to Bartlett’s (1932)
approach, it was possible to indirectly link them. One is likely to create a mental representation that
“makes sense”, constructing the scenario in a more coherent way, assuming an “unseen”, or latent,
causality as derived from the schema. As an example, consider the two words “knife” and
“hospital”, and note how the two propositions in which they are mentioned (the first and the third)
can be linked by latent causality in the first, but not in the second scenario.
Scenario (1). 1. Johnny brought a knife to his workplace on a Wednesday. 2. He had always
quarrelled with another man at work, Bill. 3. Bill had to be admitted to the hospital on the same
day.
Scenario (2). 1. Johnny brought a knife to his workplace on a Wednesday. 2. His friend Bill’s
26
Note that the two words can only be linked by latent causality when constructing a whole,
coherent representation of all three propositions; just propositions 1 and 3 alone are not sufficient.
If such constructive mental activity takes place, we argue, then the resulting “latent causality” in the
scenario, which makes it coherent, should translate into spatial effects, such that target words from
different propositions within the scenario (such as the word pair knife and hospital) may be seen as
closer together than analog target words from a scenario for which no such reconstruction was
applicable.
Method
Participants.
Thirty-three participants from a residential area in Cornwall, UK (16 female, 17 male, mean
age 31.2 years), all of them young or middle-aged adults of varied employment, took part in this
study. Participants were volunteers from the public, and, volunteering, did not receive
remuneration.
Materials
Ten scenarios were written, each in two versions, allowing construction of latent causality, or
not. See Appendix D for a complete list of the scenarios. For each participant, a list of scenarios
was assembled by randomly choosing a set of five scenarios to be presented in their coherent
version, with the rest presented in their incoherent version. This way, all participants worked on the
same content scenarios, only in different compositions as to which of them were causal or
non-causal.
Procedure
Participants were seated in front of a laptop. An instruction and training sheet was presented
on paper, explaining the concepts involved in this experiment and giving two example scenarios.
Participants were asked to mark on the training sheet which scenario could be seen as containing
latent causality. They were given feedback to ensure everybody had a good level of understanding.
27
blocks of main trials, each block presenting all 10 scenarios. For each scenario, participants were
given as much time as required to study it and decide whether they thought the scenario was
“causal” or “non-causal”. Once a participant terminated this stage by pressing the space bar, the
two target words from the just-seen scenario were presented in the same way as the spatial task was
delivered in all experiments so far. Participants made a ‘fit’ and ‘no fit’ response using the left and
right arrow keys on the keyboard. On the following screen the scenario was shown once more, for
the participant to provide a judgement of “causal” (using the left arrow key) or “non-casual” (right
arrow key). Feedback was given on whether this decision was correct. The experiment lasted about
25 minutes, including debriefing.
Results
Accuracy for causal/non-causal responses
For each participant, accuracy scores were calculated as the proportions of correct responses
in identifying scenarios with and without latent causality across all 4 trials. Causal scenarios were
judged as “causal” in line with the experimenter intended classification more often than the
(intended) non-causal scenarios were judged as “non-causal” (causal: M = .89, SD = .11;
non-causal: M = .82, SD = .19), t(32) = 2.76, p = .009.
Fit – no fit responses
As to the perceptual task, it was first examined to what extent participants judged correctly
whether or not a given string of x’s would fit into the gap. Across all 4 blocks, the proportion of
correct responses in terms of fit vs. no fit was calculated for causal and non-causal scenarios which
the target words were taken from. Performance was again in the previous range for causal (M = .64,
SD = .12) and non-causal scenarios (M = .62, SD = .11). They were, for both types of scenario,
significantly better than chance (both t’s (32) > 6.40, p < .001), but not different from each other,
t(32) = .89, p = .38.
Crucially, we again looked at the proportion of fit responses across all 4 blocks, irrespective
28
participants were more likely to say the string of x’s would fit into the gap when the target word
pair came from an non-causal scenario (M = .33, SD = .20) than when it came from a causal
scenario (M = .24, SD = .19), t(32) = -2.23, p = .03.
Additional SDT analyses
Once again, these data were also submitted to a signal detection analysis. Hit rates (the
proportion amongst all trials in which the string of x’s actually fitted in the gap, when the response
was “fit”) and false alarm rates (the proportion of trials in which the string of x’s did not fit in the
gap, but the response was “fit”) were computed for each participant for causal and non-causal
scenarios. Higher (conservative) values of response tendency parameters C meant greater
tendencies to say “no fit” in general, that is, independent of discriminative performance.
Discrimination parameters did not differ between causal (d’ = 1.79, SD = 1.82) and non-causal
scenarios (d’ = 1.23, SD = 1.50), t(32) = 1.57, p = .13, but response tendencies were more
conservative for causal (C = 1.57, SD = 1.54) than for non-causal scenarios (C = .95, SD = 1.23),
t(32) = 2.67, p < .01. This replicates the findings of the previous experiments.
Re-analysis on the basis of subjective validity
Once again, we also conducted a supplementary analysis using participants' perceptions of
each scenario’s latent causality as an alternative criterion for analysis. Across all four experimental
blocks, a spatial response to a pair of target words was counted for the respective causality category
(causal vs. non-causal) that corresponded to the participant’s own judgment, irrespective of their
designed latent causality. Proportions of fit responses were higher when the targets came from a
scenario that participants had found to be non-causal (M = .33) than when they came from one they
had found to be causal (M = .25), p = .03. Whilst average d’ parameters were not different between
conditions, t(32) = 1.06, p = .29, response tendency parameters C were significantly higher for
causal (M = 1.53) than non-causal scenarios (M = 1.02), t(32) = 1.88, p = .03, one-tailed.
29
Although in the great majority of cases, participants saw latent causality in the presented
scenarios as intended, correspondence with the experimenter-intended classification was slightly
lower for non-causal than for causal scenarios. Possibly participants wondered whether they might
have missed a hidden causal link because the three propositions together did not readily make sense
(a possibility supported by post-experimental interviews) or they created some elaborate,
underlying story.
Overall, for those scenarios that lent themselves readily to a causal schema linking the three
propositions and thus rendering make them coherent, participants showed a tendency to be more
conservative; that is, they were more likely to see the gap as too narrow for the X’s to fit in, in
keeping with the findings of the previous experiments. The present experiment thus replicates the
basic spatial effect of coherence, and demonstrates it in a third domain.
Experiment 3b: Latent causality, replication
The manipulation of latent causality in the previous experiment differs from our other two
domains (Balance and logical validity) in that there is no objective ‘right’ or ‘wrong’. As just
discussed, participants may posit a (non-obvious) causal link even in the designated ‘non-causal’
scenarios, or simply assume that such a link exists even if they cannot think of one. At the same
time, causal links may be perceived to be more or less strong and more or less direct. Coherence in
this case is thus clearly scalable. We thus sought to replicate Experiment 3a with a response scale
that moved from a binary response of causal/causal to a graded scale from 1 (“definitely
non-causal”) to 9 (“definitely non-causal”). We also removed feedback on causality judgments, that is, there
was no attempt to bring participants’ judgments of the scenarios in line with experimenter-intended
classifications.
If there is a spatial correlate of the mental activity that constructs latent causality from the
three sentences in the scenario, then the observable spatial effect should be more pronounced in
30
spatial effect should appear more pronounced for scenarios receiving more extreme ratings on the
scale as either non-causal or causal, as compared to scenarios that would receive more intermediate
judgments on that scale.
Method
Participants.
Following a power analysis (Faul, Erdfelder, Lang, & Buchner, 2007) based on the proportion
of fit responses in the previous experiment (3a), and on a required power of .70, thirty
undergraduate students from Cardiff University (25 female, 5 male, mean age = 19.1 years) took
part in the experiment. Participants received course credit for their participation.
Materials and Procedure
All methods used here were the same as in Experiment 3a, except for the screen display
immediately after participants had made their ‘fit’ and ‘no fit’ response. On that screen,
participants were now asked to provide a judgement of perceived causality in the scenario by
indicating a number on a scale from 1 (“definitely non-causal”) to 9 (“definitely causal”), using the
numerical keys above the letters on the keypad. In contrast to Experiment 3a, they received no
feedback on causality judgments. The experiment lasted about 25 minutes, including debriefing
Results
Two participants were excluded because in post-experimental interviews they revealed a
strongly biased understanding of the spatial task, assuming that more than 80% of all spatial trials
were a no fit. So the actual sample was reduced to N=28.
Range of causal/non-causal responses
For each participant, the two mean ratings for all trials on designed non-causal scenarios and
designed causal scenarios were calculated. On average, causal ratings on the 9-point scale for
designed non-causal trials (M = 3.54, SD = .90) were significantly lower than for designed causal
trials (M = 7.16, SD = .92), t(27) = 15.85, p = .001, indicating greater perceived causality in those