BIROn - Birkbeck Institutional Research Online
Eimer, Martin and Grubert, A. (2014) Spatial attention can be allocated
rapidly and in parallel to new visual objects. Current Biology 24 (2), pp.
193-198. ISSN 0960-9822.
Downloaded from:
Usage Guidelines:
Please refer to usage guidelines at
or alternatively
Spatial Attention Can Be Allocated
Rapidly and in Parallel
to New Visual Objects
Martin Eimer1,*and Anna Grubert1
1Department of Psychological Sciences, Birkbeck College, University of London, Male Street, London WC1E 7HX, UK
Summary
In real-life visual environments, where multiple objects compete for processing, new objects that require immediate attention often appear when attention is already focused elsewhere. The question of whether spatial attention can be directed independently to different locations in the visual field remains controversial [1]. Serial models assume a uni-tary attentional focus that is directed to one object at a time [2, 3] and moves rapidly between objects [4, 5]. Accord-ing to parallel models, attention can be simultaneously allocated to several visual objects, but the distribution of attention cannot change rapidly when new objects arrive [6]. Here we demonstrate the existence of a fast and flexible mechanism of attentional object selection, where focal attention is allocated in parallel and independently to different target objects. Using event-related brain potential (ERP) markers of visual attention, we show that when two targets appear in rapid succession at different locations, two separate foci of attention are established, each with its own independent time course. Attention can be maintained at its previous location while it is simultaneously allocated to a new target object. Our results challenge the view that the attentional focus is always unitary and that the spatial selection of multiple visual objects operates in a strictly serial fashion.
Results and Discussion
We employed a task that required participants to direct their attention to two target objects that appeared sequentially at different locations. On each trial, two stimulus displays were presented in rapid succession (Figure 1A). Each display con-tained one color-defined target that appeared together with a distractor in a different equiluminant color. Participants’ task was to identify both target objects (e.g., the two red items in Figure 1A) and to indicate with a left or right response whether they belonged to the same category (two digits, two letters) or not (one letter, one digit). To assess the time course of attentional allocation to the first and second target object, we varied the stimulus onset asynchrony (SOA) between the two displays, which was 100, 50, 20, or 10 ms in different blocks. We recorded event-related potentials (ERPs) during task performance and measured posterior contralateral N2 (N2pc) components to both successively presented targets. The N2pc provides a temporally precise index of the covert
deployment of spatial attention to target objects among dis-tractors in multistimulus visual displays [5, 7–9]. When such targets are presented in the left or right visual field, they trigger an enhanced negativity at contralateral posterior electrodes that typically starts around 200 ms after stimulus onset and is generated in extrastriate areas of the ventral visual process-ing stream [10].
In experiment 1, all target/distractor pairs were presented to the left and right of fixation. They appeared at different vertical positions (above or below fixation) in the first and second display (Figure 1A). The two target objects in the two displays were presented with equal probability on the same side or on opposite sides. The onset of the N2pc to the target in the first display marks the point in time when spatial atten-tion is allocated to this object. The critical quesatten-tion was when the subsequent arrival of the second target would start to affect the distribution of attention in the visual field. To answer this question, we compared ERPs on trials where both targets were presented on the same side and on trials where they appeared in opposite visual hemifields. When the first target and the second target are located on opposite sides, their successive attentional selection should trigger N2pc components of opposite polarity, and this should be reflected in a polarity reversal of N2pc waveforms at a partic-ular moment during these trials [5]. No such N2pc polarity reversal will be elicited on trials where both targets appear on the same side. The critical moment when the second target begins to have an impact on the distribution of attention is marked by the point in time when N2pc waveforms on trials with same-side and opposite-side targets begin to diverge.
Figure 1B shows ERPs measured for 12 participants at lateral posterior electrodes (PO7/PO8) contralateral and ipsi-lateral to the side where the first target was presented. ERPs are shown separately for trials where the two targets appeared on the same side and trials where they appeared on opposite sides, for all four SOA conditions. Time is plotted relative to the onset of the first display. The N2pc component first emerged contralateral to the first target (T1), with a mean latency of 194 ms after stimulus onset (averaged across all task condi-tions). As predicted, the N2pc reversed polarity (arrows in Fig-ure 1B) when the second target (T2) was presented on the opposite side. This N2pc polarity reversal was closely linked to the arrival time of the second target: it was triggered earlier when the SOA between the two displays was short and emerged later for longer SOAs. This can be seen in N2pc differ-ence waveforms obtained by subtracting ipsilateral from contralateral ERPs on trials with same-side and opposite-side targets (Figure 1C). Arrows inFigure 1C mark the point in time when these N2pc waveforms started to differ in each SOA condition. This critical moment when the arrival of the second target began to affect the allocation of attention in the visual field is shown most clearly inFigure 1D, which plots the difference between the same-side and opposite-side N2pc waveforms inFigure 1C for all four SOA conditions. To deter-mine the onset of the N2pc differences shown inFigure 1D, we used a jackknife-based procedure with a 50% maximum amplitude criterion [11, 12]. The filled circles in Figure 1D mark the onset latency estimates for each SOA condition.
*Correspondence:[email protected]
Figure 1. Stimulus Setup and N2pc Results of Experiment 1
(A) Time course of stimulus events in experiment 1. On each trial, two brief bilateral displays (20 ms duration) were presented sequentially, separated by an stimulus onset asynchrony (SOA) of 100, 50, 20, or 10 ms (in different blocks). Each display contained a color-defined target on one side (red items in the examples shown here) and a distractor on the other. The two target objects could appear on the same side or on opposite sides of the displays, and participants reported whether their alphanumeric category was the same or different.
(B) Grand-average event-related potentials (ERPs) at electrodes PO7/PO8 contralateral and ipsilateral to the target in the first display on trials with same-side and opposite-same-side targets, for all four SOA conditions. The N2pc to the second target (T2) reversed polarity (indicated by arrows) relative to the N2pc to the first target (T1) when targets appeared on opposite sides. No polarity reversal was present for same-side targets. Note that negative voltage is plotted upward.
(C) N2pc difference waveforms obtained by subtracting ipsilateral from contralateral ERPs for same-side targets (solid lines) and opposite-side targets (dashed lines), for each SOA condition. Arrows mark the point where same-side and opposite-side N2pc waveforms start to diverge.
(D) Difference waves computed by subtracting opposite-side from same-side N2pc waveforms, for each SOA condition. Circles mark the point where differences reach the onset criterion value (50% of maximum amplitude). The star marks the onset latency of the N2pc to the first target (194 ms after the onset of the first display).
Current BiologyVol 24 No 2 2
N2pc differences between trials with same-side and opposite-side targets emerged 210, 218, 246, and 299 ms after the onset of the first display in the SOA10, SOA20, SOA50, and SOA100 conditions, respectively. All onset latencies shown inFigure 1D differed reliably from each other and from the onset latency of the N2pc to the first target (all p < 0.05).
The results of experiment 1 provide two insights into the time course of allocating attention to new target objects. Relative to the initial attentional selection of targets in the first display, as reflected by the onset latency of the N2pc to these targets (194 ms, marked by the black star inFigure 1D), the redistribution of spatial attention triggered by the arrival of the second target started extremely rapidly (within 16, 24, 52, and 105 ms in the four SOA conditions; seeFigure 1D). This suggests that attention can be directed to one target and then allocated to another target at a different location in the visual field within less than 20 ms. Relative to the onset of the second target, this change in the distribution of atten-tion in the visual field was elicited after 200, 198, 196, and 199 ms in the different SOA conditions. In other words, this change always occurred at the same point in time after the presentation of the second target, regardless of whether this target appeared almost immediately after the first target object (SOA10 condition) or after a longer interval (SOA100 condition).
Serial and parallel models of attentional object selection offer two fundamentally different accounts for these observa-tions. According to serial models, the focus of spatial atten-tion is unitary and moves sequentially between visual objects at different locations [2, 3]. Any allocation of attention to a new target object must therefore be preceded by the deal-location of attention from its previous deal-location. In contrast, parallel models assume that attentional processes operate simultaneously at multiple target locations [13]. If this is the case, it should be possible to allocate attention indepen-dently to different locations in the visual field, so that an attentional focus on one object is maintained while a new focus on a different object is established. The results of experiment 1 cannot directly distinguish between these two alternative scenarios. Because all targets were presented in the left or right visual field, N2pc components could only track changes in the relative distribution of spatial attention between hemifields across time but did not provide an abso-lute measure of the allocation of attention to each target object.
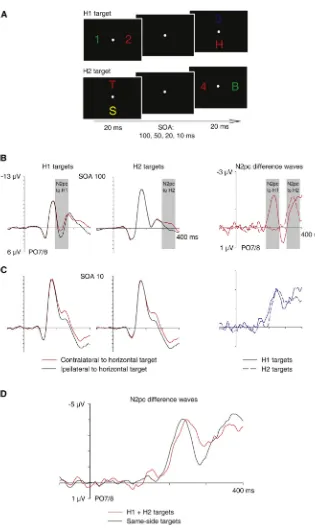
In experiment 2, we changed the spatial stimulus layout in order to measure the attentional selection of one target object independently of the attentional processing of the other. In contrast to experiment 1, one stimulus pair now always appeared on the vertical meridian (above and below fixation), and the other stimulus pair was presented on the horizontal meridian (Figure 2A). On half of all trials, the target/nontarget pair on the horizontal midline preceded the vertical pair (horizontal target first [H1 target]), and this order was reversed for the other half (horizontal target second [H2 target]). Because the N2pc is computed by comparing contralateral and ipsilateral ERP waveforms to left versus right targets, no N2pc will be elicited when target objects appear on the vertical meridian [14, 15]. In experiment 2, N2pc com-ponents in response to horizontal targets exclusively reflect the allocation of spatial attention to these targets, irrespective of any parallel attentional processing of the other (vertical) target. SOA conditions were the same as in experiment 1, and the same 12 participants were tested.
Figure 2B shows N2pc components triggered on trials where a horizontal target appeared in the first display (H1 targets) or in the second display (H2 targets) in blocks where both displays were separated by a 100 ms SOA, together with the corresponding contralateral-ipsilateral N2pc difference wave-forms. N2pc components to H1 and H2 targets showed no temporal overlap. Their peak amplitudes were identical (t < 1), and their onset latency difference (200 versus 308 ms; p < 0.001) closely matched the onset difference between H1 and H2 targets. These observations are consistent with a serial selection model where focal attention is rapidly withdrawn from one target before it is allocated to the other target, but also with two independent selection processes that are trig-gered within 100 ms of each other. To decide between these serial and parallel selection scenarios, the N2pc results observed with very short intervals between the two displays (SOA10 condition) are critical. If the attentional selection of both targets was strictly serial, N2pc components to H1 tar-gets should be very small and short lived, because attention is almost instantaneously withdrawn and redirected to the second target. This was clearly not the case:Figure 2C shows N2pc components in response to H1 and H2 targets in the SOA10 condition, and the corresponding contralateral-ipsilat-eral N2pc difference waves. There was a small but reliable N2pc onset latency difference between trials with H1 and H2 targets (202 versus 212 ms; p < 0.05), which matched the objective onset difference between these targets precisely. Most importantly, the N2pc components to H1 and H2 targets overlapped in time, and their peak amplitudes were identical (t < 1). Analogous results were found in the SOA20 and SOA50 conditions of experiment 2 (see Figure S1available online). N2pc components to H1 and H2 targets overlapped in time, particularly in the SOA20 condition, and N2pc onset latency differences again mirrored the difference in the arrival time of these targets.
The N2pc results shown inFigure 2C demonstrate that when two visual target objects that require focal attentional process-ing appear in rapid succession, attention can be allocated to the second object and simultaneously remain focused on the first. There was no evidence for an almost immediate with-drawal of attention from the first target in the SOA10 condition of experiment 2, as predicted by serial models that postulate a unitary focus of spatial attention. Advocates of such models might argue that when one target on the horizontal meridian and another target on the vertical meridian are presented nearly simultaneously, attention will be directed randomly to only one of them. In this case, N2pc amplitudes should be substantially smaller in the SOA10 condition relative to the SOA100 condition of experiment 2, because the attentional selection of a vertical target on half of all trials would trigger no N2pc. In fact, N2pc components to H1 and H2 targets were identical in size in the SOA10 and SOA100 conditions (all t < 1; seeFigures 2B and 2C), ruling out this alternative interpretation.
SOA100 conditions of experiment 1 (4.5 versus 2.6mV; p < 0.001;Figure 1C). This suggests that the nearly simultaneous selection of two targets on the same side in the SOA10 condi-tion generates two parallel attencondi-tional foci and two N2pc com-ponents that contribute independently and additively to the observed N2pc waveforms on these trials. If this is correct, the sum of the two N2pc components observed for H1 and H2 targets in the SOA10 condition of experiment 2 should match the size of the N2pc component recorded in experiment 1 on trials where the two targets appeared on the same side.
Figure 2D shows that this was indeed the case: the N2pc wave-form obtained by adding N2pc components to H1 and H2
Figure 2. Stimulus Setup and N2pc Results of Experiment 2
(A) Time course of stimulus events in experiment 2. One target/nontarget pair was presented on the horizontal meridian and the other on the vertical meridian. On half of all trials, the first target appeared on the left or right (H1 target) and the second target at the top or bottom. On the other half, the first target was presented on the vertical meridian and the second on the hori-zontal meridian (H2 target).
(B) Grand-average ERPs at electrodes PO7/PO8 contralateral and ipsilateral to the horizontal target on trials with H1 targets and H2 targets in the SOA100 condition, and N2pc difference waveforms obtained by subtracting ipsilateral from contralateral ERPs for H1 targets and H2 targets.
(C) Grand-average ERPs at electrodes PO7/PO8 contralateral and ipsilateral to H1 targets and H2 targets in the SOA10 condition, and corre-sponding N2pc difference waveforms. (D) N2pc difference waveform obtained by add-ing N2pc components to H1 and H2 targets in the SOA10 condition of experiment 2 (red), and N2pc difference waves for trials with same-side targets in the SOA10 condition of experiment 1 (black).
targets in experiment 2 was identical in amplitude to the N2pc component for same-side targets in the SOA10 condi-tion of experiment 1 (t < 1).
Our results show that spatial attention can be allocated in parallel to visual target objects at different locations. By presenting two targets at different points in time, we demonstrated that each target selection process follows its own distinct time course, which strongly suggests that these processes are triggered independently of each other. When two target objects arrive nearly simultaneously, an attentional focus on a new target object can be established within a few milliseconds af-ter the attentional selection of the other target, while the current attentional focus on the first target is maintained (see [16] for corresponding evidence for temporally overlapping attentional foci from single-unit recordings in ma-caque visual cortex). The observation that participants’ performance in the letter/digit discrimination task was not impaired with very short as compared to longer intervals between the two displays (seeTable S1) also sug-gests that both targets were selected in parallel. This observa-tion is in line with earlier studies demonstrating highly efficient visual search for letters among digits (or vice versa), with flat search functions [17, 18]. Such findings have previously been interpreted as evidence that letters and digits are identified and categorized in parallel at an early preattentive processing stage, independent of focal attention [18]. The current results show that this account needs to be revised. Spatial attention is involved in the processing of alphanumerical category and
Current BiologyVol 24 No 2 4
can be allocated in parallel to different letters or digits. Attentional object selection may operate in parallel whenever the discrimination of targets is relatively easy. In more difficult selection tasks, target selection may instead depend on a single attentional focus and sequential shifts of spatial attention [5, 14].
The hypothesis that attention can be directed simulta-neously to multiple visual objects has been proposed in recent accounts of multiple object tracking [19] and target selection in visual search [20]. In these two domains, N2pc amplitudes were found to increase with the number of simultaneously present targets [21, 22], and this has been attributed to mech-anisms involved in the individuation of visual objects. The current results provide clear evidence that such N2pc ampli-tude increases reflect multiple foci of spatial attention that can be established independently at different locations and operate in a parallel and additive fashion. This type of multi-focal target selection might be controlled by feature-based attention, which is known to act in a spatially global fashion across the visual field [23, 24] and can guide focal attention toward the location of potential target objects [25]. Overall, our findings challenge the hypothesis that focal attention can be allocated to only one object at a time and that the spatial selection of visual target objects generally operates in a strictly serial fashion. What we have demonstrated is the existence of a fast and flexible mechanism of directing attention inde-pendently and in parallel to different target objects. Such a mechanism has obvious adaptive value for the guidance of attentional selectivity in complex and rapidly changing real-world visual environments.
Experimental Procedures
Stimuli were uppercase letters (B, H, S, or T) and digits (1, 2, 3, or 4) that were red (CIE color coordinates 0.637/0.329), yellow (0.423/0.461), green (0.264/ 0.556), or blue (0.179/0.168) and subtended a visual angle of 0.930.9. All stimuli were equiluminant (7.5 cd/m2) and were presented at an eccen-tricity of 2.4from central fixation against a black background. Each trial contained two successive stimulus displays that were both presented for 20 ms. Both displays contained one target-color object and one object in a randomly selected nontarget color (as shown inFigures 1A and2A). Target color (red, yellow, green, or blue) was counterbalanced across participants. The stimulus onset asynchrony (SOA) between the two displays (100, 50, 20, or 10 ms) remained constant within each block of trials and was varied between blocks. In experiment 1, all displays contained one stimulus to the left and one to the right of fixation. The first stimulus pair was presented in the upper visual field and the second pair in the lower visual field, or vice versa. The two target items appeared unpredictably on the same side or on opposite sides (Figure 1A). In experiment 2, the first stimulus pair appeared on the horizontal meridian and the other on the vertical meridian, or vice versa (Figure 2A).
Twelve neurologically unimpaired paid participants (5 females and 7 males, mean age 30.7 years) were tested. The experimental procedures were approved by the Ethics Committee, Department of Psychology, Birk-beck College. The experiment contained 48 experimental blocks with 64 tri-als per block. All participants completed six successive blocks for each of the four SOA conditions and the two spatial stimulus layouts. Two testing sessions were run for each participant on different days. One session included the SOA10 and SOA20 conditions of experiments 1 and 2, and the other session included the SOA50 and SOA100 conditions of these two experiments. Participants’ task was to report with a left-hand or right-hand button press whether the category of the color targets in the two displays was the same (two digits or two letters) or different (one digit, one letter). Reaction times (RTs, measured relative to the onset of the second display) and error rates are shown inTable S1. RTs did not differ reliably between experiments 1 and 2, or between SOA conditions in either experiment. There were also no reliable differences in error rates between experiments or SOA conditions. Electroencephalograms (EEGs) were recorded during task performance using our standard EEG recording,
artifact rejection, and analysis procedures [9, 15]. N2pc onset latency comparisons between conditions were performed with a jackknife-based procedure with a 50% maximum amplitude criterion [11, 12], and all F and t values were corrected as prescribed. N2pc onset was defined as the time point where difference amplitudes reached 50% of their maximum.
Supplemental Information
Supplemental Information includes one figure and one table and can be found with this article online athttp://dx.doi.org/10.1016/j.cub.2013.12.001.
Acknowledgments
This work was supported by a grant from the Economic and Social Research Council (ESRC), UK.
Received: September 25, 2013 Revised: November 8, 2013 Accepted: December 2, 2013 Published: January 9, 2014
References
1. Jans, B., Peters, J.C., and De Weerd, P. (2010). Visual spatial attention to multiple locations at once: the jury is still out. Psychol. Rev. 117, 637–684.
2. Treisman, A.M., and Gelade, G. (1980). A feature-integration theory of attention. Cognit. Psychol.12, 97–136.
3. Wolfe, J.M. (1994). Guided Search 2.0 A revised model of visual search. Psychon. Bull. Rev.1, 202–238.
4. Saarinen, J., and Julesz, B. (1991). The speed of attentional shifts in the visual field. Proc. Natl. Acad. Sci. USA88, 1812–1814.
5. Woodman, G.F., and Luck, S.J. (1999). Electrophysiological measure-ment of rapid shifts of attention during visual search. Nature 400, 867–869.
6. Duncan, J., Ward, R., and Shapiro, K. (1994). Direct measurement of attentional dwell time in human vision. Nature369, 313–315. 7. Luck, S.J., and Hillyard, S.A. (1994). Spatial filtering during visual search:
evidence from human electrophysiology. J. Exp. Psychol. Hum. Percept. Perform.20, 1000–1014.
8. Eimer, M. (1996). The N2pc component as an indicator of attentional selectivity. Electroencephalogr. Clin. Neurophysiol.99, 225–234. 9. Eimer, M., and Kiss, M. (2008). Involuntary attentional capture is
deter-mined by task set: evidence from event-related brain potentials. J. Cogn. Neurosci.20, 1423–1433.
10. Hopf, J.M., Luck, S.J., Girelli, M., Hagner, T., Mangun, G.R., Scheich, H., and Heinze, H.J. (2000). Neural sources of focused attention in visual search. Cereb. Cortex10, 1233–1241.
11. Miller, J., Patterson, T., and Ulrich, R. (1998). Jackknife-based method for measuring LRP onset latency differences. Psychophysiology35, 99–115.
12. Ulrich, R., and Miller, J.O. (2001). Using the jackknife-based scoring method for measuring LRP onset effects in factorial designs. Psychophysiology38, 816–827.
13. Desimone, R., and Duncan, J. (1995). Neural mechanisms of selective visual attention. Annu. Rev. Neurosci.18, 193–222.
14. Woodman, G.F., and Luck, S.J. (2003). Serial deployment of attention during visual search. J. Exp. Psychol. Hum. Percept. Perform. 29, 121–138.
15. Eimer, M., Kiss, M., and Nicholas, S. (2011). What top-down task sets do for us: an ERP study on the benefits of advance preparation in visual search. J. Exp. Psychol. Hum. Percept. Perform.37, 1758–1766. 16. Khayat, P.S., Spekreijse, H., and Roelfsema, P.R. (2006). Attention lights
up new object representations before the old ones fade away. J. Neurosci.26, 138–142.
17. Egeth, H., Jonides, J., and Wall, S. (1972). Parallel processing of multi-element displays. Cognit. Psychol.3, 674–698.
18. Duncan, J. (1980). The locus of interference in the perception of simul-taneous stimuli. Psychol. Rev.87, 272–300.
19. Cavanagh, P., and Alvarez, G.A. (2005). Tracking multiple targets with multifocal attention. Trends Cogn. Sci.9, 349–354.
21. Drew, T., and Vogel, E.K. (2008). Neural measures of individual differ-ences in selecting and tracking multiple moving objects. J. Neurosci. 28, 4183–4191.
22. Mazza, V., and Caramazza, A. (2011). Temporal brain dynamics of multiple object processing: the flexibility of individuation. PLoS One6, e17453.
23. Bichot, N.P., Rossi, A.F., and Desimone, R. (2005). Parallel and serial neural mechanisms for visual search in macaque area V4. Science 308, 529–534.
24. Saenz, M., Buracas, G.T., and Boynton, G.M. (2002). Global effects of feature-based attention in human visual cortex. Nat. Neurosci.5, 631–632.
25. Serences, J.T., and Boynton, G.M. (2007). Feature-based attentional modulations in the absence of direct visual stimulation. Neuron55, 301–312.
Current BiologyVol 24 No 2 6