Developing a Scale for Quality of Using
Learning Strategies
Guntay Tasci
1,*, Halil Yurdugul
21Department of Primary Education, Erzincan University, Turkey
2Department of Computer Education and Instructional Technology, Hacettepe University, Turkey
Copyright©2016 by authors, all rights reserved. Authors agree that this article remains permanently open access under the terms of the Creative Commons Attribution License 4.0 International License
Abstract
This study aims to develop a measurementtool to measure the quality of using learning strategies. First, the quality of using learning strategies was described based on the literature. The 32 items in the 5-point Likert scale were then administered to 320 prospective teachers, and they were analysed with exploratory factor analysis using unweighted least squares method and promax rotation technique. The four-factor 15 items formed were applied to another study group of 203 prospective teachers. Of the models tested for the factorial structure of the scale in this data set using confirmatory factor analysis (CFA), the four-dimensional structure displayed perfect fit with the data. It was found that the Cronbach’s Alpha coefficient calculated for the whole scale and for the sub-dimensions in the first sample rose and reached a good level of internal consistency and that the McDonald’s omega coefficient calculated yielded coefficients close to these values. In this way, a valid and reliable measurement tool was developed to measure the quality of using learning strategies in this framework.
Keywords
Self-regulated Learning Strategies, Qualityof Using Learning Strategies, Scale Development
1. Introduction
1.1. Learning Strategies: Concept Determination and Definition
The self-regulated learning approach is theoretically based on the views of social cognitive learning theory and social constructivism [1]. Here, the learning process is described as a model emerging with the interaction of environment, personal traits and manner of behaviour. In this sense, self-regulated learning may be defined as a way of learning that regulates the process of learning through thoughts created by the learners themselves. Self-regulated learning, which is regarded as a desired type of learning, is understood
as learners’ being responsible in the process of learning. This is a complex structure involving metacognition, attention control, motivation, emotions and learning strategies. Wild and Möller [2] broadly classify a number of self-regulated learning models as process-oriented models and layer models. Stratified models call attention to different levels of self-regulation, not to the flow of self-regulation. Learning strategies are very important for learners to overcome many environmental and personal difficulties. In the approach of stratified model, which is emphasised by Boekaerts [3], learning strategies are considered as structural constituents leading to learning; and they are thought to be closely related with information processing. Learning strategy is defined in a number of studies as the whole of cognitive, behavioural procedures or procedures serving to a certain purpose for coding or acquiring new knowledge [4, 5, 1].
1.2. Scales Available
are handled separately. The representatives of this approach are Weinstein and Mayer [4], Pintrich, Smith, Garcia, and McKeachi [9], and Wild and Schiefele [8]. These three groups of researchers describe three types of strategies that they themselves manage in consistency with the requirements of a learning situation so as to attain the learning goals. These strategies are: metacognitive strategies, cognitive strategies, and resource management. Of these scales, Learning and Study Strategies Inventory (LASSI) [4] comes into prominence as it defines learning in a cognitive psychological approach. Learning is conceptualised as coding, and it is concretized as selecting, storing, configuring, and integrating. Weinstein and Mayer [4] include the categories of learning strategies into the stages of information processing. In this sense, rehearsal strategies involve selection and storage whereas organization and evaluation strategies involve configuring the knowledge. Besides, the process of coding is handled in connection with motivation and the special requirements of the task to be fulfilled. Motivated Strategies for Learning Questionnaire (MSLQ) [9], another important scale, is composed of motivation, cognitive learning strategies and metacognitive learning strategies. Cognitive learning strategies, which are said to serve directly to receiving, processing and storing information, are handled along with critical thinking in addition to three dimensions in the LASSI. On examining scale “Lernstrategien im Studium” (LIST) [8], items measuring the frequency of use of learning techniques such as summarising, emphasising, distinguishing, reading, maintaining rehearsal, activating prior knowledge and finding examples will be found.
1.3. Critical Look at the Scales Developed
Entwistle and McCune [10] report that several questionnaires have been designed to research how learners study and how they learn. When examining the commonly used measurement tools, similarities are observed in terms of items and factor structures; as is also stressed in the literature. When the items in these questionnaires are analysed, it is found that they are indeed customary items related with learners’ use of typical strategies. Despite these tools, which are designed on the basis of strong theories and through methods of scale development, many researchers argue that there are weak correlation between learning strategies and learning achievement [11–13]. Related to this, Artelt [14] offers explanations on the operationality of learning strategies and states that the items of strategy scales can be away from behaviours and that the real details for the behaviour of learning strategies cannot be exhibited by answering a few scale items. Schiefele [15] discusses the validity lacking in the surveys for learning strategies. According to the researcher, the restriction of offering information about our own cognitive processes is its difficulty. Accordingly, precision is weak in measuring the learning strategies through giving information about learners
themselves and many details might be neglected in evaluations related with the process without a tangible learning situation. Glaeser- Zikuda [16] reports the formulation of questionnaire items is disconnected to behaviours, in a general manner and in a partly complex manner as a cause for the finding that there are weak correlation between learning achievement and learning strategies. It is emphasised that whether the learning strategies stated in the scales for learning strategies are used effectively and the coordination between different learning strategies are ignored [15]. In parallel, Pressley, Borkwski and Schneider [17] in their research studies concerning the model of using good strategies, describe several variables influencing strategy use. In the same vein, Hasselhorn and Gold [1] also count the flexible and interactive use of strategies among the properties of successful learners. This criterion indicates that techniques are not sequential but are in the form of patterns in the process of learning. This pattern means that techniques such as reading, summarising, note taking and memorising are supported by organisation, evaluation and by other techniques of metacognitive learning strategies. Taşçi and Soran [18] point to differences in the process of using the technique when students use the same technique. The differences indicate that while some students employ such techniques as reading, summarising, note taking and memorising in addition to techniques of focusing on concepts, asking questions and comprehending; other students just use techniques such as underlining while reading, copying down the parts they choose, and reading as it is.
1.4. Purpose
These properties point to the quality of use of learning strategies addressed in this research, and it is thought that this case is influential in students’ yielding different outcomes despite using similar strategies. Therefore, this current study describes the quality of using learning strategies as learners’ supporting the techniques they employ with techniques of cognitive and metacognitive strategies. Studies concerning scale development is generally concerned with how often learners employ learning techniques in their study process. In this study, however, the techniques with which learners support their learning technique in their learning process are understood as the quality of using learning strategies, and accordingly, an operational definition might be using the techniques about cognitive learning strategies synchronically with metacognitive strategies and strategies of evaluation. Thus, this study aims to develop the scale for the quality of using learning strategies in order to measure this variable, which is defined operationally.
2.1. Process
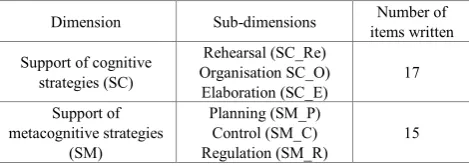
[image:3.595.61.296.215.298.2]First, the quality of using learning strategies is defined before writing the items of the scale. The definition is based on the use of different strategies in combination rather than in isolation or separation. Accordingly, a distinction was made between learning strategies supporting each other and their being supported by metacognitive strategies. The dimensions, sub-dimensions formed accordingly, and the numbers of items to measure them are shown in Table 1.
Table 1. Number of items formed according to the operational definition
Dimension Sub-dimensions items written Number of
Support of cognitive strategies (SC)
Rehearsal (SC_Re) Organisation SC_O)
Elaboration (SC_E) 17
Support of metacognitive strategies
(SM)
Planning (SM_P) Control (SM_C)
Regulation (SM_R) 15
Support given to the learning strategies is brought into prominence while using the learning strategies in accordance with the operational definition. Based on this, the two main components were determined: support of cognitive learning strategies, and support of metacognitive strategies. These main dimensions were divided into three sub-dimensions in the table. The items written to measure these dimensions were formulated in the form of statements containing the use of learning techniques described in the literature. After that, a pioneering statement was prepared at the beginning of each item, and then the items were written in a manner to receive support from cognitive learning strategies and from metacognition. The items are in the 5-point Likert scale graded between “never” and “always”. A sample statement from the scale reads as:
“While using techniques such as reading, summarising and note taking...
1. I try to set up associations between new knowledge presented in the content and my prior knowledge.”
As is clear from the sample scale item, items are connected with a common pioneer, and they contain the use of different learning techniques. The items prepared in this way were analysed by the researchers—one of whom held a doctorate degree in measurement and evaluation in education and the other of whom held a doctorate degree in biology education—in terms of language and clarity, and then they were examined by another academician (a professor) having publications in the field of self-regulation and thus the items were given their final shape. Expert opinion was consulted, and consequently, no change was made in the number of items, but some of the items were modified in terms of expression to serve the purpose. Content validity of the scale was attained qualitatively in this way. Following that, the statistical analysis stages started.
2.2. Participants
There are two different samples in the study. For Study 1,
a study group of 320 prospective teachers who were the students of Erzincan University Educational Faculty in the 2012-2013 academic year was formed. The students included in the sample attended five different programs of the Elementary Education and Educational Sciences departments of the Faculty of Education. The included programs were as follows: Social Sciences Teaching (15.3%), Science Education (14.7%), Elementary School Teaching (38.8%), Mathematics Education (15.9%), and Psychological Counselling and Guidance (15.3%). Of the study group, 46% were female, whereas 54% was male. Their distribution according to grade levels was as follows: 38.3% were first-year students, 22.5% were second-year students, 35.3% were third-year students, and 3.8% were fourth-year students. Academic averages of participants were mostly between 2 and 2.99.
For Study 2, 203 prospective teachers from the same university were reached. 57.5% of them were female and 42.6% were male participants, and 10.7% of them attended the psychological counselling and guidance department and 89.3% attended elementary school teaching department. These participants were first-years (54.3%), second-years (11.5%), third-years (7.8%), and fourth-year (26,4%) students at the some university.
2.3. Data Analysis
2.3.1. Study 1
The data obtained by applying the initial or pilot form of the scale to sample one was analysed with exploratory factor analysis using SPSS 19 program by using unweighted least square estimation method and promax rotation. First, the scree plot formed by taking eigenvalue as 1 was examined, and the potential number of factors was determined. Analyses conducted for factors of differing numbers were evaluated, and the number of factors in which items were in the best combination meaningfully was decided on. At this stage, reliability were estimated during Cronbach’s Alpha coefficients, which is called internal consistency method for reliability [19] for the overall scale and for the factors of the scale.
2.3.2. Study 2
3. Findings
3.1. Study 1
The data set obtained was analysed through EFA for the construct validity of the item pool formed in this study. As is evident from the scree plot shown in Figure 1, the first and the second eigenvalues are higher than the others.
Figure 1. First Scree Plot
[image:4.595.60.294.179.379.2]Yet, scree plot has a horizontal trend beginning with eigenvalue 4. At this stage, it was concluded that the scale was multidimensional. First, factor loads calculated in the pattern matrix of the items by analysing the factors with eigenvalues bigger than one were analysed in order to decide on the number of factor of the scale. The analyses were repeated five times in order to make the final decision. At the end of each analysis, the items whose factor loads were smaller than .30 on all dimensions and the items whose factor loads were bigger than .30 on more than one dimension were removed from the scale, and the analyses were repeated. The scree plot obtained as a consequence is shown in Figure 2.
Figure 2. Final Scree Plot
The scree plot obtained indicates a four-factor and 15-item
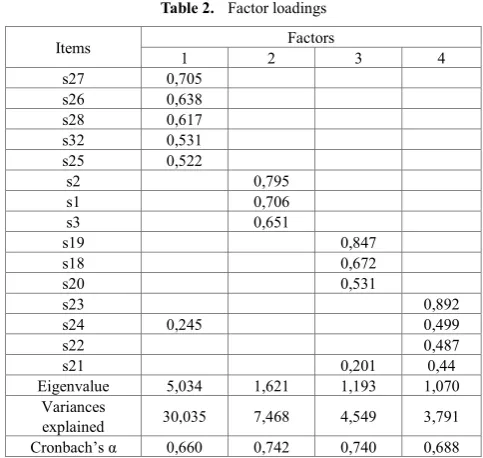
structure. The factor loads obtained, explained variance percentages, and eigenvalues are shown in Table 2. Upon examination, it becomes evident that the factor loads for the items are between 0.44 and 0.89, and that the variances explained by the factors are between 30.035% and 3.8%. An examination of the items makes it clear that only those 3 items are related with prior knowledge activation constituting the support of evaluation strategies and with setting up associations centered around one dimension (s1, s2, s3). Items predicted to be on the dimension of metacognitive support are divided into three factors thought to be theoretically appropriate. Of them, s18, s19 and s20 are the items related with plan; s21, s22, s23 and s24 are related with control, s25, s26, s27, s28 and s32 are related with regulation strategies. Cronbach’s Alpha coefficients are 0.819 for the whole scale, and between 0.66 and 0.74 for the sub-dimensions. In order to test this structure, it was demanded that dimensions be formed between 3 and 7 with all items and thus the analyses were repeated, item combinations and statistical values were compared. These analyses showed that there was a meaningful combination only in four-dimensional analysis. It is expected that three sub-dimensions are formed for each of cognitive learning strategies support and metacognitive learning strategies support, as is predicted in Table 1. Metacognitive learning strategies support emerges three-dimensionally as expected, but for cognitive learning strategies, only three items related with prior knowledge activation (evaluation strategy) formed a sub-dimension, and the other items do not work. Because evaluation strategies were considered as the most important dimension of learning strategies influencing the quality of using learning strategies, the factor load obtained was found theoretically correct.
Table 2. Factor loadings
Items 1 2 Factors 3 4
s27 0,705
s26 0,638
s28 0,617
s32 0,531
s25 0,522
s2 0,795
s1 0,706
s3 0,651
s19 0,847
s18 0,672
s20 0,531
s23 0,892
s24 0,245 0,499
s22 0,487
s21 0,201 0,44
Eigenvalue 5,034 1,621 1,193 1,070
Variances
explained 30,035 7,468 4,549 3,791
Cronbach’s α 0,660 0,742 0,740 0,688
[image:4.595.310.552.482.711.2] [image:4.595.61.297.547.736.2]Table 3. Confirmatory factor analysis fit indices for the models
Fit indices Perfect fit Acceptable fit One-factor model Uncorrelated model Correlated model
χ2/df χ2/df <3 3< χ2/df <5 4,26 4,44 2,13
RMSEA 0 <RMSEA<0,05 0,05 <RMSEA< 0,08 0.12 0,13 0.065
NNFI 0,97≤NNFI≤1 0,95<NNFI<0,97 0,86 0,85 0.93
NFI 0,97≤NFI≤1 0,95<NFI<0,97 0.85 0,84 0.95
CFI 0,97≤CFI≤1 0,95<CFI<0,97 0.88 0,87 0.96
GFI 0,95≤GFI≤1 0,90<GFI<0,95 0,82 0,81 0.91
Table 4. Descriptive statistics for sub-dimensions, correlations between dimensions, and square roots of AVE
SC_E SM_P SM_C SM_R M SD n AVE
SC_E 0,78* 12,98 2,17 203 0,610
SM_P 0,54 0,82* 13,19 2,26 203 0,666
SM_C 0,54 0,62 0,73* 16,83 2,98 203 0,513
SM_R 0,42 0,61 0,73 0,77* 21,32 3,83 203 0,594
*: represents the square root of AVE values
3.2. Study II
The structure obtained through exploratory factor analysis was tested through confirmatory factor analysis. Three different models were formed for this. One of them is one dimensional taking for granted that all items cluster on one dimension, the second is the unrelated model formed with EFA results assuming that four factors are separate structures, and the third one is the model, which regards the factors as a related four-dimensional structure. The models and the model data fit indices are shown in Table 3.
On examining the table, it was found that the fit indices did not have acceptable values for one-dimensional and uncorrelated models, while the model for the correlated model had acceptable values [(χ2 (84, N = 203) = 170,30 p < .000; χ2/df = 2.13; RMSEA = 0.065; NNFI = 0.93; NFI = 0.95; CFI = 0.96; GFI = 0.91]. Therefore, the four-dimensional factor structure was accepted for the scale, and the study was carried on. On examining the correlations shown in the Table 4, it becomes evident that they are in the 0.42 and 0.73 range. Then the AVE (average variance extracted) values and the square roots of the AVE values were calculated. The findings are shown in Table 4.
Accordingly, the square roots of the AVE values calculated are bigger than the values for the correlations with the other sub-dimensions. This is thought to be evidence for discriminant validity. It is observed that the variances explained by latent variables are bigger than .50. This is considered to be evidence for convergent validity. Accordingly, it is clear that correlations are higher between the dimensions of metacognitive learning strategies (>0.60), and that they are lower in evaluation strategies. On the other hand, it was also found that factor loads are between 0.52 and 0.72 (Table 5).
The structural relations of the four dimensions with an upper-level variable (quls) were analysed with second-order confirmatory factor analysis in order to show that the four sub-dimensions put forward through first order confirmatory factor analysis represented the quality of the use of learning strategies claimed in the operational definition. For these purposes, second order “quls” latent variable was added to the connection diagram in the first order analysis, and thus analyses were done. It was observed that the fit indices found through this application were similar to the ones in CFA results and that they were at acceptable levels [(χ2 (116, N = 203) = 216,84 p < .000; χ2/df=1,86; RMSEA=0,065; NNFI=0,95; NFI=0,93; CFI=0,96; GFI=0,91]. An examination of the factor loads between first-order latent variables and the quality of using learning strategies—which is an upper order variable—shows that the “quls” variable predicts metacognitive control variable (SM_C) at the highest level (β = 0.87, t = 4.12, p < .05; R2 = 0.76), and cognitive evaluation at the lowest level (SC_E: β = 0.60, t = 5.81, p < .05; R2 = 0.37). It is also observed that it predicts significantly the sub-dimensions of upper level variable metacognitive planning (SM_P: β = 0.75, t = 6.00, p < .05; R2 = 0.76) and metacognitive regulation (SM_R: β = 0.81, t = 5.71, p < .05; R2 = 0.65). This is not different in the variance explained, either. Based on these findings, it was concluded that the scores received for the sub-dimensions of the measurement tool and for the total of sub-dimension scores were usable.
3.3. Reliability
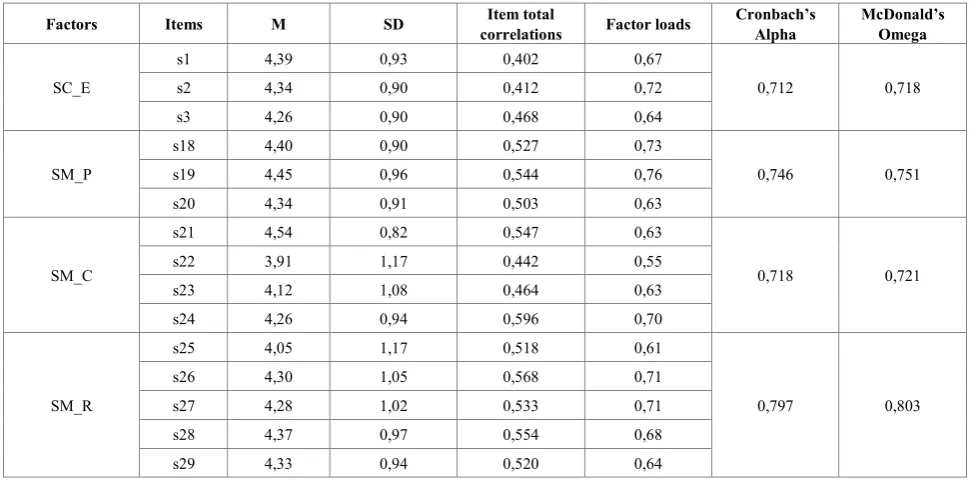
Table 5. Reliability values for the Factors
Factors Items M SD correlations Item total Factor loads Cronbach’s Alpha McDonald’s Omega
SC_E
s1 4,39 0,93 0,402 0,67
0,712 0,718
s2 4,34 0,90 0,412 0,72
s3 4,26 0,90 0,468 0,64
SM_P
s18 4,40 0,90 0,527 0,73
0,746 0,751
s19 4,45 0,96 0,544 0,76
s20 4,34 0,91 0,503 0,63
SM_C
s21 4,54 0,82 0,547 0,63
0,718 0,721
s22 3,91 1,17 0,442 0,55
s23 4,12 1,08 0,464 0,63
s24 4,26 0,94 0,596 0,70
SM_R
s25 4,05 1,17 0,518 0,61
0,797 0,803
s26 4,30 1,05 0,568 0,71
s27 4,28 1,02 0,533 0,71
s28 4,37 0,97 0,554 0,68
s29 4,33 0,94 0,520 0,64
As is clear from the table, item total correlations in the scale are bigger than .30 and they range between .402 and .596. Cronbach’s Alpha values for the factors of the scale are between .712 and .797. It is also evident that McDonald’s omega values are close to Cronbach’s Alpha values, and that all are above .70.
4. Discussion
The quality of using learning strategies was operationally defined in this study through literature review, and 32 items were prepared in accordance with the definition. The items prepared were formulated in a manner as to represent the support of routinely used learning techniques by cognitive and metacognitive learning strategies. This formulation was based on the finding that the techniques constituting the learning strategies were used in interaction as patterns, not separately in the process of learning (Taşçi & Soran, 2012). The extent to which the items pool measured the operational definition was analysed through qualitative evaluations made by the researchers who were included in the research and who held doctorate degrees. Having attained content validity in this way, a four-dimensional structure was reached through factor analysis conducted on the data set. The structure formed was evaluated for probable numbers of dimensions, item combinations were compared, and in consequence, a four-dimensional structure with 15 items was decided on. The factorial structure of the scale demonstrates that metacognitive strategies and cognitive strategies (especially the strategy of prior knowledge activation, which is considered among evaluation strategies) are the dimensions of the quality of strategy use. It was found that metacognition did not have direct effects on the process of
learning in self-regulated learning models, but that it influenced by managing the cognition. It was clear that the items prepared according to the operational definition and in relation to plan, control and regulation strategies were confirmed. Evaluation strategies, which are among cognitive strategies, are defined as integration of new knowledge with existing knowledge; and they play important roles in learning. Prior knowledge activation, which is an important technique of this strategy, manifests itself as a dimension for the quality of learning strategy use. This situation shows that the structure, which has been reached statistically, is supported. It was observed at this stage that Cronbach’s Alpha coefficient was 0.819 for the whole scale, and that it was between 0.66 and 0.74 for the dimensions. The data set, which was obtained by applying the 15-item form to another group of 203 participants at the second stage, confirmed the structure with first and second order confirmatory factor analyses. It was seen that the reliability coefficients calculated on the basis of two different criteria rose to 0.865 for the whole scale and to the 0.71-0.79 range for the sub-dimensions.
Thus, on grading the scale items with no items to be inversely coded between 1 and 5, a valid and reliable measurement tool that can yield scores between 15 and 75 and for whose sub-dimensions separate scores can be calculated was obtained. It was proven that the scale in this final form could make measurements in accordance with the operational definitions. It may be stated that the scale is suitable to the level of higher education considering the sample for which it was developed.
structure put forward was obtained with this study. Hence, it is thought that a new sub-scale has been provided in measuring the learning strategies in the existing scales. In order to prove this, it is considered necessary to demonstrate with statistical models that learning strategies scale is a significant predictor of learning strategies with advanced work. Besides, researching the already researched variables such as achievement, cognitive structure and epistemological beliefs through quality of using learning strategies will be useful in understanding the importance of the scale developed.
REFERENCES
[1] M. Hasselhorn and A. Gold, Paedagogische
Psychologie:Erfolgreiches Lernen und Lehren, 1st ed.
Stuttgart: Kohlhammer Verlag, 2006.
[2] E. Wild and J. Möller, Paedagogische Psichologie. Heidelberg: Springer Verlag., 2009.
[3] M. Boekaerts, “Self-regulated learning: Where we are today,”
Int. J. Educ. Res., vol. 31, no. 6, pp. 445–457, 1999.
[4] C. Weinstein and R. Mayer, “The teaching of learning strategies,” in Handbook of research in teaching, M. . Wittrock, Ed. New York: Macmillan., 1986, pp. 315–327. [5] U. Schiefele and R. Pekrun, “Psychologische Modelle des
fremdgesteuerten und selbstgesteuerten Lernen,” in
Enzyklopädie der Psychologie. Pädagogische Psychologie:
Bd. 2. Psychologie des Lernens und der Instruktion, Göttingen:
Hogrefe., 1996, pp. 249 – 278.
[6] A. Krapp, “Lernstrategien: Konzepte, Methoden und Befunde,”
Unterrichtswissenschaft, vol. 27, no. 4, pp. 291–311, 1993.
[7] K. Wild, Lernstrategien im Studium. Münster: Waxmann, 2000.
[8] K.-P. Wild and U. Schiefele, “Lernstrategien im Studium: Ergebnisse zur Faktorenstruktur und Reliabilität eines neuen Fragebogens,” Zeitschrift für Differ. und Diagnostische
Psychol., vol. 75, no. 4, pp. 185 – 200, 1994.
[9] P. Pintrich, D. Smith, T. Garcia, and W. McKeachie, “Reliability and predictive validity of the motivated strategies
for learning questionnaire (MSLQ).,” Educ. Psychol. Meas., vol. 3, pp. 801 – 813, 1993.
[10]N. Entwistle and V. McCune, “The conceptual bases of study strategy inventories,” Educ. Psychol. Rev., vol. 16, no. 4, pp. 325–345, 2004.
[11]H. Ditton, “Studieninteresse, kognitive Fähigkeiten und Studienerfolg,” in Pädagogisch-psychologische
Interessenforschung in Studium und Beruf, J. Abel and C.
Tarnai, Eds. Münster: Waxmann, 1998, pp. 45–61.
[12]U. Schiefele, L. Streblow, U. Ermgassen, and B. Moschner, “Lernmotivation und Lernstrategien als Bedingungen der Studienleistung: Ergebnisse einer Langsschnittstudie,”
Zeitschrift fur Padagogische Psychol., vol. 17, no. 3–4, pp.
185–198, 2003.
[13]H. Thillmann, “Selbstreguliertes Lernen durch Experimentieren: Von der Erfassung zur Förderung,” no. August, pp. 1–212, 2007.
[14]C. Artelt, “Lernstrategien und Lernerfolg - Eine handlungsnahe Studie.,” Z. Entwicklungspsychol. Padagog.
Psychol., vol. 31, no. 2, pp. 86 –96, 1999.
[15]U. Schiefele, “Prüfungsnahe Erfassung von Lernstrategien und deren Vorhersagewert für nachfolgende Lernleistungen,”
in Lernstrategien und Metakognition: Implikationen für
Forschung und Praxis, C. Artelt and B. Moschner, Eds. Berlin:
Waxmann Verlag, 2005, pp. 13 –41.
[16]M. Glaeser-Zikuda, “Qualitative İnhaltanalyse in der Lernstrategie und lernmotivationsforchug.,” in Die Praxis der
Qualitativen Inhaltsanalyse, P. Mayring and M. Glaeser, Eds.
Weinheim: Beltz Verlag, 2005, pp. 630–83.
[17]M. Pressley, J. G. Borkwski, and W. Schneider, “Good information processing: What it is and how education can promote it,” Int. J. Educ. Res., vol. 13, no. 8, pp. 857–867, 1989.
[18]G. Taşçi and H. Soran, “Yüksek Öğretim Biyoloji Öğrencilerinin Öğrenme Stratejileri ve Bilişsel Yapılarının İncelenmesi,” Hacettepe Üniversitesi Eğitim Fakültesi Derg., no. 42, pp. 394–405, 2012.
[19]L. Crocer and J. Algina, Introduction to Classical and Modern
Test Theory. United States: Wadsworth Group- Thomson
Learning, 1986.