Digital Natives or Digital Tribes?
Ian Robert Watson
Faculty of Engineering and Environment, Northumbria University, UK *Corresponding Author: [email protected]
Copyright © 2013 Horizon Research Publishing All rights reserved.
Abstract
This research builds upon the discourse surrounding digital natives. A literature review into the digital native phenomena was undertaken and found that researchers are beginning to identify the digital native as not one cohesive group but of individuals influenced by other factors. Primary research by means of questionnaire survey of technologies used by students in three countries was carried out. Findings identify a number of differences in the technologies preferred by students for education and those used in their social lives. From being one digital native, it may be clearer to look to the culture and region of where the student lives and is educated and the ‘tribe’ they belong to rather than assume there is one digital native population.
Keywords
Digital natives, digital immigrants, digital tribes1. Introduction
Since the term ‘digital natives’ was popularised by Marc Prensky [1] there has been an on-going discussion and evaluation of the term. The debate around the digital native has progressed over the last twelve years, with some researchers believing that since the natives exist education must change to address this [2] and other investigators taking a more impartial approach and asking if the natives do exist as discussed by Prensky [3-5]. Research into the latter has identified a body of evidence to suggest there is a difference in use of technologies, not solely based on the year of birth of the student, but based on their nationality and the educational system in which they grow up [6,7].
This research paper aims to look to this continuation of the digital native debate and answer two questions, ‘do digital natives in 2013 exist as defined by Prensky in 2001?’ and ‘Is there a difference in use of technologies between digital natives of different nationalities?’ The first question will be investigated by an in depth review of recent literature, the second by analysis of a questionnaire distributed to three different groups of students, from the United Kingdom, Malaysia and South Korea.
2. Literature Review
This literature review begins by looking at the digital native/digital immigrant debate and questioning ifwhat teaching staff think students want from education, differs from what the learners actually want; the two, teacher and learner may not be speaking the same digital language, as one is the digital immigrant and the other the digital native. Are the technologies used by digital natives really what the learner wants/needs or is it just what academics and support staff think they want because we class the potential users of the tool as digital natives? It might be better to look at the experience and breadth of use of technologies by students, rather than to just assume the educator knows best. What this work will do is to investigate the technologies that the students in three different countries use.
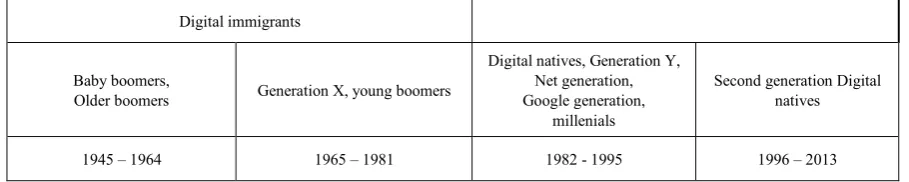
The students in this study will by definition be ‘digital natives’ by virtue of when they were born (see Figure 1), and their teacher largely digital immigrants.
accepted that the digital native exists based upon their decade of birth. But there is a body of evidence to suggest that there are differences in the digital natives depending upon other factors rather than just when they were born. For instance their place of birth and their nationality, [6] carried out a survey of just under 12 000 students (aged 15 -24) in Asia, these included Indian, Chinese, Thai, Indonesian and Malay students, differences were evident within the survey, e.g. Web 2.0 application use varied from country to country, in Thailand students spent four times as long on email activity than those in India. In all cases students multitasked, emailed, listening to music, updating social networking sites etc. to the extent that some students managed to squeeze 38 hours of activity into one 24 hour period. This multitasking can be seen as a double edged sword – and begs the question does multitasking make the digital natives more productive or less? Some authors [12] found that though the traditional definition of the digital native applied to the students in their study, that the competency of these students varied in several areas, such as schools the students attended and had no relation to if the students owned a personal computer. Others [13] define digital natives in a manner outside of their year of birth, looking to their feelings, descriptions and behaviours about their online activity – their year of birth is added as a supplement their digital nativism as an indicator. Their findings suggest that digital natives were less likely to personally exchange information with classmates and to solve problems themselves without prompting, guidance and encouragement, though less technically confident than the digital natives the digital immigrants were more self-confident and better at knowledge application than the younger students, probably due to their greater experience of work and with knowledge transfer. A further move away from the digital native and their year of birth is by means of looking at the use of technology. The breadth of use of technology both in education and outside of education is investigated [5] ‘experience in using the Internet and breadth of use are good indicators of whether someone is a digital native or not’. This definition backs up that of others [6, 13] in that it is not just the breadth of technology used that should define the digital natives but their depth of use of the technology. By looking just at the age of an individual there are other relevant (and missing) aspects of the digital natives that needs to be taken into account, for instance, education, class, culture and gender. In a survey of Italian students [7] found that the impact of the education of the parents of the digital natives ‘could produce significant differences in the possession of digital skills’ , so looking to the definition of digital natives and their breadth of technology use and their upbringing. Work such as this demonstrates that it is not right to accept Prensky’s literal definition and that there are other aspects to take into consideration instead of classifying people as digital natives or digital immigrants based on when they were born. Some [14] see a change in attitude and a categorizing of generations based on their choices of music and fashion to the threat of technology as a means of classifying/categorizing a generation. The digital natives
could be seen within their own distinct era just as in past decades mods, punks and new romantics were identified by their own fashions and music.
There is some research that still sees the digital natives as an isolated generation much different than those that came before. [9] to some extent falls into this category, in that he looks to academic libraries having to change the way they provide services to a new generation of students. He does however take the view that all people born after a certain date fall into the category of digital natives and that libraries must change to meet the needs of this new generation, because technology is used in the social side of a young person’s life that it should also be available to them (and predicted to be used) in their education, for instance the development by ‘library management system vendors are now making to design in 2.0 features such as faceted search’. Others see the digital native/digital immigrant ideas of Prensky as a way education has to look forward and adapt to meet the differences in the digital native/immigrant debate for instance [8] where since students have grown up with technologies they are expecting to use these technologies in their education. Researchers who fall in the ‘Prensky impartial’ camp include [15,16] the latter accept the term digital natives and looked at the digital natives in the workplaces (as if they were born in 1980s they are now in or approaching their 30s) and found that they separated their social and workplace lives. Employees preferred to use social media not in the workplace, but in their social and private live, at work they preferred to use traditional internal communication channels such as employees meetings and e-mail newsletters rather than social media.
There have been several studies in recent years into the technology use of students in their private lives as compared to their academic lives, [4,17,18] all illustrating that there are indeed differences in use between the two.
This study looks to take this work a step further and compare this technological use at an international level.
3. Methodology
The survey employed a quantitative methodology approach; a questionnaire was given to students willing to participate in the survey. In Malaysia the questionnaire was distributed in class, in S. Korea and the UK students were invited to participate in the study by lecturers, and volunteers were emailed a copy of the questionnaire. The questionnaire was an adaptation of that of [4], see appendix one for a copy of the questionnaire.
will be evident. There is already some regionalism in the literature to suggest that this might be the case [6].
4. Discussion of Findings
When the questionnaires were analysed the majority of respondents were male, with only 26 females out of a total of 154 (less than 17%). This concurs with research into the gender differences on undergraduate computer science courses (for instance [19] where the figure of 20% is stated. Technologies used on their programmes of study are equal at a mean of 13 for Malaysia and the UK with South Korea at 14. This suggests that the teaching on these programmes is generally equal in the technologies employed by their educators – the digital immigrants.
Technologies used for their own learning were similar to that of the hardware technologies used by students in that Malaysia and South Korea had approximately the same with a mean of 10.6 and 10.7, but those employed by the UK students themselves was higher at 11.9.
Malaysian and Korean students used approximately the same number of hardware technologies, at an average of 3.4 and 3.1 respectively. Students from the UK used more technologies at a mean of 4.6.
For the hardware technologies used by students, not covered by the previous sections, again Malaysia and South Korean students used approximately the same at 8.0 and 8.4 respectively. The UK students however used fewer technologies at 7.3.
Hardware owned and used on a regular basis.
An average of 93% of students owned a mobile phone, but only 85% of Malaysian students owned the device (see table 3 which summarises the responses by country). There was a similar finding in ownership and use of portable media players with 67% of UK students using the technology, but only 20% of Malaysians. However the ownership of handheld computers was quite different with only 2% of South Korean students using this technology and the UK and Malaysia on 39% and 25% respectively. The biggest difference in technology ownership was found with that of games technologies 0% of S. Koreans possessed either portable or desktop games consoles compared to the UK where over 50% possessed a console.
Electronic tools used by students on their programmes of study
When students were asked about their use of electronic tools used on their programmes it was found that the most used tools were course websites with S. Korea at 100% usage, Malaysia at 98% and the UK at 90%. Only discussion groups used on courses also played an important part in student to all three sites with usage of over 70%.
Other popular technologies were mobile phones, but only by the UK (75%) the other sites of Malaysia and S. Korea only 35% and 37% respectively. Internet websites, Google
Scholar and Wikipedia are highly used as tools for use on courses. Several technologies fell into the 50% usage bracket (+/- 10%), chat, MP3, handheld computer. There are evidently differences in use of some technologies between universities and their students, for instance in the use of podcasts varied widely between the three centres, with 75% of students in the UK using this technology and only 35% and 37% respectively in Malaysia and S. Korea. A similar difference in the use of technology was found in use of MySpace with 41% of S. Korean student using this and only 20% and 13%in Malaysia and the UK. Weblog use too varied with only 37% of Malaysian students using blogs to 74% in the UK.
Technology used for students own learning in relation to their course but not provided by their University
These are the tools used by students in their studies but are not provided by their institution, so are not ‘pushed’ but are ‘pulled’ (chosen) by the students themselves to help in their studies. As in the previous section, the use of mobiles phones rated highly in all three sites as did the use of YouTube and Google Scholar. Several technologies rated low in all three countries in this category, MySpace, Second life and MP3 player were all less than 1/3 use in each University. There were several differences evident from the three sites, for instance blogs and message board use was significantly lower in Malaysia than in either South Korea or the UK.
Use of technology and software other than that detailed above
Several tools were used regularly at all three sites, music and photo upload, Social Networking; wikis were all above the 75% usage level. Several sites demonstrated a higher use than others, for instance blogging was not popular with Malaysian students, (21%) but more so in South Korea and the UK (54%). The use of chat rooms however in Malaysia was higher at 76% than in the other two Universities (both 46%). The biggest difference however was in technology use was found with internet gaming with 70% of S. Koreans using this software compared to only 47% (Malaysia) and 44% (UK).
5. Discussion
It is clear from the findings that there are differences in technology use between the three Universities. Some of these are as a result of the technologies used by their institutions, for example with the use of blogs, twice as many UK students used this than Malaysian students.
the latter two categories. MMORPG games are very popular in S. Korea so this may account for the differences [20].
There are some similarities that students find in common, the use of internet sites and Google Scholar, but also specific such as message boards provided by their University which seem to be used more frequently than in other countries. But electronic tools not pushed by University to help with students are seen as ‘pull’ as they are chosen/selected by the students themselves to aid their studies, so it could be that these are more important technologies to students than those provided by their institution. If they were equally as important as institution provided tools then their use should be the same. Perhaps equally significant is the use of student technologies other than those mentioned in connection to their studies. These are the ‘pull’ technologies whereby students use them in their everyday life, i.e. for recreational use. The use of music for instance is much higher for social/recreational use than in study (this should not come as a surprise as all three programmes were non music based), but it would be difficult to include a music element to computer science courses.
There are high levels of Youtube, Social Networking and the use of Wikipedia than there are in the educational use. It might be useful for supporters of Prensky to concentrate on the use of specific technologies selected by students to support their studies than to use shotgun approach and assume all technologies are used by all students, a regionalisation of users may be a better way to look at ‘Digital Natives’ perhaps by use of the term @Far Easter digital Natives, or ‘UK Digital Natives’ rather than just digital natives.
If Prensky was right then the students surveyed would all have the same (or largely so) results not dependent on where they were studying. The survey suggests that since this is not the case, especially with the students from the UK, then we
cannot accept that Prensky and his supporters are 100% correct. There are other influences on the digital natives that need to be taken into account, as some researchers have alluded to in the section on above and Prensky independent. [21] looked at Chinese students at an Australian University and their experiences with online learning. Conclusions drawn from this were that students “the students’ problems in acculturating to their online courses arose at least in part from a clash between their heritage and host educational cultures.” so there needs to be an understanding of where the student has been educated or it may be that educators are ‘pushing’ technology to students where there culture has not supported this type of technology use in the past.
This work therefore supports the researchers who look at independent factors, parent’s education, culture, regional preference for technology in the influence on the digital natives.
6. Conclusions
It is clear from the findings that there are differences in technology use in the three institutions studied. One of the aims of this work was to answer ‘do digital natives in 2012 exist as defined by Prensky?’ the answer from this research is that they do not, at least not in the global approach of treating all students as one type of digital native. The second question investigated was ‘is there a difference in use of technologies between digital natives of different nationalities?’ the answer to this is clearly yes, as students in different countries have different preferences for their use of hardware and software technologies. It is probably time to refine the term ‘digital native’ and replace it with a more coherent one of ‘digital tribes’ to take into account the differences between nationalities, pedagogy and the student in Higher Education.
Digital immigrants
Baby boomers,
Older boomers Generation X, young boomers
Digital natives, Generation Y, Net generation, Google generation,
millenials
Second generation Digital natives
[image:4.595.78.533.504.595.2]1945 – 1964 1965 – 1981 1982 - 1995 1996 – 2013
Table 1. Findings from the survey
Respond ent country
Number of responde
nts
Averag
e age Gender male: female
Average number of hardware technologies used
regularly
Average number of technologies used for their programmes
of study
Average number of technologies
used for own learning, but not provided by their
institution
Other technologies used, not already
included
Malaysia 57 21 54:3 3.4 13 10.6 8.0
South
Korea 56 24.9 49:7 3.1 14 10.7 8.4
United
Kingdom 41 22.5 25:16 4.6 13 11.9 7.3
Table 2. Percentage of students having Internet access in their place of residence
Malaysia South Korea UK
95 100 100
Percentage of students accessing the Internet on campus.
Malaysia South Korea UK
90 98 100
Table 3. Percentage of students owning and using on a regular basis
Malaysia Korea S. UK
Mobile phone 85 96 98
Portable Media Player (e.g. iPod, mp3 player) 20 40 67
Personal Computer (e.g. Mac, PC) 72 82 75
Handheld Computer (e.g. PDA, Blackberry, Palmtop) 25 1 39
Laptop computer 85 66 77
Games Console (e.g. Xbox, PlayStation, Nintendo) 23 0 52
Portable Games Console (e.g. Gameboy, SonyPSP) 16 0 16
Digital Camera 18 19 18
[image:5.595.80.530.81.237.2]Table 4. Percentage of students using electronic tools in their course
Malaysia S. Korea UK
Course website (e.g. lecture notes, activities,
PowerPoint slides, video clips) 98 100 90
Online Discussion Groups 76 73 72
Virtual/Real Time Chat Facility 65 77 49
Video Conferencing 48 46 29
Online Assessments (e.g. Multiple choice quizzes) 71 60 75
MP3 player 48 55 54
Digital Camera 41 57 33
Handheld Computer 57 49 54
Mobile Phone 86 93 88
Podcasts 35 37 75
Internet Websites 98 100 98
Google/Google Scholar 95 95 95
Wikipedia 95 98 80
Simulations, games 81 66 41
Message Boards 69 93 72
Text Messaging 79 91 82
MySpace 20 49 13
Weblog or Blog 37 66 74
YouTube 76 89 88
Other(s) 1 0 0
Table 5. Percentage of students using electronic tools NOT provided by their University to help them with their studies
Malaysia S. Korea UK
MySpace 11 24 3
Digital Camera 35 44 28
Networked PCs/Macs 72 78 59
Weblog or Blog 39 64 52
Message Boards 44 77 52
Mobile Phone 56 69 82
Second Life 32 31 20
Video/audio clips 79 82 62
Internet Websites 86 84 92
Podcasts 30 37 59
MP3 player 35 47 41
Wikipedia 74 73 66
Simulations, games 63 42 23
Handheld Computer 63 46 62
Text Messaging 67 82 85
Chat 70 66 72
YouTube 86 70 70
Google/Google Scholar 85 71 85
[image:6.595.137.467.451.749.2]Appendix 1
Survey Questionnaire
Section A – Your Personal Details
1. What is your gender? Male Female
2. How old are you? 3. Nationality 4. Home country
5. What is your programme of study? 6. Do you currently have Internet access in
your place of residence? Yes No
7. Do you access the Internet on campus, and if so where?
8. Which of the following do you own and use regularly (3 – 4 times per week)? (please tick as many as apply) Mobile Phone
Portable Media Player (e.g. iPod, mp3 player) Personal Computer (e.g. Mac, PC)
Handheld Computer (e.g. PDA, Blackberry, Palmtop)
Laptop computer
Games Console (e.g. Xbox, Playstation, Nintendo)
Portable Games Console (e.g. Gameboy, SonyPSP)
Digital Camera
Other(s) (please give details)
Section B – Use of Technology on Your Programme
This section concerns your use of technology on your modules for your chosen course of study. 9. Please indicate which electronic tools you use in your course and the extent to which you use them
daily weekly monthly never
Course website (e.g. lecture notes, activities, PowerPoint slides, video clips)
Online Discussion Groups Virtual/Real Time Chat Facility Video Conferencing
Online Assessments (e.g. Multiple choice quizzes) MP3 player
Digital Camera Handheld Computer Mobile Phone Podcasts Internet Websites Google/Google Scholar Wikipedia
MySpace Weblog or Blog YouTube
Other(s) (please give details)
Section C – Use of Technology for Your Own Learning communication in relation to your course (e.g. to talk to other students about coursework), but NOT tools provided by your university for the course
10. Please indicate which electronic tools NOT provided by the Universityyou use to help you with your studies (e.g. this may be other software or your own tools and devices.)
daily weekly monthly never
MySpace Digital Camera Networked PCs/Macs Weblog or Blog Message Boards Mobile Phone Second Life Video/audio clips Internet Websites Podcasts MP3 player Wikipedia Simulations, games Handheld Computer Text Messaging Chat
YouTube
Google/Google Scholar Other(s) (please give details)
Any tools you would like to use in your course?
Section D – Other Use of Technology/Software other than that detailed above
11. Please indicate the extent to which you use the following electronic tools, software, websites etc., but NOT in relation to your course or study (i.e. for recreational use), and which particular ones you use.
Music (e.g. iTunes, MP3, etc) Photo upload and sharing (e.g. Flickr) Video upload and sharing (e.g.YouTube) Blogging (e.g. Blogger, Myspace) Social Networking (e.g. Myspace, Bebo) File sharing (e.g. Napster, BitTorrent) Discussion groups (e.g. Google Groups, Yahoo) Chat Rooms
Wikis (e.g.Wikipedia)
Virtual Worlds (e.g. Second Life) Internet gaming
REFERENCES
[1] M. Prensky. Digital natives, digital immigrants: do they really think differently? On the Horizon, 9 (6), pp. 1-6. 2001 [2] S. Virkus. Use of Web 2.0 technologies in LIS education:
experiences at Tallin University, Estonia. Program: electronic library and information systems. Vol. 42 No 3 pp. 262 – 274. 2008
[3] N. Herther. Digital Natives and Immigrants What Brain Research tell us. ONLINE Nov/Dec 2009 pp. 15 – 21. 2009 [4] A. Margary, A. Littlejohn, G. Vojt. Are digital natives a myth
or reality? University students’ use of digital technologies. Computers & Education Vol.56 Issue 2 pp.429–440 (2011) [5] E. J. Helsper, R. Eynon. Digital natives: where is the evidence?
British Educational Research Journal. Vol. 36, No 3 June 2010 pp. 503 – 520. 2010
[6] A. Davis. The rise of the digital natives. Digital Media April 2008
[7] M. Gui, G. Argentin. Digital skills of internet natives: Different forms of digital literacy in a random sample of northern Italian high school students. New media and society, 13 (6) pp.963 – 980 2011
[8] A.J. Autry, Z. Berge. "Digital natives and digital immigrants: getting to know each other". Industrial and Commercial Training, Vol. 43 Issue: 7 pp. 460 – 466. 2011
[9] M. Robinso. Digital nature and digital nurture: libraries, learning and the digital native. Library Management Vol. 20 No 1/2 pp. 67 – 76. 2008
[10] S. Bennett, K. Maton, L. Kervin. The ‘digital natives‘debate: A critical review of the evidence. British Journal of Educational Technology. Vol. 39 No 5 pp. 775- 786. 2008 [11] C. Brown, L. Czerniewicz. Debunking the ‘digital native’:
beyond digital apartheid, towards digital democracy. Journal of Computer Assisted Learning 26 pp. 357 – 369. 2010
[12] Y. Li, M. Ranieri. Are ‘digital natives’ really digitally competent?—A study on Chinese teenagers.British Journal of Educational Technology Vol. 41 No 6 pp. 1029–1042. 2010 [13] S. Ransdell, B. Kent, S. Gaillard-Kenney J. Long. Digital
immigrants fare better than digital natives due to social reliance. British Journal of Educational Technology Vol. 42 No 6. 2011
[14] S. Brabazon, Z. Dear, G. Greene, A. Purdy. Why the Google Generation Will Not Speak: The Invention of Digital Natives. Nebula 6.1 March 2009
[15] P. Rawsthorne, E. Murphy. "Constructivism, Personal Computing Devices and the Internet will continue to have an Influence over Instructional Design." Available at http://www.rawsthorne.org/bit/medit/ed6620/ accessed 5 March 2013
[16] J. Friedl, A. T. Vercic. Media preferences of digital natives internal communication: A pilot study. Public Relations Review 37 pp. 84 – 86. 2011
[17] L. Corrin, S. Bennett, L. Lockyer, Digital natives: Everyday life versus academic study. Proceedings of the 7th International Conference on Networked Learning 2010 [18] M. Bullen, T. Morgan, A. Qayyum. Digital Learners in
Higher Education: Looking Beyond Stereotypes. In Bastiaens and Ebner (Eds). Proceedings of World Conference on educational Multimedia, Hypermedia and Telecommunications pp. 678 – 687. 2011
[19] S. Cheryan, A. Meltzoff, S.Kim. Classrooms matter: The design of virtual classrooms influences gender disparities in Computer Science classes. Computers & Education 57 (2011) pp. 1825–1835. 2011
[20] P. W. Kim, S.Y. Kim, M. Shim, C-H Im, Y-M Shon. The influence of an educational course on language expression andtreatment of gaming addiction for massive multiplayer onlinerole-playing game (MMORPG) players. Computers and Education Vol. 63, p208-217. 2013