Journal of Chemical and Pharmaceutical Research
ISSN No: 0975-7384 CODEN(USA): JCPRC5
J. Chem. Pharm. Res., 2011, 3(4):893-898
Simultaneous determination of paracetamol and mefenamic acid in
tablet dosage form by high performance liquid chromatography
Madhukar A. Badgujar* and Kiran V. Mangaonkar
Analytical Chemistry Research Laboratory, Mithibai College, Vile Parle (W), Mumbai, India
__________________________________________________________________
ABSTRACT
A simple, fast, precise, specific, accurate reversed phase high performance liquid chromatographic (HPLC) method was developed and validated for the simultaneous determination of Paracetamol (PC) and Mefenamic acid (MA) in tablets. The column used was Inertsil ODS 3V C18, 250 x 4.6mm, i.d. 5µm and a mobile phase composed of methanol: buffer (0.02MKH2PO4) (75:25), pH 7.1 adjusted with 0.1N NaOH. The flow time was set at 1.0mL/min.
Analysis was performed using UV detection at 275nm.. The retention times of PC and MA were found to be 2.88 mins and 4.49 mins respectively. Linearity was established for PC and MA in the range of 36-180 µg/mL and 40-200 µg/mL, respectively. Repeatability and intermediate precision were acceptable (RSD<2%). The percentage recoveries of PC and MA were found to be in the range of 98.32% to 100.78% and 98.15% to 99.02% respectively. The proposed method was validated and successfully used for estimation of paracetamol and mefenamic acid in the pharmaceutical dosage form
Keywords: Paracetamol (PC); Mefenamic acid (MA); RP-HPLC; Validation.
__________________________________________________________________
INTRODUCTION
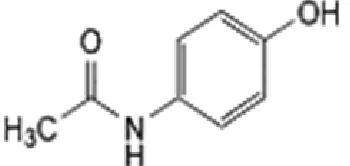
Fig 1A. Chemical structure of Paracetamol Fig 1B.Chemical structure of Mefenamic acid
Literature survey reveals that various analytical techniques viz, UV spectrophotometry[1-5] spectroflurometry[6], high performance liquid chromatography (HPLC)[7-13] and high performance thin layer chromatography (HPTLC)[14-15] were reported for the analysis of PC and MA in pharmaceuticals. Few HPLC methods have been reported for the simultaneous determination of PC and MA. Our aim was to develop proper method which estimates both the analytes in a shorter time and to develop low cost method. The present study describes an isocratic, reversed-phase HPLC method using ultraviolet detection for the determination of paracetamol and mefenamic acid from tablet dosage form.
EXPERIMENTAL SECTION
Chemicals and reagents:
Methanol HPLC grade was procured from Merck India Limited, Mumbai. Water HPLC grade was obtained from Merck Specialties Private Limited, Mumbai. Reference standards of Paracetamol and Mefenamic acid were procured from Blue Cross India Limited Nashik. Potassium dihydrogen phosphate buffer and sodium hydroxide was purchased from Merck India.
Standard stock preparation:
45mg of Paracetamol and 50 mg of Mefenamic acid was accurately weighed and transferred to a 50cm3 volumetric flask. It was dissolved in a minimum quantity of methanol and then diluted up to the mark with methanol. The concentration of the solution obtained was 900 µg/mL for Paracetamol and 1000 µg/mL for Mefenamic acid (Solution A). 5cm3 of this solution A was diluted to 50 cm3 in a volumetric flask with mobile phase. The concentration of the solution obtained was 90 µ g/mL & 100 µg/mL for Paracetamol and Mefenamic acid respectively.
Preparation of sample solution:
Twenty tablets (MFTEL FORTY, BLUE CROSS LABORATORIES LTD) were weighed and their average weight was calculated. These tablets were powdered and weight equivalent to one tablet containing 450mg of Paracetamol and 500 mg of Mefenamic acid was taken in a 100mL dilution flask. Then about 50mL of diluent was added to it and sonicated for 20-25 mins at an ambient temperature with intermittent swirling, cooled to room temperature and diluted upto the mark with diluent. Then solution from the flask was filtered through syringe filter.
Chromatographic Conditions:
performed on a 250 mm × 4.6 mm i.d., 5 µ particle size Inertsil ODS 3V C18 column. Mobile
phase consisted of a mixture of methanol : buffer (0.02MKH2PO4) (75:25), pH 7.1 adjusted
with 0.1N NaOH. Flow rate was kept at 1.0 mL/min. Wavelength was set at 275 nm.
Method Validation:
The method was validated as per ICH guidelines [16] for specificity, linearity, quantification limit, precision, accuracy, recovery, ruggedness and robustness. Specificity was investigated by analyzing the blank diluents and samples of 100% level for any interference of the endogenous material at the retention times of PC and MA.
The linearity of the method was tested by taking several aliquots of standard solutions of PC and MA in 50mL volumetric flask and diluted upto the mark with the mobile phase. The final concentration of PC and MA was 36-180 µ g/mL and 40-200 µg/mL respectively.
The accuracy of the method was determined by recovery experiments. A standard addition method was employed for this experiment. A known quantity of each drug substance (PC and MA) corresponding to 100%, 110%, 120% and 130% of the label claim of each drug was added. Each set of addition was repeated three times. The accuracy was expressed as a percentage of analytes recovered by the assay.
The precision of the method was demonstrated by interday and intraday variation studies, six repeated injections of standard and sample were made and percentage RSD was calculated. In the intra-day variation studies six repeated injections of standard and sample solution was carried out by injecting on the same day at different intervals and percentage RSD was calculated. In the interday variation studies six repeated injections of standard and sample solution were made for three consecutive days and percentage RSD was calculated.
The robustness of the method was checked by changing the chromatographic conditions. The organic phase of the mobile phase was varied by ±5% while pH of the buffer was varied by ±0.2 units. The three different sample solutions were injected in each varied condition and the assay was checked.
RESULTS AND DISCUSSION
Optimization of the chromatographic conditions
In order to develop an isocratic reverse phase HPLC method for the simultaneous determination of PC and MA in combined dosage form, the chromatographic conditions were optimized. For better separation and resolution the different buffers were tried. It has been found that potassium dihydrogen phosphate buffer, pH 7.1 adjusted with 0.1N NaOH gave better peak shape than other buffers. The different compositions of mobile phase were changed for getting better separation of these analytes. Thus the mobile phase composed of the mixture of methanol and buffer (0.02M potassium dihydrogen phosphate, pH 7.1 adjusted with 0.1N NaOH) in the ratio
Validation
The proposed method was shows short elution time and good separation between PC and MA. The system suitability test was performed as per the international conference of harmonization (ICH) [16] guidelines to confirm the suitability and the reproducibility of the method. Six consecutive injections of the standard solution were performed and evaluated for repeatability, tailing factor, theoretical plates and resolution. %RSD values were found to be 0.30 and 0.28 for PC and MA respectively. The tailing factor and theoretical plates were found to be within the limits.
The method was linear over the range 36-180 µg/mL and 40-200 µ g/mL for PC and MA respectively. The calibration curve was constructed by plotting response factor against concentration of drugs. The slope and intercept value for calibration curve was
Y = 2.43e+004 X + 1.93e+004 (r2= 0.9998) for PA and Y = 4.08e+004 X + 4.70e+003
(r2= 0.9998) for MA. The results show that an excellent correlation between response factor and concentration of drugs.
The developed method was validated for system precision (repeatability) and method precision. Six injections of mixed standards of 90 µ g/mL of PC and 100 µg/mL of MA were injected and %RSD calculated for injection repeatability. Six samples were prepared at 100% levels and assayed according to the procedure. The average assay of three replicate analysis was found to be 99.37% for PC and 98.38% for MA with a relative standard deviation of 0.48% and 0.52% respectively.
[image:4.595.56.519.545.661.2]The accuracy of the method was determined by the standard addition method at three different levels. The sample solution of 100% level was considered as a zero level and 10%, 20% and 30% of the standard drug of analytes were added respectively. Each determination was performed in triplicates. The accuracy was then calculated as the percentage of the standard drug recovered by the recovery study. Mean recoveries for PC and MA from the combination formulation are shown in Table 1 and Table 2 respectively. The results are well within the acceptance limit and hence the method is accurate.
Table 1: % Recovery of Paracetamol
Table 2 : % Recovery of Mefenamic acid
Amount of Mefenamic acid in ppm
Sr.No %
Added Original amount Added amount Total amount Mean (n = 5)
%
Recovery S.D %RSD 1 2 10 20 100 100 9.50 19.25 109.5 119.25 108.20 118.27 98.66 99.02 0.099 0.328 0.1011 0.332
3 30 100 29.65 129.65 127.39 98.15 0.103 0.105
Amount of Paracetamol in ppm
Sr.No % Added Original amount Added amount Total amount Mean
(n = 5) % Recovery S.D %RSD
1 2 10 20 90 90 9.08 18.15 99.08 108.15 99.87 107.37 100.78 99.33 0.882 0.148 0.875 0.149
The stability of both the standard and the sample was determined by monitoring the peak area responses of the standard solution and the sample solution of PC and MA at 2, 12 and 24 hours at room temperature. The results showed that there was no significant difference.
The robustness of the method was performed by deliberately changing the chromatographic conditions. The organic strength of the mobile phase was varied by ±5% while pH of the buffer was varied by ±0.2 units. The standard solution and three different sample preparations were injected in each varied condition and the assay was checked. Under all varied conditions, it has been found that the %RSD for the assay values for PC and MA were found to be well within the acceptance limit of 2%.
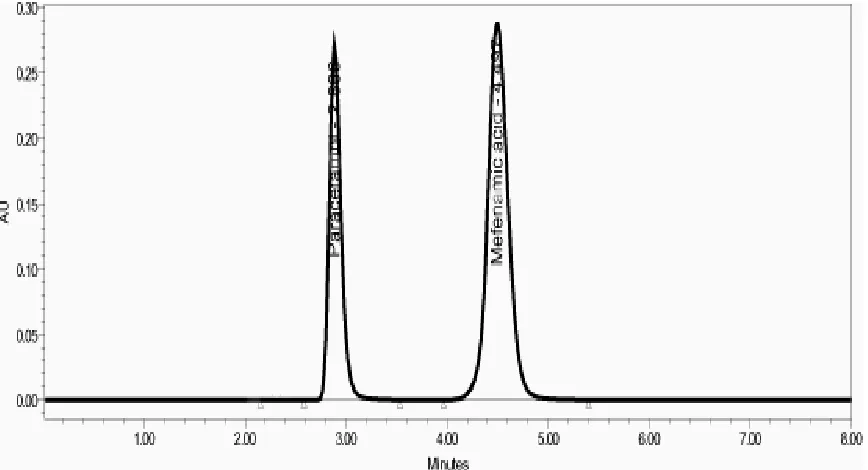
[image:5.595.70.504.292.527.2]The specificity of the method was checked by injecting a sample solution. No chromatographic interference was observed from endogenous material. The chromatogram of 100% sample solution of Paracetamol and Mefenamic acid is shown in fig 2.
Figure 2 In the optimized conditions Paracetamol has a Rt=2.88, Mefenamic acid has a Rt=4.49. The major peaks of Paracetamol and Mefenamic acid are well separated. There are no other potentially interfering
peaks at the retention time of the two drugs, thus showing the specificity of the method
Applications:
The validated stability indicating HPLC method was applied to the simultaneous determination of PC and MA in tablet dosage form. The samples were analysed and the assay results are as per the label claim shown in Table3
Table 3. Analysis of formulation: Meftel forty (Label Claim: Paracetamol 450mg + Mefenamic acid 500 mg)
Drug Std wt (mg)
Avg. wt g
Label Claim (mg)
Mean Std area
Mean Sample
area
Amount
Present % Assay Paracetamol 450mg
1.116
450mg 2217857 2190845 444.92 mg 98.87% Mefenamic
acid 500mg 500mg 4058172 4011163 494.65 mg 98.93%
[image:5.595.53.514.679.752.2]CONCLUSION
The isocratic RP- HPLC method has proved to be simple, specific, precise and accurate and is suitable for simultaneous quantification of Paracetamol (PC) and Mefenamic acid (MA). The proposed method gives a good resolution among these analytes. High percentage of recovery shows that the method is accurate.
Acknowledgement
The authors are thankful to Department of Chemistry, Mithibai College, Mumbai, India for their support.
REFERENCES
[1] Satyanarayana; Dondeti; Kannan; Kamarajan; Manavalan; Rajappan, Journal of the Serbian
Chemical Society (2006), 71(11), 1207-1218.
[2] Dinc; Erdal; Yucesoy; Cem; Onur, Feyyaz, J.Pharma Biomed Anal (2002), 28(6), 1091-1100.
[3] Thai; Duy Thin; Nguyen; Tuong Vy; Tran, Viet Hung. Tap Chi Duoc Hoc (2006), 46(2), 27-31.
[4] Gangwal; Shrenik; A. K. Sharma, Indian J. Pharma Sci. (1996), 58(5), 216-218.
[5] Das, Sukomal; Sharma; C Suresh; Talwar; K Santosh; P. D Sethi, Analyst (Cambridge,
United Kingdom) (1989), 114(1), 101-3.
[6] Madrakian; Tayyebeh; Afkhami; Abbas; Mohammadnejad; Masoumeh; Analytica Chimica
Acta (2009), 645(1-2), 25-29.
[7] Hung; Chin-Yin; Hwang; Ching-Chiang, J. Chroma. Sci. (2008), 46(9), 813-818.
[8] Jaiswal; Yogini; Talele; Gokul; Surana; Sanjay, Journal of Liquid Chromatography &
Related Technologies (2007), 30(8), 1115-1124.
[9] E. Mikami; T Goto; T. Ohno; H Matsumoto; K Inagaki; H.Ishihara; M.Nishida, J.
Chromatogr B: Biomed Sci and Applications (2000), 744(1), 81-89.
[10] Rau; L. Harish; A. R Aroor; Rao; P Gundu, Indian Drugs (1991), 28(12), 563-5.
[11]Madhukar.A; V. Sudhirkumar;P.Anand; C.H Samrat, J.Chem. Pharma. Res. (2011), 3(3), 464-469
[12] D.K.Mandloi, P.K.Tyagi, V.K.Rai, S. Dey, R.K Ashada and P.Mohanraj J.Chem. Pharma.
Res. (2009),1(1), 286-296
[13] S. R. Pattan, S. G. Jamdar, R. K. Godge, N. S. Dighe, A.V. Daithankar, S. A. Nirmal and M.G.Pai , J. Chem. Pharma. Res. (2009),1(1), 329-335
[14] Maliye; N Amit; Walode; G Sanjay; Kasture; V Avinash; Wadodkar; G Sudhir, Asian J
Chemistry (2005), 18(1), 667-672.
[15] A.P.Argekar; J G Sawant, Journal of Planar Chromatography— Modern TLC(1999), 12(5), 361-364.
[16] ICH Q2A, Text on validation of analytical procedures, International Conference on Harmonization tripartite guidelines, adapted 27 Oct 1994B