Journal of Chemical and Pharmaceutical Research, 2013, 5(9):434-438
Research Article
CODEN(USA) : JCPRC5
ISSN : 0975-7384
Improvement and application of modular process risk modeling method for
microbial risk assessment
1,2
Limei Liu,
2Yongchao Gao and
2Yongchun Wang
1
Department of Control Science and Engineering, Shandong University, Jinan, China
2
Shandong Institute of Standardization, Jinan, China
__________________________________________________________________________________________
ABSTRACT
In the food production, operating environment, personnel, equipment and many other factors may introduce microbiological hazards into food, which makes consumers face health and safety risk. Effective implementation of risk management is essential to ensure food safety. In order to search, assess, prevent and control of varieties of risk factors, modular process risk modeling method is improved by adding hazard transfer process and control process. In the improved method, risk factors are abstracted as hazard transfer process. Control process characterizes the control measure on risk factors. Bayesian belief network is used as the model structure. Combined with predictive microbiology, the number and emergence probability of a microbial hazard in each process of food production is estimated using Bayesian inference. Simulation results show that the improved method can assess microbial risk in processing, and also may assess the impact degree of risk factors on the food product safety, trace the origin of microbial hazard, and help to choose preferred control measures.
Keywords: microbial risk assessment; modular modeling; Bayesian Belief Network; predictive microbiology __________________________________________________________________________________________
INTRODUCTION
Risk analysis includes four parts, risk identification, risk assessment, risk communication and risk management [2]. Identification and assessment of the risk is the basis of risk management. The mainly modeling techniques for quantitative risk assessment of microbiological hazards in food are simulation and modular modeling, Mcnab et al. [5] proposed microbiological risk assessment model by Monte Carlo (Monte Carlo, MC) simulation. Marks et al. [6] integrated the kinetics of microbial growth into microbiological risk assessment, which greatly promoted quantitative microbiological risk assessment. Currently, Monte Carlo model of quantitative risk assessment can be realized by risk analysis software @RISK [8] However, the MC model parameters (e.g. contamination, the frequency of consumption, growth rate and storage time) are described by the distribution in the numerical range. So for different microbial hazards and different production or processing, the model need to be established relying on the available parameters data without modular structure.
______________________________________________________________________________
modular process risk model enable different factors in the decision-making process included in the model, so that we can easily shift from risk assessment to food safety decision analysis.
But risk factors, such as raw material sources, sanitation, personnel, equipment, and others are not integrated into the modular process risk model, thus the model can only assess the current risk profile. This paper abstracts various risk factors that will introduce microbiological hazards into food as a hazardous transfer process, and designs a control process. BBN is used to realize the improved risk model, which can access the risk and the impact of risk factors on food safety, under the same risk model structure. And hazard traceability and preferable risk control measures may be carried out on the model, which provides a basis and ways for risk management.
MODULAR PROCESS RISK MODELING IMPROVEMENT
MPRM basic processes: There are three kinds of basic processes that describe microbiological risk path including microbial dynamics, material handling, cross contamination [7,9,10].
Dynamic process describes microbial growth, inactivation and removal, and can be mathematically described aslog(Nj)log(Nj1)fj. And fjis the kinetic model of a microbial, such as vacuum meat primary microbial
growth model 0 ( )
t
t N e
N , in which N0is the present number of the microbial, Ntis the number of Nt after
the time of t, is the lag phase of microbial growth, is the growth rate of the microbial [4].
Material handling process, including mixing and partitioning, describes the quantity changes of the microbial due to the changes of material source and quantity. Material mixing process describes the sum distribution of nkinds of
sources of raw materials in the jprocessing, which is may be expressed by the formula
n
i i j
j N
N
1 ,
1 . Partitioning
process describes that the microbial quantity in a product is divided into
n
partsNj,1,,Nj,naccording to theproduct partitioning in the joperation step.
Cross-contamination is direct or indirect transmission of cells from one product to one or many others. Let Wj,kbe
the number of microbial in the production environment (such as a machine, hands) after processing productkduring stage j, jthe fraction of microbial that is transferred from the product to the environment, andjthe fraction of
microbial that is transferred from the environment to the product during stage j . By recursive equationsNj,k (1j)Nj1,k jWj,k1 andWj,k jNj1,k(1j)Wj,k1, numbers of microbial on a product to
numbers of microbial on a subsequently processed product can be linked.
Hazard transfer process: Food safety risk factors include sources of raw materials, storage risk, operational personnel hygiene, and environmental contamination risks [3]. Hazard transfer process describes the contamination frequency and the probability distribution of microbial quantity that introduced into a product by environment, operating personnel, equipment and other kinds of risk factors, which is mathematically described asif(0,0,P). If risk does not exist, the amount of microbial is zero. If risk exists, the probability distribution of microbial number isPwhich can be discrete or continuous distribution. The proportion that transferred to a product can be described by function g() which is related with operating time, temperature, contact area and etc.
Control process: Control process describes varieties of control measures may be taken in the production, such as the use of different disinfection, the implementation of different test frequencies. The prevention and control impact of a measure is described by the probability and quantity change of microbial introduced by risk factor in the model. Process risk modeling and analysis steps: The steps of realizing a modular process risk model by Bayesian network are as follows.
Step 1: Make processes, materials mixing and partitioning, and processing parameters clear, find out risk factors that may introduce microbial into a product and affect the microbial dynamics.
Step 2: Select the appropriate basic processes, and determine the Bayesian network structure of risk model.
Step 3: Collect risk data, and determine the conditional probability of each node in the model by statistical analysis of risk data.
______________________________________________________________________________
The risk model created using the above steps 1-3, can be used to assess the risk situation and the impact of risk factors on food safety, and also can trace the source of microbial hazards. By step 4, the effectiveness of one or several control measures can be verified.
SIMULATION AND ANALYSIS
Take Salmonella in round ham processing as an example. A simplified production process risk model by Bayesian network is established to verify the usefulness of the improved modeling method for risk management. Round ham processing steps include raw materials receiving, thawing, adding accessories, tumbling, filling, cooking, drying, packing, warehousing. Theoretically, salmonella can be completely killed at steaming temperature, but the product may still be secondary contaminated due to package or environment. Round ham production process and process risk model after cooking is shown in Fig.1.
A simplified process risk model (Fig.2) is established using BayesiaLab simulation software [1] in accordance with Fig.1. In this model, a hazard transfer process is divided into three nodes. One node represents the probability that bacterium is transferred into a product because of the risk factor, and the other two nodes indicate the quantity of bacterium transferred. The basic risk model (Fig.2 (a)) is composed of nine Bayesian nodes.
Fig.1 Basic model that describe the transmission of Salmonella along Fig.2 Simplified process risk model for round ham processing the processing pathway
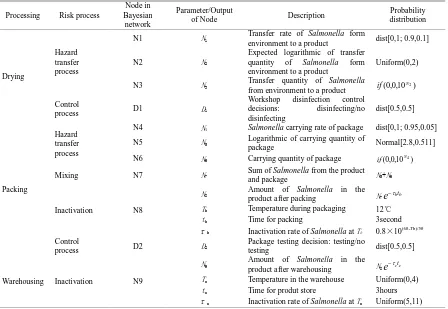
The environment (N1, N2, N3) and package (N4, N5, N6) risk factors, and the inactivation impact of the temperature during packing and warehousing for Salmonella are considered. Fig.2 (b) shows the model that control nodes are added to manage risk factors. Variables, parameters, and probability distributions of each node in the process risk model are shown in Table 1.
Risk Assessment: According to Table 1, given the initial and conditional probability of independent nodes in the risk model, the risk assessment of current production status can be got through Bayesian inference. Fig.3 shows the possible number and probability of Salmonella in each ham product under conditions that the transfer rate of
Salmonella form environment to a product N1 is 10% and Salmonella carrying rate of package N4 is 5%.
Assess the impacting degree of risk factors: By changing the probability and amount of Salmonella introduced by various risk factors, we may assess to what extent a risk factor influences the product safety, and put forward effective proposals for controlling critical risk.
Change the probability distribution of node N1 and node N4, for example change variables N1 and N4 withan
increase 10%. In both cases, the probability distribution of node N9 is shown in Fig.4 (a) and (b). It can be seen that variables N4 (package safety risk) increases the probability of N9 with 16.11% (1%-83.89% = 16.11%), which is
(a)Basic risk model
(b)Risk model added Control processes
Output:contamination rate and Salmonella
quantity in a product (each section) drying
packing
warehousing
N2: Expected logarithmic of transfer
quantity of Salmonella form environment to a product
N3:Ttransfer quantity of Salmonella
from environment to a product
N7: Mixing
N6: Carrying quantity
of packing material
N8: Inactivation
N4: Salmonella carrying
rate of package N1: Transfer rate of Salmonella
form environment to a product
N5: Logarithmic ofcarrying
quantity of packing material
N9: Inactivation
Product after
______________________________________________________________________________
larger than 15.69% (1%-84.31% =15.69%) that of resulted by variables N1 (environmental risk). Therefore, the
[image:4.595.85.533.124.433.2]safety of package needs more concern.
Table 1: Table of nodes/variables/probability distribution
Processing Risk process
Node in Bayesian
network
Parameter/Output
of Node Description
Probability distribution
Drying
Hazard transfer process
N1 N1
Transfer rate of Salmonella form
environment to a product dist[0,1; 0.9,0.1]
N2 N2
Expected logarithmic of transfer quantity of Salmonella form environment to a product
Uniform(0,2)
N3 N3 Transfer quantity of Salmonella
from environment to a product (0,0,10 )
2
N
if
Control
process D1 D1
Workshop disinfection control decisions: disinfecting/no disinfecting
dist[0.5,0.5]
Packing
Hazard transfer process
N4 N4 Salmonella carrying rate of package dist[0,1; 0.95,0.05]
N5 N5 Logarithmic of carrying quantity of
package Normal[2.8,0.511] N6 N6 Carrying quantity of package if(0,0,10N4)
Mixing N7 N7 Sum of Salmonella from the product
and package N5+N6
Inactivation N8
N8 Amount of Salmonella in the
product after packing N7ebtb
Tb Temperature during packaging 12℃
tb Time for packing 3second
b Inactivation rate of Salmonella atTb 0.8×10(60-Tb)/50
Control
process D2 D2
Package testing decision: testing/no
testing dist[0.5,0.5]
Warehousing Inactivation N9
N9 Amount of Salmonella in the
product after warehousing N8ectc
Tc Temperature in the warehouse Uniform(0,4)
tc Time for produt store 3hours
c Inactivation rate of Salmonella at Tc Uniform(5,11)
Hazard traceability: Bayesian network can combine the conditional probability of nodes with the observed events, sources, and priori knowledge of variables to calculate the posterior reliability of pollution sources. Thus risk assessment is converted into bio-trace, which can locate the step where microbial hazard is introduced, or in which step the failure of control measures causes microbial growth.
If at node N9 the number of Salmonella in a product is detected and given as a fact in the risk model (Fig.5, the maximum probability of N9). After Bayesian backward reasoning done, as can be seen from Fig.5, the prior probability of variable N4 which is equal to 1(representing bacterium is introduced into a product) increases from 5% to 100%, while that of N1 decreases from 10% to 1.78%. This means the package is the risk factor that introduces Salmonella into products, which results Salmonella is detected in products in the subsequent processing steps.
Fig.3 The number and emergence probability of Salmonella Fig.4 Compare of Salmonella impact on food safety between that introduced by environment and package N9 in each pitch circle ham
Effect validation of control measures: If the effect of risk control measures is tested on actual production lines, it will spend a great cost, and even affects the normal production. Moreover, testing will be influenced by many unpredictable factors. So it is hard to measure the effect. Verifying the effect of control measures by simulation will greatly improve the visibility and efficiency of decision-making and reduce costs.
[image:4.595.90.536.579.676.2]______________________________________________________________________________
Two control processes D1 and D2 are added in the basic risk model (Fig.2 (b)). D1 represents workshop environmental disinfection, and its effect can reduce N1 (environmental risk) to 1%. D2 represents package testing
before production, and its effect can reduce N4 (package safety risk) to zero. Control impact of the two measures on
the number of Salmonella in a product is shown in Fig.6. Control measure D1 reduces the risk to 2.37% (N9:1-97.63%=2.37%), and it is better than that of D2 3.51% (N9:1-96.49% = 3.51%) is. If the two control measures
simultaneously are carried out, the risk of Salmonella in a productcan be reduced to 0.64% (N9:1-99.36% = 0.64%).
Fig.5 Traceability of process in which Salmonella is introduced
Fig.6 Compare of effects of different control measures
CONCLUSION
By adding hazard transfer process and control process, food safety process risk modeling method is improved. Hazard transfer process considers various risk factors such as original materials, environment, equipment, operations, personnel hygiene and etc. A simplified production process risk model of round ham is established in Bayesian networks. Simulation results show that the risk model can realize food safety risk assessment, and also provide basis and ways for managers of enterprises to search, assess, prevent and control various risk factors in the food production, and effectively implement risk management.
Acknowledgement
National High Technology Research and Development Program (863 Program)(2011AA100702); Special Project of Public Welfare Industry Research in Quality Supervision, Inspection and Quarantine(201310147); National Science and Technology Support Program(2012BAF11B06)
REFERENCES
[1]Bayesia SAS, 2013. BayesiaLab. http://www.bayesia.com/en/prodducts/bayesialab.php
[2]CAC, 1999. CAC/GL 30-1999 Principles and guidelines for the conduct of microbiological risk assessment. [3]Department of Agriculture, U.S., 2013. Safety risk factors. http://psbweb.co.kern.ca.us/EH_Internet/ pdfs/Food/foodSafeHandling/CDCRiskFactors14.pdf
[4]Donald, K. M. and D.W. Su., 1999. International Journal of Food Microbiology, 52: 1-29. [5]Mcnab W. B., 1998. Journal of Food Protection, 61: 1216-1228.
[6]Marks H.M., M.E. Coleman and C.T.J. Lin et al., 1998. Risk Analysis, 18: 309-328.
[7]Nauta, M. J., 2000. Modeling bacterial growth in quantitative microbiological risk assessment: Is it possible predictive modelling in foods - conference proceedings. Belgium: KULeuven/BioTeC.
[8]Palisade Corporation, 2013. @ RISK. http://www.palisade.com/risk/