Determination of the Stability Studies of the Sudanese
Camel Insulin
Abdella Imam Abdella Baragob1, Waleed Hassan AlMalki1, Imran Shahid1*, Hanouf Saeed Bafhaid1, Fatimah Abdullah Bakhdhar1, Salwa Muhamed Khojali2, Samia Abdella2
1Department of Pharmacology and Toxicology, College of Pharmacy, Umm Al Qura University, Makkah, The kingdom of Saudi
Arabia; 2Faculty of Pharmacy, Khartoum University, Khartoum, Sudan.
Email: [email protected], [email protected], *[email protected], [email protected], [email protected],
[email protected], [email protected]
Received August 9th, 2013, revised September 12th, 2013; accepted September 28th, 2013
Copyright © 2013 Abdella Imam AbdellaBaragob et al. This is an open access article distributed under the Creative Commons
Attribu-tion License, which permits unrestricted use, distribuAttribu-tion, and reproducAttribu-tion in any medium, provided the original work is properly cited.
ABSTRACT
The main objective of the presented study was to characterize the stability of the Sudanese camel insulin after 6 months of its extraction, purification and formulation from the fresh pancreatic glands of the camel, slaughtered for local and export consumption. The stability and purity of the formulated insulin samples were compared to standard insulin sam-ples that of the leading manufacturing companies using some analytical techniques such as HPLC, gel electrophoresis and atomic absorption. In another part of the study, the direct transfer method was used to accomplish sterility test by complete immersion of the insulin samples into thioglycollate and soybean medium. The data were presented as mean ± S.E.M (standard error of means) for the comparison of zinc (mg/units) and nitrogen (in percentage) concentrations in standard and testing camel insulin samples, respectively. Similarly, the linear equation was derived and the coefficient factors for standard and testing insulin samples were compared to determine the peak area and the concentrations of the camel insulin samples (mean ± S.E.M) after HPLC elution. The P value, P < 0.005, was considered statistically signifi-cant. The stability study tests of the insulin samples (zinc and nitrogen contents, sterility, purity and potency test) reflect clearly their equivalence to standard insulin formulations in terms of stability. The results revealed that the stability of the various insulin samples from the camel insulin is not less than 25% of the time remaining until the preparations ex-pire or six months earlier than the expiration date when compared to standard insulin samples.
Keywords: Analytical Techniques; Camel Insulin; Stability Studies; Shelf Life
1. Introduction
Stability is defined as the extent to which a product retains, within specified limits, and through its period of storage and use (i.e., its shelf-life), the same properties and characteristics that it possessed at the time of its manufacture [1]. There are at least five acceptable levels of stability for any dosage form to be evaluated before use [2]. First, Chemical stability which refers to the conditions maintained throughout the shelf life of the drug product and each active ingredient retains its che- mical integrity and labeled potency within the specified limits. Second, physical stability describes the original physical properties including appearance, palatability, uniformity, dissolution and suspended ability. Third, microbiological stability which relates the effectiveness
factor affecting deterioration of insulin either upon pro- longed standing at room temperature or upon subjection to a heat test [5]. The presented study describes an effort to determine the stability studies of unknown extracted, purified and formulated camel insulin preparations while comparing with standard insulin preparations.
2. Materials and Methods
2.1. Materials
All the chemicals and reagents used in the stability study of insulin samples were of pharmaceutical and analytical grades and the standard solutions, dilutions of the samples were prepared according to the reference book procedures.
2.2. The Camel Insulin
The provision of monograph of this study applies to the following camel insulin samples and these samples were prepared in the laboratory according to the standard procedures as mentioned in the reference books [6]. 1) Soluble zinc insulin (soluble),
2) Insulin zinc suspension (amorphous), 3) Insulin zinc suspension (crystalline), 4) Insulin zinc suspension (mixed),
Vials of different insulin formulations (standard and samples) were stored in a refrigerator at 4˚C and the entire quality control tests were performed after 6 months. We selected two subsample preparations named as “E” and “D” from each type of testing camel insulin prepara- tions (i.e., soluble, amorphous, crystalline and mixed).
2.3. Methods
The following quality control tests were performed to determine the stability of the extracted, purified and for- mulated camel insulin samples.
2.3.1. Heat Test
The main objective of the heat test is to ensure that all insulin preparations for stability under severe conditions. For this purpose, the standard and prepared insulin samples were subjected to heat test. The samples were put in a glass container and exposed to a temperature at 50˚C - 55˚C and relative humidity of 75% for 10 days. The potency of the heated material was then compared either with a standard insulin or with a sample of the same preparation not exposed to the heat test. The samples were removed from the incubator once every day and made up to the proper dilution suitable for assay and kept in the refrigerator [7].
2.3.2. Determination of Zinc Contents
The zinc contents of the standard and testing insulin samples were determined by weighing 0.1 mg of each
sample and dissolved in 1 ml HCl (0.01 N solution) and read at 213 nm using a hollow cathode lamp as a source of radiation (atomic absorption). For camel insulin, we selected two insulin samples each weighing 0.1 mg of soluble (D,E), crystalline (D,E) amorphous (D, E) and mixed camel insulin (D,E) respectively [8].
2.3.3. Determination of Nitrogen Content
The nitrogen content of the standard and sample insulin samples were determined by weighing the samples and dissolved in 10ml of sulfuric acid with 11g of catalyst for the process of digestion, then distilled with 15 - 20 ml of Sodium Hydroxide (40%), collected with a basic solution and titrated against HC1 (40.0%). For camel insulin, we selected two insulin samples each weighing 0.016 mg and 0.02 mg of soluble (D), crystalline (D) amorphous (D) and mixed camel insulin (D) respectively. Similarly, two insulin samples each weighing 0.016 mg and 0.02 mg were selected from soluble (E), crystalline (E) amorphous (E) and mixed camel insulin (E) was selected to determine their nitrogen contents[9].
3. Study of Purity of Samples by
Electrophoresis
The purity of insulin samples was determined by gel electrophoresis. For this purpose we used Sebia® protein electrophoresis apparatus (Sebia™ cooperation, USA) and procedure was followed according to the manufacturer’s protocol. The standard and camel insulin samples ran from the similar migration time showed a single band indicating a pure insulin sample without other protein im- purities. The serum was used as a negative control [10].
3.1. Sterility Test
The sterility test of the camel insulins samples was per- formed in thioglycollate and the soybean medium by using the direct transfer method to check the microbial growth in the samples [11].
3.2. Thioglycollate Medium Test
Eight samples of thioglycollate medium each weighing 1.5mg were dissolved in 50ml of distilled water, gently heated and sterilized in an autoclave. Cooled the media after sterilization and added 5 ml of each four camel insulin samples taken from soluble D,E, crystalline D,E, amorphous D,E and mixed insulin D,E respectively, thoroughly mixed and incubated at 30˚C - 35˚C for overnight. Next day observed the samples for microbial growth in the media.
3.3. Soybean Medium Test
were dissolved in 50 ml of distilled water, gently heated and sterilized in an autoclave. Cooled the media after sterilization and added 5 ml of each eight camel insulin samples taken from soluble D, E, crystalline D, E, amor- phous D, E and mixed insulin D, E respectively, tho- roughly mixed and incubated at 20˚C - 25˚C for over- night. Next day observed the samples for microbial grow- th in the media.
3.4. Potency Test of Insulin Carried out by HPLC
The standard and camel insulin samples with concen- trations of 0.1 mg/ml, were used for insulin concentration and potency test by HPLC method [12]. The lyophilized material was dissolved in 0.2 M ammonium phosphate, pH 4.0, and 250 μl were applied to a reversed phase HPLC column. An aliquot was directly counted to esti- mate the recoveries, The HPLC separations were per- formed with a Beckman model 332 liquid chromato- graph equipped with a model 210 injector fitted with a 250-μl loop. The column used was a DuPont Zorbax C-8 (4.6 mm × 25 cm; 6-μm particle diameter) maintained at 40˚C by a Bioanalytical Systems LC-22A temperature controller. Insulin was eluted from the column with a 0.2-M ammonium phosphate (pH 4.0)/acetonitrile sol- vent system similar to that described previously and read with run time of 10 - 15 minutes. The peak area and capacity factors were calculated by the HPLC reading. The concentration of insulin by the HPLC method was reported as mean [13].
4. Discussion
Before the marketing and use of any insulin lot, its po- tency and stability must meet certain criteria and require- ments. As it is an established fact that the labile drugs and vaccines if not stored under controlled conditions, may lose its potency and stability. Stability is arbitrarily determined by subjecting a sample of insulin to a heat test. Insulin thus treated loses some of its physiologic activities but if there is a considerable loss e.g., 15% or more, then such a preparation is not considered suitable for general use. Similarly, traces of certain metals, parti- cularly zinc, copper, nitrogen and iron were found in some unstable insulin preparations; and it was therefore assumed that the presence of these metals be a factor affecting deterioration either upon prolonged standing at room temperature or upon subjection to a heat test. The deterioration of insulin upon standing and stored for a long time is a problem of considerable importance not only to the manufacturer but to the physician and in particular for the patients. In the presented study we analyzed different insulin samples, extracted, purified and prepared from Sudanese camel insulin for the
stability, low in its ash content (free of such metals as zinc, nitrogen) and particularly for sterility and potency test after six months of their storage.
It is apparent from the results for the zinc contents of the testing and standard insulin preparations as shown in
Table 1 that the zinc contents are not more than the
amount stated in the individual monograph, as deter- mined by atomic absorption spectrometry. Furthermore, the comparison of zinc concentrations of standard and testing insulin samples in Figure 1 showed that these
figures are in compliance with Melville et al., [7] which demonstrated that the addition of 1mg of zinc per 1000 units neither increases the efficiency nor tends to prolong the duration of the hypoglycemic action of insulin on the blood sugar of normal fasting rabbits. Similarly, the nitrogen contents of the testing insulin meet the certain criteria as mentioned in the individual monograph and there is no considerable difference in percent nitrogen contents when compared to standard insulin preparations as shown in Table 2 and Figure 2.Protein gel electro-
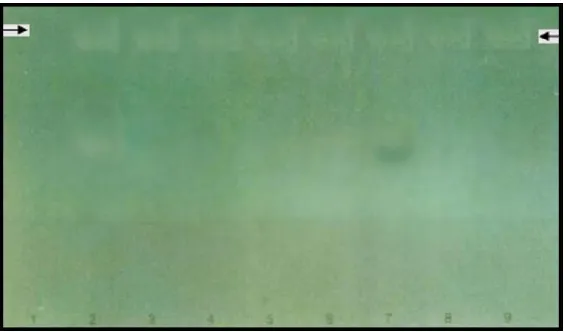
phoresis is a reliable and an authentication method to determine the purity of protein samples. We used hydro- foil electrophoresis ( Sebia™ cooperation, USA) to deter- mine and compare the purity of testing insulin samples with standard insulins according to the manufacturer protocol as shown in Figure 3. The results of the gel
electrophoresis demonstrated clearly that the standard and sample insulin ran at the same migration time and appeared only as one band which indicated that the re- sulting samples were pure insulin samples, although the gel bands of camel insulin samples were slight weaker compared to standard insulin samples which might an indication that the samples had lost a little insulin po- tency. The concentration of the insulin samples further analyzed by HPLC method confirmed the results of gel electrophoresis. Microbial contamination is also a po- tential risk factor for the insulin and labile drug pre- parations and we confirmed that the testing insulin sam- ples are free of any contamination by sterility test. The thioglycollate and soybean media showed no microbial growth in the testing insulin samples after 24 hrs incu- bation period as shown in Table 3.
The concentration of standard insulin preparations and testing camel insulin samples is shown in Tables 4 and 5
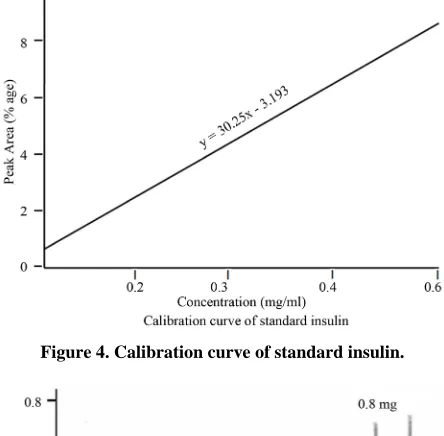
respectively. Figure 4,showed the calibration curve and
corresponding linear equation relationship among different standard insulin samples. Figure 5, represented
Figure 1. Comparison of zinc concentration between standard and testing camel insulin samples by atomic absorption method. The data were presented as mean ± S.E.M. The P value, P < 0.005, was considered statistically significant.
Figure 2. Nitrogen contents of standard and testing camel insulin Samples determined by acid base titration method. The data were presented as mean ± S.E.M. The P value, P < 0.005, was considered statistically significant.
[image:4.595.156.439.519.685.2]Table 1. Zinc contents of standard and camel insulin samples. Standard insulin Samples Weight (mg) Zinc (mg/100 unit) Camel insulin samples Weight (mg) Zinc (mg/100 unit) Soluble Crystalline Amorphous Mixed 0.1 0.1 0.1 0.1 0.024 0.004 0.016 0.019 Soluble (D) Soluble (E) Crystalline (D) Crystalline (E) Amorphous (D) Amorphous (E) Mixed (D) Mixed (E) 0.1 0.1 0.1 0.1 0.1 0.1 0.1 0.1 0.004 0.016 0.020 0.024 0.016 0.018 0.004 0.010
Table 2. Nitrogen contents of standard and testing camel insulin samples.
[image:5.595.63.539.417.547.2]Standard Insulin Samples Weight (mg) Titration volume (ml) Nitrogen (%age) Camel Insulin Samples Weight (mg) Titration Volume (ml) Nitrogen (%age) Soluble (D) Crystalline (D) Amorphous (D) Mixed (D) Soluble (E) Crystalline (E) Amorphous (E) Mixed (E) 0.016 0.016 0.016 0.016 0.02 0.02 0.02 0.02 0.6 0.58 0.70 0.72 0.60 0.63 0.71 0.73 1.050 1.015 0.980 1.015 1.050 1.020 0.990 1.015 Soluble (D) Crystalline (D) Amorphous (D) Mixed (D) Soluble (E) Crystalline (E) Amorphous (E) Mixed (E) 0.016 0.016 0.016 0.016 0.02 0.02 0.02 0.02 0.56 0.60 0.68 0.55 0.71 0.58 0.54 0.65 0.95 1.05 0.95 1.01 0.99 1.05 0.95 0.99
Table 3. Sterility test results of different camel insulin samples.
Thioglycollate medium Soybean medium
Camel insulin Samples
(Microbial growth) (Microbial Growth)
Soluble (D) Crystalline (D) Amorphous (D) Mixed (D) Soluble (E) Crystalline (E) Amorphous (E) Mixed (E) No growth No growth No growth No growth No growth No growth No growth No growth No growth No growth No growth No growth No growth No growth No growth No growth
Table 4. Insulin concentration in standard samples.
Samples Conc. (mg/ml) Area (%) C.F (Coefficient factor) Units (IU/ml)
1 2 3 4 Soluble Crystalline Amorphous Mixed 0.1 0.2 0.3 0.4 1.057 2.527 4.807 8.117 0.0946073 0.0791145 0.0624029 0.0492792 2.2 2.2 2.2 2.2
Table 5. Insulin concentration in different camel insulin samples.
Samples Conc. (mg/ml) Area (%) C.F (Coefficient factor) Units (IU/ml)
[image:5.595.60.540.575.642.2] [image:5.595.60.538.670.737.2]the percentage of peak area was 1.057% ± 0.03%, 2.527% ± 0.02%, 4.807% ± 0.02% and 8.117% ± 0.03% respectively after 10 - 15 minutes peak. Figure 6,
[image:6.595.312.535.86.226.2]described the comparison of coefficient factor among standard and testing insulin samples and demonstrated clearly low coefficient factor (P < 0.005) for camel insulin samples an indication that the samples lost some potency after their storage. It was also concluded from the HPLC results that the camel insulin samples might also lose some potency (approx. 5% - 10%) after six month storage conditions. However, the results were compatible as previously described and met the standard criteria as mentioned in the individual monograph in standard books.
Figure 6. Comparison of coefficient factor against standard and testing insulin samples after HPLC elution. The data were presented as mean ± S.E.M. The P value, P < 0.005, was considered statistically significant.
5. Conclusion
This work represents the stability studies of various for- mulated camel insulin preparations after their 6 months storage. In conclusion, after performing various stability tests the lose in insulin potency was not so much signifi- cant and product use date are not later than 25% of the time remaining until the product’s expiration date.
REFERENCES
[image:6.595.61.283.276.494.2][1] L. H. Brown, K. Krumperman and C. J. Fullagar, “Out- of-Hospital Medication Storage Temperatures: A Review of the Literature and Directions for the Future,” Prehos- pital Emergency Care, Vol. 8, No. 2, 2004, pp. 200-206.
Figure 4. Calibration curve of standard insulin.
[2] M. M. Grajower, C. G. Fraser, J. H. Holcombe, M. L. Daugherty, W. C. Harris and M. R. De Felippis, “How Long Should Insulin Be Used Once a Vial Is Started,”
Diabetes Care, Vol. 26, No. 9, 2003, pp. 2665-2669.
http://dx.doi.org/10.2337/diacare.26.9.2665
[3] P. S. Adams, R. F. Haines-Nutt and R. Town, “Stability of Insulin Mixtures in Disposable Plastic Insulin Syrin- ges,” TheJournal of Pharmacy and Pharmacology, Vol.
39, No. 6, 1987, pp. 158-163.
http://dx.doi.org/10.1111/j.2042-7158.1987.tb06241.x [4] C. Chandler, C. M. Gryniewicz, T. Pringle and F.
Cun-ningham, “Insulin Temperature and Stability under Sti- mulated Transit Conditions,” American Journal of Health- System and Pharmacology, Vol. 65, No. 10, 2008, pp.
953-963. http://dx.doi.org/10.2146/ajhp070347
[5] M. Pingel and A. Vølund, “Stability of Insulin Prepara-tions,” Diabetes, Vol. 21, No. 7, 1972, pp. 805-813.
[6] United States Pharmacopoeia Convention, “Parenteral, Preparation; Soluble Insulin, Insulin Zinc Suspension Crystalline, Insulin Zinc Suspension Amorphous, Insulin Zinc Suspension Mixed,” United States Pharmacopoeia,
2000, pp. 807-808. Figure 5. The HPLC elution profile for camel insulin
sam-ples: The peak area and elution time of testing camel insulin preparations, soluble (1), crystalline (2), amorphous (3) and mixed (4) respectively. The proposed testing insulin con-centration was 0.1 mg/ml, although the elution of higher insulin concentrations (i.e., 0.2 mg, 0.4 mg, 0.8 mg respec-tively) was also shown in the figure.
[image:6.595.62.286.462.656.2][8] British Pharmacopoeia, “Determination of Zinc Content by Atomic Absorption. The Method of Direct Calibra-tion,” Vol. 2, Appendix VIII, 2000, pp. 124-125. [9] British Pharmacopoeia, “Determination of Nitrogen
Con-tent by Titration Method,” Vol. 2, 2000, Appendix VIII, pp. 104-105.
[10] Sebia Instruction, “Test for Purity of Insulin Using Elec-trophoresis,” 2003.
http://www.sebia-usa.com/products/html.
[11] United State pharmacopoeia Convention, “Sterility Test, Direct Transfer Method,” United State pharmacopoeia,
2000, pp. 822-824.
[12] A. Oliva, J. Fariña and M. Llabrés, “Development of Two High-Performance Liquid Chromatography Methods for the Analysis and Characterization of Insulin and Its Deg-radation Products in Pharmaceutical Preparations,” Brit-ish Journal of Biomedical Sciences and Chromatography,
Vol.749, No. 1, 2000, pp. 25-34.
http://dx.doi.org/10.1016/S0378-4347(00)00374-1 [13] R. Gregory, S. Edwards and N. A. Yateman,
“Demonstra-tion of Insulin Transforma“Demonstra-tion Products in Insulin Vials by High-Performance Liquid Chromatography,” Diabetes Care, Vol. 14, No. 1, 1991, pp. 42-48.