http://dx.doi.org/10.4236/jcc.2014.213005
3-D EIT Image Reconstruction Using a
Block-Based Compressed Sensing Approach
Lan-Rong Dung
1, Chian-Wei Yang
1, Yin-Yi Wu
21Departmentof Electrical and Computer Engineering, National Chiao Tung University, Hsinchu, Chinese Taipei 2Chung-Shan Institute of Science Technology, Taoyuan, Chinese Taipei
Email: [email protected]
Received 16 September 2014
Abstract
Electrical impedance tomography (EIT) is a fast and cost-effective technique that provides a to-mographic conductivity image of a subject from boundary current-voltage data. This paper pro-poses a time and memory efficient method for solving a large scale 3D EIT image reconstruction problem and the ill-posed linear inverse problem. First, we use block-based sampling for a large number of measured data from many electrodes. This method will reduce the size of Jacobian trix and can improve accuracy of reconstruction by using more electrodes. And then, a sparse ma-trix reduction technique is proposed using thresholding to set very small values of the Jacobian matrix to zero. By adjusting the Jacobian matrix into a sparse format, the element with zeros would be eliminated, which results in a saving of memory requirement. Finally, we built up the relationship between compressed sensing and EIT definitely and induce the CS: two-step Iterative Shrinkage/Thresholding and block-based method into EIT image reconstruction algorithm. The results show that block-based compressed sensing enables the large scale 3D EIT problem to be efficient. For a 72-electrodes EIT system, our proposed method could save at least 61% of memory and reduce time by 72% than compressed sensing method only. The improvements will be ob-vious by using more electrodes. And this method is not only better at anti-noise, but also faster and better resolution.
Keywords
EIT, Compressed Sensing, Image Reconstruction
1. Introduction
electrodes), the number of independent measurement is as high as 64,768. When the problem of a large number of electrodes and a large number of voxels happens, limitations appearing as large size matrices need to be stored and large matrix inversion is required.
This paper proposes a time and memory efficient method for solving a large scale 3D EIT image reconstruc-tion problem and the ill-posed linear inverse problem. We use block-based sampling [3], threshold limits on Ja-cobian matrix [4] and compressed sensing [5] in 3D EIT reconstruction image. We will introduce this method in the following section.
In this section, we will present shock filter algorithm in detail. Firstly, the X-ray images need to be noise-free images. In order to remove noise of X-ray image, we propose an anisotropic diffusion filter, and it’s an adaptive smoothing technique. Secondly, shock filter algorithm is proposed for the X-ray image segmentation and en-hancement. Finally, a two-stage shock filter is proposed to optimize the result of shock processing.
2. Block-Based Compressed Sensing in 3-D EIT
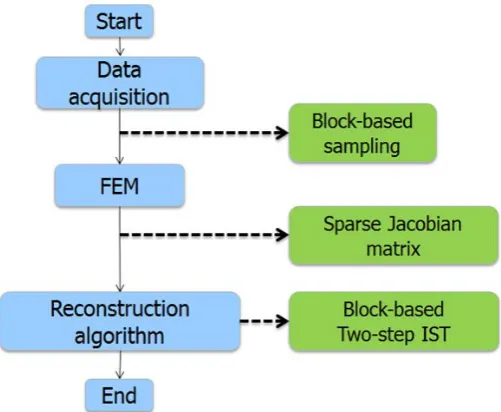
In this section, we will illustrate the proposed algorithm in detail. Figure 1 is the flow chart of block-based compressed sensing algorithm with the improved three steps: block-based sampling, sparse Jacobian matrix and reconstruction algorithm using compressed sensing.
2.1. EIT Image Reconstruction
Most EIT reconstruction methods consider a linear model of the form:
1 1
M M N N
y × =J × ⋅X × +n (1)
where M N
J∈ × is the Jacobian or sensitivity matrix and N
n∈ is the measurement noise, which is assumed
to be uncorrelated white Gaussian. J is calculated from the FEM as
[ ]
[ ]
[ ]
i ijj
y y
x
∂ =
∂ , and depends on the FEM, the
current injection patterns, the reference conductivity and the electrode models. This system is underdetermined since N >M. In order to obtain approximation solution; we need to solve the following minimization prob-lem, which is classical regularization method, called Tikhonov regularization:
2
1
arg min ( )
[image:2.595.174.425.499.705.2]2 y−Jx +λφ x (2) where λ>0 is the regularization parameter and φ(x) denotes penalty function or regularization function.
2.2. Block-Based Sampling
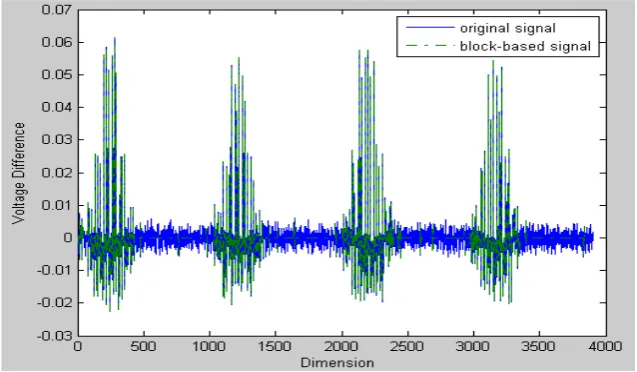
EIT image is the image of impedance changes. If the measurement data from the specific electrodes has a large of changes, it represents impedance will have a large of changes near the specific electrodes, vice versa. So we want to sample the measurement data of huge changes by using block-based sampling. This method will reduce the size of Jacobian matrix and can improve accuracy of reconstruction by using more electrodes. And then, in order to retain image quality, the paper use the size of 1/3 original signal as our measurement data, e.g. Figure 2.
Consider a class S of signal vectors x∈JN, with J and N integers. This signal can be reshaped into a J×N matrix, X and we use both notations interchangeably in the sequel. We will restrict entire columns of to be part of the support of the signal as a group. That is, signals in a block-sparse model have entire columns as zeros or non zeros. The measure of sparsity for X is its number of nonzero columns. More formally, we make the fol-lowing definition (3).
{
}
1
{ [ ] such that
0 for , 1, , , }
J N
K N
n
S X x x R
x n N K
×
= = … ∈
= ∉ Ω Ω ⊆ … Ω = (3)
We can extend this formulation to ensembles of J, length-N signals with common support. Denote this signal ensemble by { ,xˆ1 …,xˆJ}, with
N
ˆj ,1
x ∈ ≤ ≤j J. The matrix Xˆ features the same structure as the matrix X
obtained from a block-sparse signal; thus, the matrix Xˆcan be converted into a block-sparse vector xˆ that represents the signal ensemble. And then, we use the algorithm
(
X K,)
to obtain the best block-based ap-proximation of the signal X as follows:ˆ
2,2 2,0
ˆ ˆ
arg min . .
S
K X
X = X−X s t X ≤K (4)
It is easy to show that to obtain the approximation, it suffices toperform column-wise hard thresholding: let
ρ be the Kth largest L2-norm among the columns of. Then our approximation algorithmis
(
,)
[ ,1 , ]s s s
k k k N
X K = X = x …x
where
(
)
,1 , ,,
, where
0,
n n
S S S S
K k k N k n
n
x x
X K X x x x
x
ρ ρ
≥
= = … =
<
(5)
for each 1≤ ≤n . Alternatively, a recursive approximation algorithm can be obtained by sorting the columns of
X by their L2 norms, and then selecting the columns with largest norms.
[image:3.595.139.458.507.693.2]Accordingly, the measurement data is reduced so that it is made up of only Mb entries ratherthan the
pre-vious Mindices. The Jacobian Jij is now determined for each separate sampled measurement i = (d, mb) by
integrating over finite element Ωj from the electrical potential calculated in terms of the measured voltage at electrode multiplied by the potential induced by injected current Id, i.e.,
,
, :
b
b j b
d m
b d m j d m
j
V
J J d
x Ω φ φ
∂
= = = ∇ ∇ Ω
∂
∫
(6)where ,
b
d m
V represents the sampled measurements resulting from injected current Id. Computing the Jaco-
bian by Equation (6) yields a reduced matrix of size Mb × N.
2.3. Sparse Jacobian and Threshold Limits
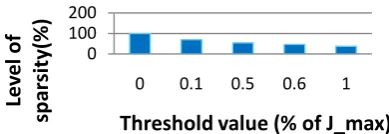
Due to the nature of 3D EIT, the sensitivity of the measurements to conductivity changes far from the relevant electrodes is small. Those values from the sensitivity map would appear to be very small. The zero elements still remain in the matrix which takes up memory and means they are used in the inverse calculation. The sparse ma-trix reduction method indicates that values which are very small, typically below a certain threshold, can belo-cated and transformed to zeros. These zero elements are then eliminated from the Jacobian matrix. This effect would decrease the total number of non-zero elements of the Jacobian matrix hence reducing the memory sto-rage. Figure 3 shows an example of the effect after thresholding. The level of sparsity (LOS) is defined as the number of non-zero elements divided by the total number of elements in the matrix.
The new Jacobian Js after being sparsed is then formed:
max( )
max( )
if %
0 if %
ij ij h
s
ij h
J J t J
J
J t J
≥ × = < ×
∑
∑
(7) where the threshold is t% of the average value of a sum of h biggest numbers in each row of the Jacobian ma-trix
∑
Jmax( )h . The Jacobian matrix Js now contains a large amount of zero values.In order to retain the original image quality, this paper sets the threshold value of 0.5%. And, it can be seen that LOS is at 50% and approximately 50% of total matrix are transformed to zero and can be eliminated.
2.4. Compressed Sensing: Two-Step Iterative Shrinkage/Thresholding Algorithm (TwIST)
This paper uses Two-step iterative shrinkage/thresholding algorithm [6] which are used in compressed sensing [7]. TwIST has been proposed to handle a class of convex unconstrained optimization problems for applications where the observation operator is ill-posed or ill-conditioned. Fortunately, TwIST can actually solve the L0 re-gularized LSP which can be expressed as:2 0
1 arg min
2 y−Jx +λ x (8)
where λ is the regularization parameter and 0
x is the L0-norm of the conductivity changes.
The TwIST algorithm has the form
1 ( 0)
[image:4.595.199.394.624.691.2]x = Γλ x (9)
Figure 3. Histogram of the level of sparsity of Jacobian for a 64-electrodeEIT system.
0 100 200
0 0.1 0.5 0.6 1
Lev
el
o
f
sp
ar
si
ty
(%)
(
)
(
)
1 1 1 ( )
t t t t
x+ = −α x− + α β− x + Γλ x (10)
for t≥1, where Γλ:m →m is defined as
( )
x(
x JT(
y Jx)
)
λ ψλ
Γ = + − (11)
where ψλ is the denoising operator. This paper uses hard threshold function as denoising function. To con-verge this algorithm, it has the optimal choice of α β,
2 1
( ) 1
1 ξ α
ξ
−
= +
+ (12)
2 1
α β
ξ =
+ (13)
where
ξ
is the real numbers such that 0< ≤ξ λmin( )
J JT ≤λmax( )
J JT =1. λi(.) is the thi eigenvalue of its
argument.
3. Simulation Results
This paper simulates 3D EIT models by using EIDORS software [8] and modifies EIDORS to use the proposed algorithm introduced in Section 2. All simulation results are performed on a EIT configuration using adjacent current stimulation and voltage measurements. We set sparse jacobian threshold value of 0.5%. 10 dB SNR white Gaussian noise is added in the measurement data.
Figure 4(a) is a 3D EIT model with one circle target. The target is located at (x, y, z) = (0, 0.1, 0.75) and its radius is 0.2. Figure 4(b) is a 3D EIT model with two circle target. Two targets are located at (x, y, z) = (0.5, 0, 0.75) and (−0.5, 0, 0.75). Their radiuses are 0.2.
3.1. Analysis of Memory and Time
Figure 5 shows comparison of memory storage and reconstruction time for 4 different methods. We use a 3D EIT model with one circle target at the different number of electrode, and reconstruct them by using 4 different methods. One-step Gauss Newton and Total variation [9] is conventional EIT reconstruction methods. They need use more memory usage and calculation time than compressed sensing algorithm. Less than 56-electrode EIT system, one-step GN is fastest, because there is only the iteration of calculation every computing. For many electrodes, compressed sensing algorithm will meet significant problems regarding storage space and recon-struction time. If we use our proposed improved method in large scale 3D EIT, the problems can be solved ef-fectively. We can use memory efficiently and reduce a lot of reconstruction time.
3.2. Comparisons
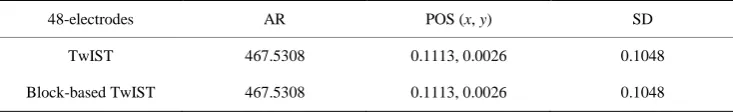
The results reconstruct 3D EIT model with one circle target for48-electrodesand 64-electrodes EIT system, as shown in Figure 4(a). We compare our proposed method with TwIST and use a set of figure of merit to charac-terize the image qualities based on GREIT [10]. Table 1 and Table 2 show that the average value of AR, POS and SD is the same at z = 0.55 − 0.95. From the results, 3-D EIT image can retain image quality after using block-based sampling.
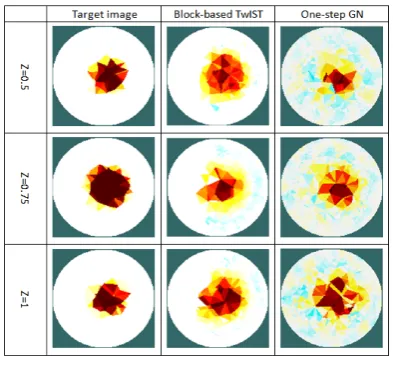
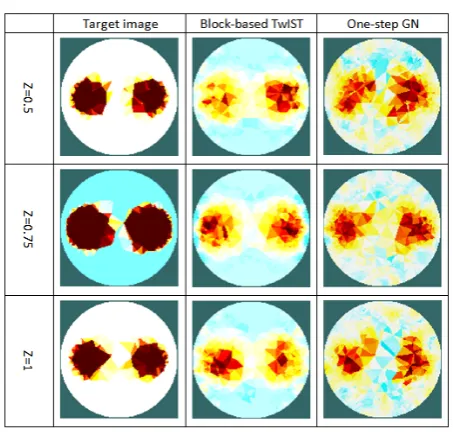
[image:5.595.114.481.666.722.2]Table 3 and Table 4 show comparison block-based TwIST with one step GN. Block-based TwIST is more robust to noise and the edges of the objects are more clearly defined. These table also show better spatial resolu-tion with our propose method. And then, with convenresolu-tional method the hyper parameter needs to be optimized with respect to noise level while our method doesn’t need such optimization.
Table 1. Comparison of block-based TwIST with original TwIST for 48-electrodes EIT system.
48-electrodes AR POS (x, y) SD
TwIST 467.5308 0.1113, 0.0026 0.1048
[image:6.595.158.442.81.225.2]
(a) (b)
Figure 4. Simulate a 3D EIT model with one and two circle target. (a) One circle target; (b) Two circle target.
[image:6.595.129.468.264.417.2]
(a) (b)
Figure 5. Analysis of memory and time by using 4 different reconstruction image algorithms in 3D EIT. (a) Memory; (b) Time.
Table 2. Comparison of block-based TwIST with original TwIST for 64-electrodes EIT system.
64-electrodes AR POS (x, y) SD
TwIST 379.5438 0.1086, 0.0016 0.4431
Block-based TwIST 379.5438 0.1086, 0.0016 0.4431
[image:6.595.112.484.471.511.2] [image:6.595.200.397.539.724.2]Table 4. Different reconstruction results with two circuses.
4. Conclusion
In this paper, we presented a time and memory efficient method for solving a large scale 3D EIT image recon-struction problem and the ill-posed linear inverse problem. For a 72-electrode EIT system, our proposed method could save at least 61% of memory and reduce time by 72% than compressed sensing method only. The im-provements will be obvious by using more electrodes. And this method is not only better at anti-noise, but also faster and better resolution than the conventional method.
References
[1] Cheney, M., Isaacson, D. and Newell, J.C. (1999) Electrical Impedance Tomography. SIAM Review, 41, 85-101.
http://dx.doi.org/10.1137/S0036144598333613
[2] Vauhkonen, P.J., Vauhkonen, M. and Savolai, T. (1999) Three Dimensional Electrical Impedance Tomography Based on the Complete Electrode Model. IEEE Transactions on Biomedical Engineering, 46, 1150-1160.
http://dx.doi.org/10.1109/10.784147
[3] Baraniuk, R.G., Cevher, V., Duarte, M.F. and Hegde, C. (2010) Model-Based Compressive Sensing. IEEE Transac-tions on Information Theory, 56, 1982-2001. http://dx.doi.org/10.1109/TIT.2010.2040894
[4] Yang, C.L., Wei, H.Y., Adler, A. and Soleimani, M. (2013) Reducing Computational Costs in Large Scale 3D EIT by Using a Sparse Jacobian Matrix with Block-Wise CGLS Reconstruction. Physiological Measurement, 34, 645-658.
http://dx.doi.org/10.1088/0967-3334/34/6/645
[5] Donoho, D.L. (2006) Compressed Sensing. IEEE Transactions on Information Theory, 52, 1289-1306.
http://dx.doi.org/10.1109/TIT.2006.871582
[6] Bioucas-Dias, J. and Figueiredo, M. (2007) A New TwIST: Two-Step Iterative Shrinkage/Thresholding Algorithms for Image Restoration. IEEE Transactions on Image Processing, 16, 2992-3004.
http://dx.doi.org/10.1109/TIP.2007.909319
[7] Tehrani, J.N., Jin, C., McEwan, A. and van Schaik, A. (2010) A Comparison between Compressed Sensing Algorithms in Electrical Impedance Tomography. IEEE Engineering in Medicine & Biology Society, 2010, 3109-3112.
[8] Adler, A. and Lionheart, W.R.B. (2006) Uses and Abuses of EIDORS: An Extensible Software Base for EIT. Physio-logical Measurement, 27, S25-S42. http://dx.doi.org/10.1088/0967-3334/27/5/S03
[9] Borsic, A., Graham, B.M., Adler, A. and Lionheart, W.R.B. (2010) In Vivo Impedance Imaging with Total Variation Regularization. IEEE Transactions on Medical Imaging, 29, 44-54. http://dx.doi.org/10.1109/TMI.2009.2022540