R E S E A R C H
Open Access
Rate and breadth of protein evolution are only
weakly correlated
Sergey A Naumenko
1,2*and Alexey S Kondrashov
2,3Abstract
Background:Evolution at a protein site can be characterized from two different perspectives, by its rate and by the breadth of the set of acceptable amino acids.
Results:There is a weak positive correlation between rates and breadths of evolution, both across individual amino acid sites and across proteins.
Conclusions:Rate and breadth are two distinct, and only weakly correlated, characteristics of protein evolution. The most likely explanation of their positive correlation is heterogeneity of selective constraint, such that less functionally important sites evolve faster and can accept more amino acids.
Reviewers:This article was reviewed by Eugene V. Koonin, Arcady R. Mushegyan, and Eugene I. Shakhnovich.
Background
Evolution of a protein, at a particular site, can be char-acterized from two different perspectives [1,2]. The first is the rate of evolution, defined as the number of amino acid replacements which occur per unit of astronomical time or per time required for one selectively neutral substitution. The second is the“breadth” of evolution,i. e., the diversity of acceptable amino acids, which can be defined as the probability that two independent replace-ments of a particular amino acid at a site lead to the same amino acid.
A priori, one could expect the rate and the breadth of protein evolution to be positively correlated across sites. Indeed, let us assume, in the spirit of the neutral theory [3], that, at a site, some amino acids are permitted, and confer the same fitness, and other amino acids are for-bidden, because they confer very low fitnesses. Then, a site with a large number of permitted amino acids should display both a high rate and a wide breadth of evolution. Here, we investigate the rate-breadth correla-tion using the data on orthologous proteins from Droso-philaand Mammalia.
Methods
We used two datasets: 13 genomes of placental mam-mals (all the available genomes with coverage above ×5) with Monodelphis domestica as an outgroup, and 11 genomes of species from genus Drosophila with Ano-pheles gambiae as an outgroup. Genome-size multiple alignments of 44 vertebrates and 13 insects were down-loaded from UCSC Genome Browser database [4], and the subsets of genomes which we used were extracted from them. To obtain orthologous gene sets we extracted protein-coding sequences from whole-chromo-some alignments using H. sapiens genome annotation for vertebrates andD. melanogastergenome annotation for insects. Alignments of orthologous genes were trans-lated into amino acid sequences. Phylogenetic trees for the two datasets presented in the UCSC Genome Brow-ser are reproduced in Figure 1.
To reconstruct substitutions on these phylogenetic trees, we used maximum likelihood method implemen-ted in PAML software package [5]. For a multiple align-ment of protein-coding genes translated into amino acid sequences, codeml command of PAML provides the list of amino-acid substitutions for each amino acid site.
The rate of evolution at a site was characterized by n, the number of independent substitutions of the com-mon ancestral amino acid. Thus, with N species in the dataset, the rate can vary between 0 and N. The breadth B of acceptable amino acids at a site was characterized * Correspondence: [email protected]
1
Institute for Information Transmission Problems, Russian Academy of Sciences, Bolshoi Karetny pereulok 19, Moscow 127994, Russia Full list of author information is available at the end of the article
by a quantity which is analogous to virtual heterozygos-ity, widely used in population genetics,
B=n/(n−1)
1−
k
i=1
p2i
(1)
where k is the number of different amino acids with which the ancestral amino acid was substituted at the site, and pi is the frequency of the i-th amino acid. B
provides an unbiased sample estimate of the effective number of acceptable amino acids at a site, because it can be interpreted as the fraction of pairs of
substitutions of the ancestral amino acid where the new amino acids are different from each other. Indeed, this fraction can be expressed as
n(n−1)/2−
k
i=1
xi(xi−1)/2
/n(n−1)/2 (2)
wherexi is the number of substitutions of the
ances-tral amino acid with the i-th amino acid. It is easy to
show that expression (2) is equal to B, because k
i=1
xi= n
andpi=xi/n.
B can vary between 0 (all the observed substitutions lead to the same amino acid, implying that only 1 amino acid is acceptable as a substitution) and 1 (all the observed substi-tutions lead to different amino acids, implying an infinite variety of acceptable substitutions). Obviously, B can be calculated only for sites where at least 2 substitutions were observed. A measure of amino acid diversity which is equivalent to B be has been proposed in [6].
Results
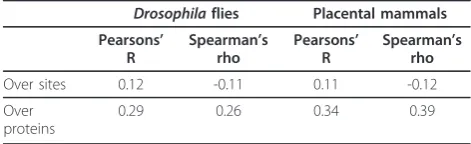
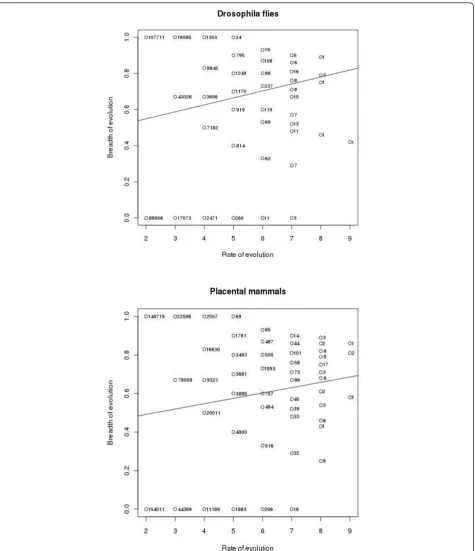
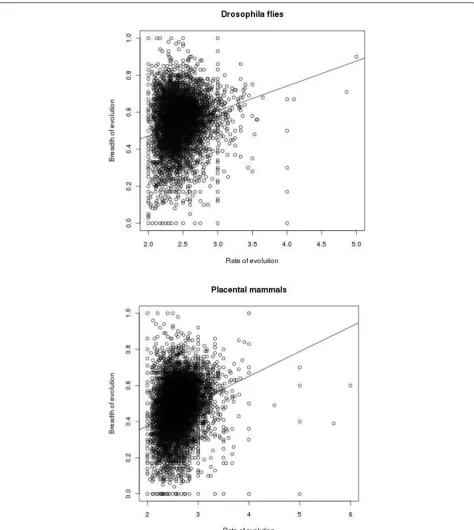
Figure 2 shows the relationship between the rate and the breadth of evolution at individual amino acid sites. There were also 2,886,411 and 324,330 sites with 0 and 1 substitution, respectively in Drosophila flies, and 5,086,661 and 353,544 sites with 0 and 1 substitution, respectively, in placental mammals, for which B cannot be calculated (not shown in Figure 2). Figure 3 displays the same relationship for whole proteins. For each pro-tein, arithmetic means of n and B were calculated for all those sites where at least two substitutions of the ances-tral amino acid occurred. Table 1 presents Pearson’s and Spearman’s correlation coefficients between the rate and the breadth of evolution, calculated from these data. All these coefficients are significantly different from 0 (p-value < 2.2e-16).
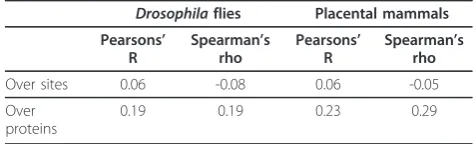
Figures 4 and 5, and Table 2 present analogous data for amino acids grouped into 6 classes, according to [7] (AVLIMC, FWYH, STNQ, KR, DE, GP), such that only those substitutions that involve amino acids from differ-ent classes were taken into account. All the coefficidiffer-ents of correlation presented in Table 2 are significantly dif-ferent from 0 (p-value < 2.2e-16).
Discussion
Our data demonstrate a weak positive correlation between the rate and the breadth of protein evolution across both individual sites and whole proteins (Table 1). Indeed, very weak negative Spearman’s correlations across individual sites should probably be viewed as arti-factual, because non-parametric rank correlation ignores the range of breadth values, which is much wider, and
includes many 0 values, for low values of the rate of evo-lution (Figures 2 and 4). With this structure of data, a positive Pearson’s correlation is consistent with a nega-tive Spearman’s correlation. Indeed, when data for whole proteins are considered, which do not possess this struc-ture (Figures 3 and 5), Pearson’s and Spearman’s correla-tion coefficients are very close to each other.
Thus, at sites which evolve faster, the diversity of acceptable amino acids is also slightly higher. The sim-plest explanation of this positive correlation is that many amino acid replacements occur at selectively neu-tral, or nearly neuneu-tral, sites [3]. Such sites evolve at above-average rates, due to lack of selective constraint, and all amino acids are acceptable at them, leading to a positive rate-breadth correlation.
Still, this correlation is weak, at it is often the case in evolutionary bioinformatics [8,9]. In the case of indivi-dual sites, this must be partially due to a relatively small number of species in both datasets. Indeed, on a sample of only 11 or 13 genomes, the“real”values of rate and breadth of evolution are determined, for a particular site, only with substantial sampling errors, which reduces their correlation. However, this effect must be much less important when these characteristics are calculated for whole proteins, each consisting of many sites, and yet the correlation observed in this case is not much higher.
The overall lengths of phylogenetic trees, in the units of Ks, are 3.20 and 2.08, for placental mammals and Drosophilaflies, respectively. Thus, assuming that evolu-tion at synonymous sites is approximately neutral, we can expect ~7 and ~4 nonsynonymous substitutions at a codon in these trees, as long as selective constraint is absent. Sites with that many substitutions are rare (Fig-ure 2), indicating a widespread constraint on the rate of evolution. A value of breadth B at a site without con-straint should be ~0.85, because an amino acid can have from 5 to 12 1-step neighbors in the genetic code table. Again, we mostly see lower values, indicating a substan-tial selective constraint in terms of the breadth, too.
Reviewer’s comments Reviewer’s report
Title: Rate and breadth of protein evolution are only weakly correlated
Version: 2 Date: 28 September 2011 Reviewer number: 1
Report form: Eugene V. Koonin
Review of “Rate and breadth of protein evolution are only weakly correlated”by Naumenko and Kondrashov
In this extremely brief manuscript, Naumenko and Kondrashov establish the connection between two
characteristics of the evolution of amino acid sites in proteins: the rate of amino acid substitution and the range (breadth) of amino acid residues that are tolerated in the given position. A weak positive correlation
between the two variables is demonstrated. This result is by no means unexpected, precisely because it seems intuitively highly plausible that‘less functionally impor-tant sites evolve faster and can accept more amino acids’. I nevertheless accept the authors’view that this connection cannot be taken for granted - indeed, it is possible to imagine a site at which two amino acids oscillate at a high rate - and thus is certainly worth documenting.
The manuscript, however, is fraught with a variety of conceptual, technical and presentational problems. At the level of general conclusions, my impression is that the authors more or less attempt to“have it both ways": the title for instance states that the two characteristics are‘only weakly correlated’but the interpretation mostly deals with the fact that positive correlation does exist. There is no real attempt to explain the modest magni-tude of the correlation.
Furthermore, the reported observations are not put into a general context of the previous studies on con-nections between different evolutionary variables. For example, an obvious but potentially interesting parallel exists between the observations reported here and the previously described correlation between the evolution-ary rate of an individual gene and its loss rate in the course of evolution [1,2]. In general, there is virtually no discussion in the manuscript and only 6 references, all of them purely technical. I am not at all suggesting that the number of references should be inflated artificially but this brevity is excessive and does not benefit the reader (to put it mildly).
Perhaps, most importantly, the extreme brevity of the manuscript results in the lack of sufficient detail on the methods and results; some of these details seem essential. We are not even told whether the reported correlations are R or R2 (a big difference). Further-more, there are no p-values for these correlation coef-ficients. Without such statistical estimates, it is impossible to judge the quality and robustness of the results. At least to this reviewer, Figure 2 is a very-strange, counter-intuitive way to present the results. Figure 3 is easy to understand but this figure causes concerns of a different kind: could it be that the observed correlations are caused by outliers? The
main, dense cloud of points seems pretty symmetrical in both A and B. I think it is important to address this issue. Nothing at all in this manuscript is described in sufficient detail -neither the sets of orthologous genes analyzed nor the alignment method not the tree con-struction procedure. This makes the work irreproduci-ble and worse, impossiirreproduci-ble to assess objectively. My greatest concern perhaps is with the calculation of the diversity measure, B. I realize that by design this is an unbiased measure that is independent of the actual number of substitutions in a site (for n > 2). However, I am not sure that in practice there is no statistical bias toward less diversity in slow-evolving sites. Should that be the case, the result reported here simply would be an artefact. I believe that it is crucial for the authors to address this issue and more generally describe the methods adequately, even if they choose not to amend the other sections.
1. Krylov DM, Wolf YI, Rogozin IB, Koonin EV: Gene loss, protein sequence divergence, gene dispensability, expression level, and interactivity are correlated in eukaryotic evolution. Genome Res 2003, 13(10):2229-2235.
2. Wolf YI, Novichkov PS, Karev GP, Koonin EV, Lip-man DJ: The universal distribution of evolutionary rates of genes and distinct characteristics of eukaryotic genes of different apparent ages. Proc Natl Acad Sci USA 2009, 106(18):7273-7280.
Quality of written English: Acceptable
Response to Reviewer 1(Eugene V. Koonin)
At the level of general conclusions, my impression is that the authors more or less attempt to “have it both ways": the title for instance states that the two charac-teristics are ‘only weakly correlated’ but the interpreta-tion mostly deals with the fact that positive correlainterpreta-tion does exist. There is no real attempt to explain the mod-est magnitude of the correlation.
We revised our discussion of the weak correlation
observed. However, we did not try “to have it both
ways”, as we have no dog in this fight - instead, we
just report a pattern which, apparently, has not been reported previously.
Furthermore, the reported observations are not put into a general context of the previous studies on con-nections between different evolutionary variables. For example, an obvious but potentially interesting parallel exists between the observations reported here and the previously described correlation between the evolution-ary rate of an individual gene and its loss rate in the course of evolution [1,2].
This is reassuring: if Dr. Koonin could not think of anything closer to the pattern we report, our manu-script is definitely worth publishing... Which is strange, because a question we asked seems to be a Table 1 Correlation coefficients between the rate and the
breads of evolution for 20 amino acids
Drosophilaflies Placental mammals
Pearsons’ R
Spearman’s rho
Pearsons’ R
Spearman’s rho
Over sites 0.12 -0.11 0.11 -0.12
Over proteins
rather basic one - and we were afraid that the answer is buried in the literature somewhere. We now cite [1,2]- although their relevance to our observation is rather indirect, to put it mildly.
I am not at all suggesting that the number of refer-ences should be inflated artificially but this brevity is excessive and does not benefit the reader (to put it mildly).
As this reviewer surely knows, Anton Chekhov
regarded brevity as a “sister of talent”. We now
expanded our Discussion a little, mostly to reiterate that such a weak correlation seems puzzling to us. We do not have a definite explanation.
Perhaps, most importantly, the extreme brevity of the manuscript results in the lack of sufficient detail on the methods and results; some of these details seem essen-tial. We are not even told whether the reported correla-tions are R or R2 (a big difference). Furthermore, there
are no p-values for these correlation coefficients. With-out such statistical estimates, it is impossible to judge the quality and robustness of the results.
We are thankful for this useful suggestion. Now we
report both Pearson’s andf Spearman’s correlation
coefficients, which, due to huge sample sizes, are all significantly different from zero, despite being rather small.
At least to this reviewer, Figure 2 is a very strange, counter-intuitive way to present the results.
Well, but how else could we present these data? Both the abscissa and the ordinate can accept only a small number of values (for the ordinate, these values are different for different abscissa values). We tried our best.
Figure 3 is easy to understand but this figure causes concerns of a different kind: could it be that the observed correlations are caused by outliers? The main, dense cloud of points seems pretty symmetrical in both A and B. I think it is important to address this issue.
There is nothing in the data which suggests that outliers are disproportionally important.
Nothing at all in this manuscript is described in suffi-cient detail -neither the sets of orthologous genes ana-lyzed nor the alignment method not the tree construction procedure.
We did not use any special tree construction proce-dure. As stated in the manuscript, we simply repro-duced the already-published phylogenies from the UCSC site. Also, as stated in the manuscript, we used standard alignments, fully described in the references provided. We only used PAML and calcu-lated correlation coefficients for its outputs, as described.
This makes the work irreproducible and worse, impos-sible to assess objectively.
We cannot agree - one can take the same standard alignments we used and easily get the same results -as long -as we did not make any stupid mistakes.
My greatest concern perhaps is with the calculation of the diversity measure, B. I realize that by design this is an unbiased measure that is independent of the actual number of substitutions in a site (for n > 2). However, I am not sure that in practice there is no statistical bias toward less
diversity in slow-evolving sites.
We are not sure what to do about this comment. As stated in our manuscript, B (which is not novel -it has already been introduced, for a different pur-pose, in Ref. 6) is the proportion of pairs of novel amino acids, substituting the ancestral amino acid, which consist of different amino acids. Thus, B must be unbiased, as far as the number of observed substi-tutions is concerned, and is is not clear what is a
sta-tistical bias “in practice”. We would love to fix
something here - but do not see what is broken. Reviewer’s report
Title: Rate and breadth of protein evolution are only weakly correlated
Version: 2 Date: 5 October 2011 Reviewer number: 2
Report form:
The authors demonstrate that the frequency of amino acid substitutions (rate of protein sequence evolution) and the repertoire of replacements in the substituted sites (breadth of protein sequence evolution) are corre-lated only weakly.
I was curious to see, however, that the data indicate something more than that.
Namely, there is a strong depletion not only of “high rate/low breadth”, but“high rate/medium to medium-high breadth” categories of sites and proteins. Is it just the artefact of small number of fast-evolving sites in these species, or is anything else going on? One way to partially test this would be to examine the data for viruses, where there are not that many proteins, but much more lineages and substitutions.
I would also like to comment on the null hypothesis. The authors state in the Background that“A priori, it is not obvious how the rate and the breadth are corre-lated across sites and proteins”, but in the rest of the study seem to express mild surprise that the correla-tion between rate and breadth is so weak. I feel that expecting little if any correlation would be sensible, because this would involve fewer“just so” stories than otherwise. On the other hand, if most sites turn out to be constrained as they appear to be, this is evidence in favor of different possible kinds of selection, as the authors indicate. Can they also indicate whether this bears in any way on the various neutral models of pro-tein evolution?
Quality of written English: Acceptable
Response to Reviewer 2(Arcady R. Mushegyan)
There is a strong depletion not only of“high rate/low breadth”, but “high rate/medium to medium-high breadth” categories of sites and proteins. Is it just the artefact of small number of fast-evolving sites in these species, or is anything else going on? One way to par-tially test this would be to examine the data for viruses, Table 2 Correlation coefficients between the rate and the
breads of evolution for 6 classes of amino acids
Drosophilaflies Placental mammals
Pearsons’ R
Spearman’s rho
Pearsons’ R
Spearman’s rho
Over sites 0.06 -0.08 0.06 -0.05
Over proteins
where there are not that many proteins, but much more lineages and substitutions.
An interesting observation. Indeed, viruses or mito-chondria, with very fat multiple alignemnts (but only a few of them), are definitely worth looking at. How-ever, we feel that they should be treated separately, because rather different analyses may be needed.
I would also like to comment on the null hypothesis. The authors state in the Background that“A priori, it is not obvious how the rate and the breadth are correlated across sites and proteins”, but in the rest of the study seem to express mild surprise that the correlation between rate and breadth is so weak. I feel that expect-ing little if any correlation would be sensible, because this would involve fewer“just so”stories than otherwise. On the other hand, if most sites turn out to be con-strained as they appear to be, this is evidence in favor of different possible kinds of selection, as the authors indi-cate. Can they also indicate whether this bears in any way on the various neutral models of protein evolution?
Essentially the same point has been made by reviewer 3. We now think that it is reasonable to
treat a substantial positive correlation as “
null-hypothesis”, because it is expected in the simplest
case of neutrality with some strong selective con-straint. We revised the text accordingly.
Reviewer’s report
Title: Rate and breadth of protein evolution are only weakly correlated
Version: 2 Date: 1 November 2011 Reviewer number: 3
Report form:
Review of the paper Rate and breadth of protein evo-lution are only weakly correlated’’by SA Naumenko and AS Kondrashov.
In this paper Naumenko and Kondrashov study the relationship between evolutionary rate at a protein locus and ‘’evolutionary breadth’’, i.e. the diversity of amino acid substitutions at the same locus. The authors find very small correlation between the two quantities. The Bioinformatics analysis is carried out carefully and pro-fessionally and the data itself is interesting. However, I have several concerns about discussion of the results and most important, their relevance.
1) What did the authors expect in the first place and why? What kind of model did they have in mind? Are their results surprising or expected/trivial?
2) Due to stability constraints buried amino acids are much more conserved (i.e. evolve much slower and/or have less diverse substitutions) as shown in our papers in 1999 (JMB, v.291, pp.177-96) and in 2001 (ibid, v.312, pp, 289-307).
To that end this study can be significantly deepened and extended if protein sites are classified by their
buriedness (e.g. solvent accessibility, ASA or related measure) and proper comparison is made. Further the authors should make themselves familiar with recent work by Francosa and Xia, Mol Biol Evol v.26, pp.2387-95 (2009) and Wilke et al Genetics v.188, p.479 (2011) which address the issue of relation of evolutionary rate to location of amino acid in structure.
3) The author’s definition of‘’breadth’’does not con-sider the proximity of physical-chemical properties of amino acids. For example one can observe many muta-tions of V to, say L in a hydrophobic core but these are almost neutral as amino acids are very similar in many respects. One way to address this shortcoming is to use any substitution matrix and weight diversity definition accordingly. Alternatively the authors can group amino acids by their properties (e.g one such grouping is pre-sented in the 1999 JMB mentioned above) and consider amino acid changes only occurring between groups and disregard changes within same group. The results of such analysis might be much more informative, espe-cially compared with‘’raw’’ data presented here. It will provide an insight of what kind of pressure (to maintain stability, function or specific or promiscuous protein-protein interactions) is most manifest in observed evolu-tionary patterns.
Eugene Shakhnovich Harvard UniversityQuality of written English: Acceptable
Response to Reviewer 3(Eugene I. Shakhnovich)
1) What did the authors expect in the first place and why? What kind of model did they have in mind? Are their results surprising or expected/trivial?
We expected a stronger correlation. Indeed, in the simplest case, some amino acids are permitted at a site (under selective neutrality) and some are forbid-den (under strong negative selection) - which would lead to a strong correlation. We now state this - not as a part of our personal intellectual histories, but as
a reasonablea prioriassumption.
2) Due to stability constraints buried amino acids are much more conserved (i.e. evolve much slower and/or have less diverse substitutions) as shown in our papers in 1999 (JMB, v.291, pp.177-196) and in 2001 (ibid, v.312, pp, 289-307). To that end this study can be signif-icantly deepened and extended if protein sites are classi-fied by their buriedness (e.g. solvent accessibility, ASA or related measure) and proper comparison is made....
We agree. However, this sounds like a separate project, investigating the phenomenon we describe here.
3) The author’s definition of‘’breadth’’does not con-sider the proximity of physical-chemical properties of amino acids....
results are included in the paper. Essentially, nothing changed.
1 Eugene V. Koonin Second review (response to the authors’rebuttal) of“Rate and breadth of protein evolu-tion are only weakly correlated”by Naumenko and Kon-drashov The revised manuscript is an improvement over the original version, in my view, primarily because the authors now clearly state their null hypothesis in the Background section (in response to the comments of reviewers #2 and #3). However, I found that other aspects of the manuscript problems and in particular some of the responses to my original comments remain problematic.
From the rebuttal:
We now cite [1,2] - although their relevance to our observation is rather indirect, to put it mildly.
Reviewers’response: I take exception to this and con-tinue to maintain that the relevance is substantial and clear. These references investigate the relationship between evolutionary rates at different scales, essentially like the work of Naumenko and Kondrashov, although different measures of long-term evolutionary rates were employed.
Moreover, the citation itself is disingenuous:“Still, this correlation is weak, at it is often the case in evolutionary bioinformatics [8,9]“. This was not at all the context in which I expected these references to be cited, the con-nection is substantial (see above) rather than purely for-mal as the quoted sentence implies. Moreover, although the statement about weak correlations is generally rea-sonable, the cited papers actually report relatively strong correlations. This is not at all an adequate response to a reviewer’s comment. If the authors actually do not see the relevance, they are entitled to their opinion and could simply say that much; the reader would know of the dis-senting view of the reviwer from the comment. However, if they choose to cite these references in the main body of the paper, I believe this should be done properly.
From the rebuttal:
As this reviewer surely knows, Anton Chekhov regarded brevity as a “sister of talent”. We now expanded our Discussion a little, mostly to reiterate that such a weak correlation seems puzzling to us. We do not have a definite explanation.
Reviewer’s response: I still maintain that the manu-script is too brief and does not include either proper background or sufficient discussion. I am not sure the Chekhov quote (indeed, popular among Russian-reading literati) really belongs here. But, if the authors wish to head in that direction, I am afraid the irony is on them. Apparently, Chekhov’s formula (from a letter to his brother) is a paraphrase of a line from Shakespeare’s Hamlet: 2 ‘...brevity is the soul of wit’ which is pro-nounced by Lord Polonius to announce Hamlet’s
purported madness to the King and Queen http://shake-speare.mit.edu/hamlet/full.html. That character is not necessarily the best example to follow.
From the rebuttal:
We are thankful for this useful suggestion. Now we report both Pearson’s andf Spearman’s correlation coef-ficients, which, due to huge sample sizes, are all signifi-cantly different from zero, despite being rather small.
Reviewer’s response: Certainly, it is good that the authors have followed the suggestion to include p-values. However, I am still troubled by the negative Spearman coefficient values for individual sites, the authors attempt on explanation in the beginning of the Discussion notwithstanding. These negative values are of about the same magnitude as the corresponding posi-tive values of the Pearson correlation coefficient and in my view are problematic.
Reviewer’s report
Title: Rate and breadth of protein evolution are only weakly correlated
Version: 5 Date: 23 December 2011 Reviewer number: 2
Report form: Nothing further
Quality of written English: Acceptable
Acknowledgements
We are thankful to the reviwers for a number of comments which, hopefully, improved our paper. Our work was supported by grant 11. G34.31.0008 fromt the Russian Ministry of Science.
Author details
1Institute for Information Transmission Problems, Russian Academy of
Sciences, Bolshoi Karetny pereulok 19, Moscow 127994, Russia.2Department of Bioengineering and Bioinformatics, M. V. Lomonosov Moscow State University, Vorbyevy Gory 1-73, Moscow 119992, Russia.3Life Sciences
Institute and Department of Ecology and Evolutionary Biology, University of Michigan, Ann Arbor, Michigan 48109, USA.
Authors’contributions
Both authors planned the research, and SN was mostly responsible for carrying out the analysis. AK did most of the writing. Both authors read and approved the final manuscript.
Competing interests
The authors declare that they have no competing interests.
Received: 30 August 2011 Accepted: 15 February 2012 Published: 15 February 2012
References
1. Adzhubei IA, Schmidt S, Peshkin L, Ramensky VE, Gerasimova A, Bork P, Kondrashov AS, Sunyaev SR:A method and server for predicting damaging missense mutations.Nature Methods2010,7:248-249. 2. Jordan DM, Kiezun A, Baxter SM, Agarwala V, Green RC, Murray MF, Pugh T,
Lebo MS, Rehm HL, Funke BH, Sunyaev SR:Development and validation of a computational method for assessment of missense variants in hypertrophic cardiomyopathy.American Journal of Human Genetics2011, 88:183-192.
4. Fujita PA, Rhead B, Zweig AS, Hinrichs AS, Karolchik D, Cline MS, Goldman M, Barber GP, Clawson H, Coelho A, Diekhans M, Dreszer TR, Giardine BM, Harte RA, Hillman-Jackson J, Hsu F, Kirkup V, Kuhn RM, Learned K, Li CH, Meyer LR, Pohl A, Raney BJ, Rosenbloom KR, Smith KE, Haussler D, Kent WJ:The UCSC genome browser database: update 2011. Nucleic Acids Research2010,39(Supplement):D876-D882.
5. Yang Z:PAML 4: Phylogenetic Analysis by Maximum Likelihood.Mol Biol Evol2007,24:1586-1591.
6. Rodi DJ, Mandava S, Makowski L:DIVAA: analysis of amino acid diversity in multiple aligned protein sequences.Bioinformatics2004,20:3481-3489. 7. Mirny MA, Shakhnovich EI:Universally Conserved Positions in Protein
Folds: Reading Evolutionary Signals about Stability, Folding Kinetics and Function.J Mol Biol1999,291:177-96.
8. Krylov DM, Wolf YI, Rogozin IB, Koonin EV:Gene loss, protein sequence divergence, gene dispensability, expression level, and interactivity are correlated in eukaryotic evolution.Genome Res2003,13(10):2229-2235. 9. Wolf YI, Novichkov PS, Karev GP, Koonin EV, Lipman DJ:The universal
distribution of evolutionary rates of genes and distinct characteristics of eukaryotic genes of different apparent ages.Proc Natl Acad Sci USA2009, 106(18):7273-7280.
doi:10.1186/1745-6150-7-8
Cite this article as:Naumenko and Kondrashov:Rate and breadth of protein evolution are only weakly correlated.Biology Direct20127:8.
Submit your next manuscript to BioMed Central and take full advantage of:
• Convenient online submission
• Thorough peer review
• No space constraints or color figure charges
• Immediate publication on acceptance
• Inclusion in PubMed, CAS, Scopus and Google Scholar
• Research which is freely available for redistribution