The relatio n sh ip b e tw ee n proliferation and
differentiation during oligodendrocyte
developm ent
James A. Apperly
Thesis submitted to the University o f London
for the degree o f Doctor o f Philosophy.
ProQuest Number: U642630
All rights reserved
INFORMATION TO ALL USERS
The quality of this reproduction is dependent upon the quality of the copy submitted.
In the unlikely event that the author did not send a complete manuscript and there are missing pages, these will be noted. Also, if material had to be removed,
a note will indicate the deletion.
uest.
ProQuest U642630
Published by ProQuest LLC(2015). Copyright of the Dissertation is held by the Author.
All rights reserved.
This work is protected against unauthorized copying under Title 17, United States Code. Microform Edition © ProQuest LLC.
ProQuest LLC
789 East Eisenhower Parkway P.O. Box 1346
A b stract
How do precursor cells know when it is time to stop dividing and
differentiate? The phenomenon o f lineage-specific progenitor cells undergoing
a limited period o f proliferation prior to terminal differentiation is a common
theme in multicellular development. Despite this, little is understood about how
these two events are co-ordinated during the normal schedule o f development.
I have studied the question o f how proliferation and differentiation are
co-regulated in the oligodendrocyte lineage in the rodent optic nerve.
Oligodendrocytes are post-mitotic cells that myelinate axons in the vertebrate
central nervous system. They develop from precursor cells whose maturation is
controlled by a timer, which is an intrinsic property o f the cells, that limits
proliferation. The timer seems not to control the number o f divisions the cell
can undergo but rather the length o f time during which divisions can occur.
Significant effort has been devoted to understanding how the
intracellular timer regulates oligodendrocyte development. The timer consists
o f two components that are modulated by distinct kinds o f extracellular signals.
Mitogens drive a timing component whose value increases as precursor cells
continue to divide. Once this value exceeds a critical threshold, it signals that
the proliferative period has elapsed, and hydrophobic signalling molecules
trigger an effector component that elicits cell-cycle arrest and differentiation.
The value o f the timing component is determined by several
intracellular molecules whose activities change as the timer runs. One o f these
precursor cells are more likely to stop dividing and differentiate than when it is
low. In oligodendrocyte precursor cells derived from mice that lack p27, the
timer runs aberrantly and cell-cycle arrest and terminal differentiation are
delayed.
It is not understood how the molecular mechanics o f the timer control
oligodendrocyte development. Does the timer serve to arrest the cell-cycle,
with differentiation following by default, or is cell-cycle arrest subordinate to
the programme o f terminal differentiation? These questions remain
unanswered, largely because o f a persistent inability to experimentally
manipulate the genome o f oligodendrocyte precursor cells.
The present study was an attempt to overcome these problems and had
two aims - first, to devise a reliable system for transfecting oligodendrocyte
precursor cells and second, to determine whether the timer primarily controls
the timing o f cell-cycle arrest. I developed a new retroviral vector that co
expresses p27 and green fluorescent protein (GFP) in precursor cells. The use
o f GFP allows the identification o f living precursor cells that over-express p27,
which can then be followed over many days in culture.
My findings support previous work showing that p27 plays a role in
governing the timing o f oligodendrocyte differentiation. They show that over
expression o f p27 promotes oligodendrocyte differentiation by advancing the
value o f the timing component, although it does not promote differentiation if
the effector component is inoperative. The cell-cycle time o f precursor cells
C o n ten ts
THE RELATIONSHIP BETWEEN PROLIFERATION AND DIFFERENTIATION
DURING OLIGODENDROCYTE DEVELOPMENT... 1
ABSTRACT... 2
CONTENTS... 4
TABLE OF FIGURES... 8
ACKNOWLEDGEMENTS...12
ABBREVIATIONS...13
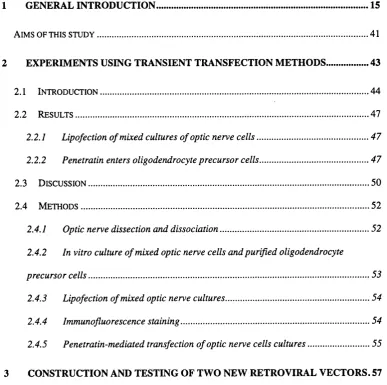
1 GENERAL INTRODUCTION... 15
Aim so fth iss t u d y... 41
2 EXPERIMENTS USING TRANSIENT TRANSFECTION METHODS...43
2.1 In t r o d u c t io n...4 4 2 .2 Re s u l t s... 47
2 .2 .1 Lipofection o f mixed cultures o f optic nerve cells...47
2 .2 .2 Penetratin enters oligodendrocyte precursor cells...47
2.3 Di s c u s s i o n... 5 0 2 .4 Me t h o d s... 5 2 2.4.1 Optic nerve dissection and dissociation...5 2 2.4.2 In vitro culture o f mixed optic nerve cells and purified oligodendrocyte precursor cells...53
2.4.3 Lipofection o f mixed optic nerve cultures...54
2.4.4 Immunofluorescence staining...54
3.1 INTRODUCTION... 5 8
3 .2 Re s u l t s...61
3.2.1 The single-transcript vector: pFoxIV...61
3.2.1.1 Design and construction... 61
3.2.1.2 Sequencing and expression... 62
3.2.2 The dual-promoter vector: p B ird...67
3.2.3Oligodendrocyte precursor cells infected with pBird express detectable levels o f G FP...69
3.2.4 GFP expression faithfully reports co-expression o f the upstream transgene.... 71
3.2.5 Co-expression o f GFP and fi-galactosidase...72
3.2.6 Co-expression o f GFP and constitutively-active R a s...73
3.2.7 Co-expression o f GFP and p 2 7...75
3.3 Di s c u s s i o n... 77
3.3.1 The single-transcript vector: pF oxlV...7 7 3.3.2 The dual-promoter vector: p B ird...78
3 .4 Me t h o d s... 81
3.4.1 Molecular Biology...81
3.4.1.1 Common media and solutions... 81
3.4.1.2 Transformation o f bacteria by electroporation... 82
3.4.1.3 Small-scale preparation o f plasmid D N A ...83
3.4.1.4 Large-scale preparation o f plasmid D N A ...84
3.4.1.5 Common subcloning procedures... 86
3.4.1.6 Construction o f retroviral plasmids...90
3.4.2 Preparation o f retrovirus by transient transfection o f Phoenix cells...100
3.4.3 Purification o f oligodendrocyte precursor cells by immunopanning...101
3.4.4 Histochemistry fo r detection o f fi-galactosidase...102
3.4.5 In vitro culture o f purified oligodendrocyte precursor cells...103
4.1 In t r o d u c t io n...105
4 .2 Re s u l t s... 108
4.2.1 Clonal analysis o f the effects o f over-expression ofp27 in oligodendrocyte precursor cells...108
4.2.2 Over-expression ofp27 did not induce differentiation into oligodendrocytes. 109 4.2.3 Effect ofp27 on the cell-cycle time o f oligodendrocyte precursor cells 109 4.2.4 Analysis o f the effect ofp27 over-expression within oligodendrocyte precursor cell clones...114
4 .3 Di s c u s s io n... 120
4.3.1 Over-expression ofp27 is insufficient to cause cell-cycle arrest o f oligodendrocyte precursor cells and differentiation into oligodendrocytes in the absence o fT H...120
4.3.2 Over-expression ofp27 in oligodendrocyte precursor cells retards clonal expansion...121
4.3.3 Oligodendrocyte precursor cells that over-express p27 divide more slowly that wild-type cells in the same clone...122
4 .4 Me t h o d s... 126
4.4.1 Concentration o f retroviral supernatant...126
4.4.2 Infection o f mixed optic nerve cell cultures with recombinant retrovirus...126
5 DOES P27 OVER-EXPRESSION, IN THE PRESENCE OF THYROID HORMONE, ADVANCE THE TIMER?... 128
5.1 In t r o d u c t io n... 129
5 .2 Re s u l t s... 130
5.2.1 Over-expression ofp27 advances the progress o f the timer...130
5 .3 Di s c u s s io n... 134
5.3.1 Over-expression ofp27 advances oligodendrocyte differentiation by increasing the value o f the timer...134
5 .4 Me t h o d s... 141
APPENDIX: DNA SEQUENCES OF VECTORS... 152
pBabe.PURO: 5093 b p...153
pIRES-EGFP: 5162bp...155
pGimscript: 3446 bp...157
pFoxIV: 6488 b p...159
pFoxIV: sequenced 1820 bp...162
pBird: 5483 bp...163
REFERENCES... 166
Note to the reader:
Please be aware that follow ing the main body o f this thesis is an addendum.
The extra material is the result o f additional work that was carried out in
Table of Figures
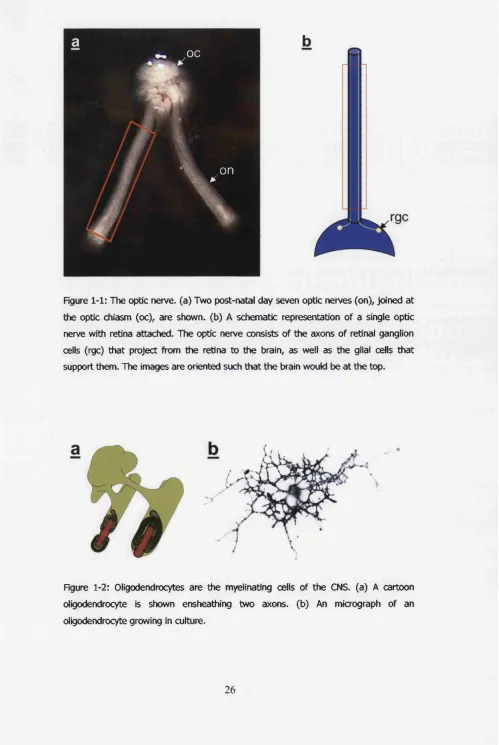
Figure 1-1: The optic nerve, (a) Two post-natal day seven optic nerves (on), joined at the
optic chiasm (oc), are shown, (b) A schematic representation of a single optic nerve
with retina attached. The optic nerve consists of the axons of retinal ganglion cells
(rgc) that project from the retina to the brain, as well as the glial cells that support
them. The images are oriented such that the brain would be at the top... 26
Figure 1-2: Oligodendrocytes are the myelinating cells of the CNS. (a) A cartoon
oligodendrocyte is shown ensheathing two axons, (b) An micrograph of an
oligodendrocyte growing in culture... 26
Figure 1-3: The oligodendrocyte precursor cell timer. The timer operates to limit the time
during which precursor cells can divide, not the number of divisions, before they
differentiate into post mitotic oligodendrocytes. Mitogens drive a timing component
that measures elapsed time, and TH triggers an effector component, which stops
division and initiates terminal differentiation, once time is up’...32
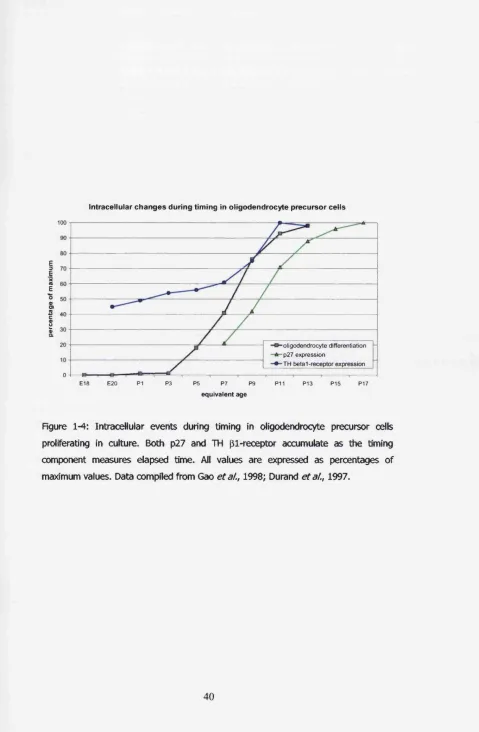
Figure 1-4: Intracellular events during timing in oligodendrocyte precursor cells
proliferating in culture. Both p27 and TH P 1-receptor accumulate as the timing
component measures elapsed time. All values are expressed as percentages of
maximum values. Data compiled from Gao et al.y 1998; Durand et al.y 1997... 40
Figure 2-1: Micrograph of oligodendrocyte precursor cells in culture that have been
transfected with a GFP expression plasmid .Mixed cultures of P7 optic nerve cells
were lipofected with 0.04|xg of pEGFP-Cl and stained for GFP (green), A2B5 (red)
and DNA (blue)... 49
Figure 2-2: Penetratin enters oligodendrocyte precursor cells. Mixed cultures of P7 optic
nerve cells were incubated with (a) or without (b) O.SpM biotinylated Penetratin for
one hour. Biotin was detected by immunocytochemistry against streptavidin-HRP
using DAB as a substrate...49
Figure 3-1: Map of pIRES-EGFP highlighting important regions of sequence... 64
Figure 3-2: Schematic map of pBabe.PURO. The gene of interest (‘X’) is expressed from
the retroviral 5'-long terminal repeat (LTR) promoter and the puromycin
resistance gene (puro**), used to select for stable integration of the provirus, is
expressed from a separate promoter... 65
Figure 3-3: Schematic map of pFoxlV. The gene of interest ('X’) is expressed from the
retroviral 5 -long terminal repeat (LTR) promoter. The 1RES, represented by a
cloverleaf structure in the transcript, allows reinitiation of translation permitting
expression of the GFP coding sequence. The puromycin resistance gene (puro*) is
expressed from a separate promoter... 65
Figure 3-4: Sequence alignment between the designed pFoxIV (‘design’) and the real
substitutions, the main feature is the large deletion that corresponds to the first
150hp of the 1RES. Matched hases are shown in black and joined by a vertical line.
Bases in red are mismatched. N = base not determined during sequencing. - = no
corresponding base...66
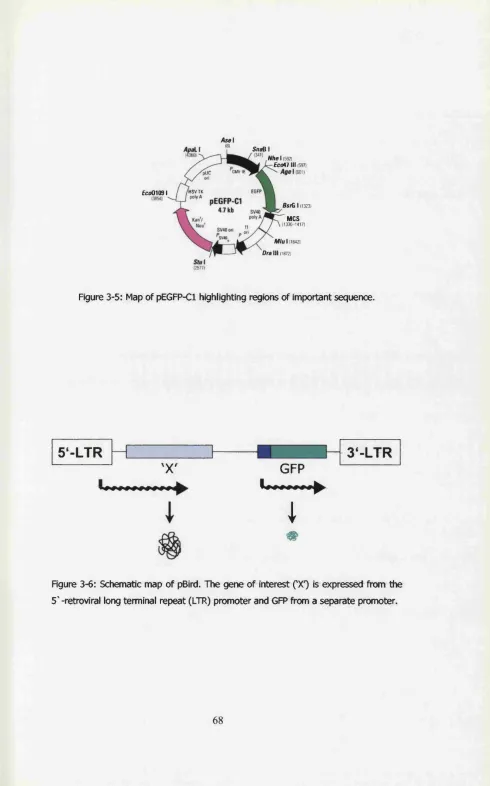
Figure 3-5: Map of pEGFP-Cl highlighting regions of important sequence... 68
Figure 3-6: Schematic map of pBird. The gene of interest (‘X’) is expressed from the
5'-retroviral long terminal repeat (LTR) promoter and GFP from a separate
promoter...68
Figure 3-7: Fluorescence micrographs of (a) an oligodendrocyte precursor cell, and (h) an
oligodendrocyte expressing GFP following infection with pBird...70
Table 3-1 - A list of retroviruses constructed and the transgenes that they contained 72
Figure 3-8: Micrographs of GFP fluorescence and P-galactosidase histochemistry. The
images show the same Beld and indicate that every cell that expresses GFP co
expresses P-galactosidase, and vice versa... 74
Figure 3-9: Micrographs of PC12 cells infected with pBird Ras. (a) Transmission image,
and (h) fluorescence image of the same field showing nuclei of all cells (blue) and
GFP in infected cells (green). Cells that express GFP exhibit a neuronal phenotype,
a consequence of expressing constitutively-active Harvey Ras...74
Figure 3-10: Fluorescence micrograph of murine optic nerve cells infected with
pBird.p27. All cells that express GFP also co-express p27; the reverse is also true. 74
Table 3-2: Compositions of common media and solutions... 81
Figure 3-11: Map of pIRES-KGFP showing the border between the 1RES and GFP
coding sequences. The schematic details the strategy used to augment the 1RES
using the polymerase chain reaction and oligonucleotide primers (arrows). The
wavy arrow depicts the region of wild-type sequence to he inserted into the vector.
... 92
Figure 3-12: Constructing a new multiple cloning site. Two, partially complementary
oligonucleotides were annealed, and double-stranded sequence was filled in with
Klenow DNA polymerase and dNTPs... 93
Figure 4-1: Over-expression of p27 in oligodendrocyte precursor cells does not elicit
oligodendrocyte differentiation in the absence of TH... I l l
Figure 4-2: Clones that over-expressed p27 contained, on average, two fewer cells than
uninfected clones growing in the same flask... I l l
Figure 4-3: Graphs showing number of cells per clone for cultures infected with either (a)
a retrovirus designed to over-express p27 and co-express GFP (pBird.p27), or (h) a
retrovirus designed to express GFP alone (pBird)...112
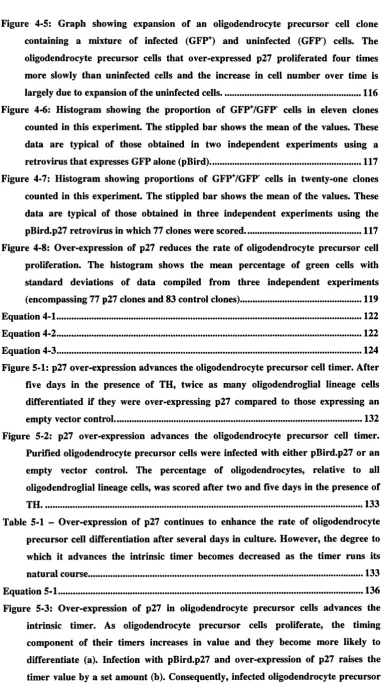
Figure 4-5: Graph showing expansion of an oligodendrocyte precursor cell clone
containing a mixture of infected (GFP ) and uninfected (GFP ) cells. The
oligodendrocyte precursor cells that over-expressed p27 proliferated four times
more slowly than uninfected cells and the increase in cell number over time is
largely due to expansion of the uninfected cells...116
Figure 4-6: Histogram showing the proportion of GFPVGFP' cells in eleven clones counted in this experiment. The stippled bar shows the mean of the values. These data are typical of those obtained in two independent experiments using a retrovirus that expresses GFP alone (pBird)... 117
Figure 4-7: Histogram showing proportions of G FP/G FP cells in twenty-one clones counted in this experiment. The stippled bar shows the mean of the values. These data are typical of those obtained in three independent experiments using the pBird.p27 retrovirus in which 77 clones were scored... 117
Figure 4-8: Over-expression of p27 reduces the rate of oligodendrocyte precursor cell proliferation. The histogram shows the mean percentage of green cells with standard deviations of data compiled from three independent experiments (encompassing 77 p27 clones and 83 control clones)... 119
Equation 4-1...122
Equation 4-2... 122
Equation 4-3... 124
Figure 5-1: p27 over-expression advances the oligodendrocyte precursor cell timer. After fîve days in the presence of TH, twice as many oligodendroglial lineage cells differentiated if they were over-expressing p27 compared to those expressing an empty vector control... 132
Figure 5-2: p27 over-expression advances the oligodendrocyte precursor cell timer. Purified oligodendrocyte precursor cells were infected with either pBird.p27 or an empty vector control. The percentage of oligodendrocytes, relative to all oligodendroglial lineage cells, was scored after two and five days in the presence of TH... 133
Table 5-1 - Over-expression of p27 continues to enhance the rate of oligodendrocyte precursor cell differentiation after several days in culture. However, the degree to which it advances the intrinsic timer becomes decreased as the timer runs its natural course...133
Equation 5-1...136
Figure 5-3: Over-expression of p27 in oligodendrocyte precursor cells advances the
intrinsic timer. As oligodendrocyte precursor cells proliferate, the timing
component of their timers increases in value and they become more likely to
differentiate (a). Infection with pBird.p27 and over-expression of p27 raises the
cells express a timer value that is artifîcially advanced with respect to control cells
and they differentiate sooner... 137
Figure 5-4: Over-expression of p27 does not significantly alter the rate of oligodendrocyte
production over time. Within the range of experimental error (thin lines) the rate of
A cknow ledgem ents
I would like to extend my gratitude to all past and present members o f
the MRC Developmental Neurobiology Programme at University College
London, all o f whom have supported and encouraged me during this work. I
am especially grateful to Valerie Wallace for spurring me forward when things
were particularly bad. I would like to thank the graduate students on the MRC
Graduate Programme with whom I have shared the experience o f a Ph.D.
course. I would also like to mention Derek Knight whose (often critical)
appraisals have served to guide me through the past three years.
Finally, I owe a special debt o f gratitude to Martin Raff who has
mentored me through this time. His wisdom and infectious enthusiasm for
science have been vital for the writing o f this thesis and will encourage me for
A bbreviations
bFGF basic fibroblast growth factor
bp base pairs
B-S Bottenstein-Sato
B SA bovine serum albumin
CDK cyclin-dependent kinase
CKI cyclin-dependent kinase inhibitor
CMV cytomegalovirus
CNS central nervous system
DAB 3,3'-diaminobenzidine
DMEM Dulbecco’s modified Eagle’s medium
DMSO dimethylsulphoxide
E embryonic day
EMCV encephalomyocarditis virus
EtBr ethidium bromide
ECS foetal calf serum
FITC fluorescein isothiocyanate
GFP green fluorescent protein
HR? horseradish peroxidase
ERES internal ribosome entry site
LTR long terminal repeat
MBT mid-blastula transition
MGS multiple cloning site
NT-3 neurotrophin-3
ODôoo optical density at 600nm
P postnatal day
p27 p 2 7 ^ : /p i
PBS phosphate-buffered saline
PCR polymerase chain reaction
PDGF platelet-derived growth factor
PDL poly-D-lysine
PFA paraformaldehyde
pRb retinoblastoma gene product
PSM presomitic mesoderm
SV40 simian virus 40
TELS Tris-buffered saline containing BSA and lysine
The ultimate goal o f developmental biology is to explain how a
multicellular body is built from a fertilised egg. This is not a trivial ambition:
from a single cell, the concerted events o f cell proliferation, cell movement,
cell differentiation and cell death serve to form an adult organism that may
contain trillions o f cells. How then, given the bewildering complexity o f this
phenomenon, can we ever hope to understand it?
Considerable effort has been devoted to the study o f developmental
biology and we are now in a position where many o f the important principles
involved are understood (Wolpert, 1996). However, despite a wealth o f
knowledge concerning the spatial regulation o f development, our
understanding o f how events are temporally co-ordinated is comparatively
poor.
The normal development o f all individuals o f an animal species follows
a precise and almost invariant schedule. This schedule may simply reflect the
time required to complete successive steps in a cascade o f contingent gene
activations and biochemical reactions. Alternatively, each cell o f the animal
may measure elapsed time autonomously in the form o f a programme that
dictates the possible activities that the cell may undertake, whether or not it is
destined to do so.
Several examples are known where cells appear to monitor the passage
o f time before initiating specific developmental changes. During muscle
formation in Xenopus laevis, muscle-specific actin genes are activated at the
mid-gastrula stage o f development, in response to signals transmitted from
competent to respond to these inductive signals throughout the seven-hour
period o f the morula and blastula stages they only need to be exposed to the
signals for two hours for muscle determination to occur. Irrespective o f when
the signal is received during the responsive period, actin-gene transcription
always begins at the mid-gastrula stage. Thus, if the signal is given early in the
blastula stage, the delay before actin expression occurs is nine hours. If,
however, the signal is made to occur at the late blastula/early gastrula stage, the
delay is only five hours (Gurdon et aL, 1985). These experiments suggest that
embryonic cells are capable o f measuring the time elapsed since fertilisation
and initiate muscle development according to a timetable o f events that is
somehow hardwired into their physiology.
A cell intrinsic timer has been proposed to operate during erythroid
development. In primates and some ruminants, the pattern o f globin gene
expression changes from a foetal form (azTz) to a adult form (a2P2) shortly
after birth (Bard, 1975). The switch occurs at every site o f erythropoiesis
(Wood and Weatherall, 1973) with identical chronology in all individuals o f
the same species, and independently o f the time o f parturition (Wood et a l ,
1976; Wintour et a l , 1985). This strongly suggests that the timing o f the switch
is measured relative to the time o f conception, or to some other event that is
triggered at a specific stage during embryogenesis.
Further studies have revealed that the timing o f the foetal-to-adult
switch o f globin gene expression is governed by an autonomous mechanism
that operates in erythroid progenitor cells. If haematopoietic stem cells are
transplanted from feotal sheep into irradiated adult recipients, the transplanted
not to the age o f the host (Zanjani et a l , 1979). In vitro clonal analysis o f
hybrid cells, formed by fusion o f foetal liver cells and mouse erythroleukaemia
cells, shows that the timing o f the switch in globin gene expression depends
solely upon the age o f the animal from which the liver cells were obtained
(Papayannopoulou et a l , 1986; Melis et a l , 1987). It is now understood that
the switch in globin gene expression is mediated by a large region o f DNA
sequence proximal to the ^-globin gene cluster, termed the locus control region
(Blom van Assendelft et a l , 1989; Enver et a l , 1990). Despite much progress
in understanding the molecular basis for globin-gene switching (Townes and
Behringer, 1990; Patient et a l , 1987), the nature o f the timer that triggers the
switch remains undetermined, largely because o f problems in experimentally
manipulating the switching event.
These examples show that during development cells record the passage
o f time to initiate developmental events on schedule. How is time measured by
biological systems? Man-made chronometers are classified into two groups,
depending on the type o f timing mechanism that they employ. Oscillators, such
as the pendulum o f a grandfather clock, operate by maintaining a cyclical
period o f fixed duration. Hourglass timers, on the other hand, measure time
using a rate-limited process that reaches a threshold after a defined interval.
Biological chronometers can also be classified as clocks or timers,
respectively, depending upon whether they employ oscillators or rate-limiting
processes as the driving force for the counting mechanism (Pourquie, 1998;
chronometry where studies have uncovered details o f the molecular basis o f the
timing process.
Cells are the unit o f existence for all life on Earth, and new cells arise
only by the division o f existing ones. The cell division cycle is an intracellular
biochemical oscillator, based upon the serial activation o f a family o f protein
kinases that depend upon the periodic expression o f cyclins for their activity.
These so-called cyclin-dependent kinases (CDKs) drive the cycle by
phosphorylating important targets, such as the retinoblastoma gene product
(pRb; Weinberg, 1995) and replication licensing factors (Coue et a l , 1996).
The cycle is reset by dephosphorylation and ubiquitin-dependent protein
degradation (Morgan, 1995; King et a l , 1996). Early developmental cell cycles
proceed without gap phases, and consist only o f rapidly alternating S and M
phases, which are controlled by the degradation and synthesis o f cyclins A and
B (Newport and Kirschner, 1984; King et a l , 1994). In principle, this
fundamental biological clock could be used by cells to measure the passage o f
time, with events being scheduled after the completion o f a given number of
cell divisions.
Some developmental processes use the cell cycle oscillator to measure
elapsed time. During the early embryogenesis o f insects and vertebrates,
zygotic gene transcription begins at a defined time, which is known as the
mid-blastula transition (MBT; Newport and Kirschner, 1982b; Newport and
Kirschner, 1982a). In many animal species, in which the egg contains a large
quantity o f maternal material, cell divisions occur initially without much
following each cell cycle. The MBT is thought to be triggered when specific
maternal factors are titrated below a critical amount as a result o f successive
cell divisions and the concomitant rise in the nucleo-cytoplasmic ratio (Sibon et
a l , 1997; Pritchard and Schubiger, 1996; Prioleau e t a l , 1994).
Another developmental process that is thought to use the cell cycle as a
device for measuring time is the progressive opening o f Hox gene clusters
during organogenesis (Duboule, 1994a; Duboule, 1994b). Hox genes encode
transcription factors, which define the positional identity o f embryonic
segments along both the antero-posterior axis o f the body and the
proximo-distal axis of the limbs. Their spatial expression pattern is collinear with their
arrangement along the chromosome, such that a gene located more 3' is
expressed anterior to its 5' neighbour. The expression pattern o f Hox genes also
exhibits temporal collinearity, with genes located at the 3' end o f the cluster
being expressed earlier than genes located more 5'.
From studies on the developing limb, it has been proposed that the
progressive and unidirectional opening o f the Hox gene cluster, which dictates
the patterns o f collinearity, depends upon successive cell divisions. The rate at
which cells are proliferating determines how much o f the Hox cluster is
opened, starting from the 3' end, before they stop dividing and differentiate.
Cells at the distal tip o f the limb maintain a higher rate o f proliferation and
therefore express more 5' genes than cells from the proximal zone. Once cells
stop proliferating the state o f the Hox cluster is frozen so that the pattern o f
gene expression is maintained. During the putative opening o f the cluster, it is
proposed that certain proteins, which occlude the D N A from the transcriptional
divisions titrate out these proteins resulting in their progressive depletion
proceeding from the 3' to 5' genes (Kondo et a l , 1998).
The timing o f the MBT and the temporal regulation o f Hox gene
expression appears to be mediated by a mechanism that depends upon the cell
cycle clock. There is an obligate relationship between the timing o f these
processes and continued cell division. However, many examples o f biological
timing devices use alternative methods o f metering time.
Circadian rhythms are changes in the biochemistry and behaviour o f
organisms that occur with a period o f about one day (Menaker et a l , 1978).
They are ubiquitous in nature, being found up and down the phylogenetic tree,
from humans to cyanobacteria (Dunlap, 1999). These rhythms are generated by
an intracellular timekeeping mechanism referred to as the circadian clock. The
circadian clock consists o f an intracellular oscillator in which transcription
factors, most notably the products o f the period and timeless genes, once
synthesised, feedback to inhibit their own expression (Rosbash et a l , 1996;
Rosbash, 1995). Subsequently, transcription o f the period and timeless genes is
re-activated by positively acting factors, including another transcription factor
encoded by the gene clock (Wilsbacher and Takahashi, 1998). This cycle forms
the kernel o f the circadian clock, which is proposed to operate in all cells o f an
organism (Rosbash, 1998), and has a period o f approximately 24 hours.
In principle, the circadian clock could be involved in the timing o f
events during development and postnatal maturation. However, this seems
unlikely, at least in animals, as mutations that disable the circadian clock in
An intracellular clock operating during development that does not count
cell cycles has been discovered recently, and is associated with vertebrate
somitogenesis (reviewed in Cooke, 1998). Remarkably, the existence o f such
an clock had been predicted by theoretical models some decades earlier
(Meinhardt, 1986; Cooke, 1975).
Somites are the most obvious manifestation o f segmentation during
vertebrate development, and ultimately give rise to the vertebral column and
the skeletal muscle o f the trunk. They consist o f small balls o f epithelial cells
that form by the progressive bilateral budding o f presomitic mesoderm (PSM).
In the developing chick, a new pair o f somites buds from the PSM every 90
minutes. In situ hybridisation analysis o f c-hairyl, a chick homologue o f the
Drosophila pair-rule gene hairy, revealed that its mRNA was expressed
dynamically, with a period o f exactly 90 minutes, appearing as a wavefront that
swept through the PSM (Palmeirim et a l , 1997). In the time between passing
through the blastopore lip and budding into a somite, every cell o f the PSM
undergoes 12 cycles o f c-hairyl expression. The cycles o f expression are not a
result o f cell movement; neither are they propagated by signalling through the
PSM. Rather, they are an intrinsic property o f the constituent cells. Blocking
protein synthesis does not effect the cycling o f c-hairyl expression, suggesting
that the segmentation clock does not rely on unstable proteins or transcriptional
cycles. It is likely that c-hairyl is not a core component o f the oscillator but,
instead, an output o f that mechanism. Since these initial observations, the
expression o f several other genes has been found to oscillate during
1998). However, the mechanism by which the output o f the clock controls the
timing o f somite budding remains unclear (McGrew and Pourquie, 1998).
In the nematode Caenorhabditis elegans a set o f genes has been
identified that controls the temporal pattern o f development o f several lineages
in the larva (Chalfie et a l , 1981; Ambros and Horvitz, 1984). Mutations in
these genes produce a heterochronic phenotype: events that usually occur at
specific developmental stages occur either earlier or later than normal. Just as
homeotic mutations cause cells to adopt fates normally expressed in different
positions (Lewis, 1978), heterochronic mutations cause cells to adopt fates
normally expressed at different times. The heterochronic genes determine the
temporal fate o f cells that have equivalent developmental potential but are
generated at successive stages. Two o f the heterochronic genes encode
intracellular proteins whose expression progressively decreases during larval
development. The decrease is regulated by a third heterochronic gene that
encodes two small antisense RNAs. These RNAs inhibit the expression o f the
other heterochronic genes by binding to the 3' untranslated regions o f their
messenger RNAs, blocking translation (reviewed in Ambros and Moss, 1994).
It is unclear what controls expression o f the antisense RNAs during
development. Heterochronic genes have been identified in many organisms,
including plants (Dudley and Poethig, 1991), Dictyostelium (Simon et a l ,
1992), and fungi (Mirabito et a l , 1989). In Drosophila, the anachronism locus
is responsible for the timing o f neuroblast proliferation and differentiation.
W hile certain neuroblasts divide precociously in anachronism mutants, other
developmental timing events appear normal (Ebens et a l , 1993). In humans,
gain-of-function mutations in the luteinising hormone receptor results in precocious
male puberty (Laue et al., 1995). Conversely, loss-of-function mutations result
in pseudohermaphroditism and failure to develop secondary sexual
characteristics, which can be interpreted as a retarded expression o f pubescent
cell fates (Kremer et a l , 1995). It remains a mystery how the timing o f the
luteinising hormone receptor is controlled to regulate the timing o f puberty.
During development, the precursor cells o f many lineages divide a
limited number o f times before they exit the cell cycle and terminally
differentiate. What determines when these cells stop dividing, often in the
continued presence o f mitogens? The simplest explanation for this
phenomenon is that cells count successive cell divisions and stop dividing after
a certain number (Temple and Raff, 1986; Quinn et a l , 1985). However,
despite this attractively straightforward explanation, experimental data
supporting the theory is lacking. For example, blocking the early cleavage
divisions in ascidians or C. elegans does not stop the appearance o f certain
differentiation markers at the appropriate times (Satoh, 1979; Laufer et a l ,
1980). Similarly, degradation of maternal cyclin A and E messenger RNAs
prior to gastrulation in Xenopus is a cell-intrinsic event that is timed
independently o f the cell cycle and macromolecular synthesis (Howe and
Newport, 1996; Howe et a l , 1995). These results suggests the existence o f a
developmental timer that measures the time elapsed since fertilisation, and then
activates maternal mRNA degradation at the onset o f gastrulation. More
remarkably, Xenopus embryos treated with D N A synthesis inhibitors at the
and early neuronal determination in absence o f any further cell division (Harris
and Hartenstein, 1991).
Early studies by Raff and colleagues provided the first evidence for the
existence o f cell-intrinsic timers in the developing vertebrate central nervous
system (CNS; Williams et a l , 1985; Abney et a l , 1981). If embryonic day 13
(E13) rat brains are dissociated and the cells cultured in vitro, one finds that the
three major classes o f macroglial cells develop three days earlier than when
cultures are prepared from ElO brains. Moreover, the timing o f the first
appearance o f the various cell types in culture matches the time when these
cells are first detected in vivo. These findings suggest that the timing o f glial
differentiation depends on mechanisms that operate independently o f CNS
morphogenesis, enabling the study o f the timing mechanisms involved in
culture.
The vertebrate brain is an exceptionally complicated organ, containing
billions of cells, including a plethora o f different neuronal cell types and the
glia that support them. To simplify the problem, studies were continued in one
o f the simplest parts o f the CNS, the optic nerve, which develops from an
extension o f the neural tube called the optic stalk (Raff, 1989). The optic nerve
is simple because it does not contain any neuronal cell bodies or synapses
(figure 1-1). It contains the axons o f retinal ganglion cells, that project from the
retina to the brain, and two major types o f macroglial cell, astrocytes and
oc
\
. ° "X
Figure 1-1: The optic nerve, (a) Two post-natal day seven optic nerves (on), joined at the optic chiasm (oc), aœ shown, (b) A schematic representation of a single optic nerve with retina attached. The optic nerve consists of the axons of retinal ganglion cells (rgc) that project from the retina to the brain, as well as the glial oeHs that support them. The images are oriented such that the brain would be at the top.
The only known function o f oligodendrocytes is to myelinate axons in
the vertebrate CNS, ensuring rapid and efficient neurotransmission (Peters et
a l , 1990; Peters and Vaughn, 1970; Bunge, 1968). Unlike Schwann cells,
which are responsible for myelination in the periphery and myelinate only one
axon each, oligodendrocytes often ensheathe multiple axons (figure 1-2). The
role o f astrocytes is less clear, although many different functions have been
proposed, such as guiding migrating neurones (Rakic, 1971) and growth cones
(Silver and Sapiro, 1981; Silver et a l , 1982) during development, the induction
o f the formation o f the blood brain barrier (Janzer and Raff, 1987), the control
o f extracellular ion composition (Hertz, 1981), the production o f mitogens
during development (Raff et a l , 1988), and the formation o f glial scars
following injury (Maxwell and Kruger, 1965; Vaughn and Pease, 1970).
Commitment to the oligodendrocyte lineage occurs in the ventricular
zone o f the neuroepithelium (Ono et a l , 1995). The earliest oligodendrocyte
precursor cells, which can be identified by expression o f platelet-derived
growth factor (PDGF) a-receptors, originate in a discrete region o f the neural
tube (Pringle and Richardson, 1993). This specialised domain comprises two
narrow, longitudinal columns o f neuroepithelial cells along each side o f the
ventral midline. Induction o f this region o f the neuroepithelium to become
oligodendrocyte precursor cells appears to be mediated by signals from the
notochord, including Sonic hedgehog (Orentas et a l , 1999; Orentas and Miller,
1996; Pringle et a l , 1996). After their first appearance, at around E14 in the rat
spinal cord, the PDGFa-receptor^ cells proliferate and migrate away from the
cord between E16 and E18 (Pringle and Richardson, 1993). Oligodendrocyte
precursor cells that are destined to populate the optic nerve arise in a restricted
region o f the ventral ventricular zone o f the third ventricle, which overlies the
optic chiasm, first appearing at stage 26-27 in the developing chick and
migrating to the chiasm-end o f the nerve by stage 29 (Ono et a l , 1997).
In the rat, oligodendrocyte precursor cells actively migrate into the
developing optic nerve, from the brain, beginning before birth, but do not
become evenly distributed along the nerve until the beginning o f the second
post-natal week (Small et a l , 1987). Precursor cells are prevented from
entering the retina by a dense plug o f astrocytes at the boundary with the sclera
termed the lamina cribosa (Ffrench-Constant et a l , 1988; Berliner, 1931).
The first oligodendrocytes appear in the rat optic nerve on a predictable
schedule, beginning on the day o f birth (Miller et a l , 1985) and increasing in
number for the following six weeks (Skoff et a l , 1976; Barres et a l , 1992a).
The adult rat optic nerve contains about 100,000 axons (Lam et a l , 1982) and
about 300,000 oligodendrocytes (Barres et a l , 1992a). The final number o f
oligodendrocytes in the nerve depends upon the number o f precursor cells that
migrate into the nerve, the number o f times the precursor cells divide before
they terminally differentiate, and the number o f oligodendrocytes and
precursors that undergo programmed cell death (Barres et a l , 1992a).
What determines the timing o f oligodendrocyte development in the
previously known as 0 -2 A progenitor cells^ (Raff et a l , 1983). When
oligodendrocyte precursor cells are cultured in serum-free medium in the
presence o f survival signals, but in the absence o f mitogens, they immediately
stop dividing and differentiate into oligodendrocytes (Temple and Raff, 1985;
Barres et a l , 1994). They can be stimulated to divide by several mitogens, but
PDGF is the most important, both in vitro (Noble et a l , 1988; Raff et a l , 1988)
and in vivo (Calver et a l , 1998). In mice in which the P D GF A gene has been
inactivated, oligodendrocyte precursor cells do not proliferate and very few
oligodendrocytes develop (Fruttiger et a l , 1999). Both astrocytes (Noble et a l ,
1988; Raff et a l , 1988) and retinal ganglion cells (Mudhar et a l , 1993)
synthesise PDGF-AA, although the astrocytes seem to be the major source the
developing optic nerve (Calver et a l , 1998). In the embryonic mouse spinal
cord, the total number o f oligodendrocyte precursor cells is controlled largely
by competition for a limiting amount o f PDGF (Fruttiger et a l , 1999).
The normal timing o f oligodendrocyte development can be
reconstituted in cultures o f dissociated embryonic or perinatal optic nerve cells,
as long as the precursor cells are stimulated to proliferate by either astrocytes
(Raff et a l , 1985) or PDGF (Raff et a l , 1988). The reason why
oligodendrocyte precursor cells ultimately stop dividing and differentiate in
such cultures is not because PDGF becomes limiting or that PDGF receptors
^ They were given this name because, under certain conditions, oligodendrocyte precursor cells
can give rise to so-called type-2 astrocytes. However, there is little evidence to suggest that the
precursor cells normally develop into type-2 astrocytes in vivo (Grove et a l, 1993; Fulton et
disappear or can no longer be activated. Adding excess PDGF to the cultures
does not change the timing o f oligodendrocyte differentiation (Raff et a i ,
1988), and newly formed oligodendrocytes still express PDGF receptors (Hart
et a i , 1989b), which can induce both an increase in cytosolic Ca^"^ (Hart et al.,
1989a) and immediate-early gene expression (Hart et a l , 1992).
Clonal analysis o f single (Temple and Raff, 1986) or purified (Barres et
a l , 1994) oligodendrocyte precursor cells suggest that a cell-intrinsic timer is
important for governing when a precursor cell will stop dividing and
differentiate, at least in culture. Precursor cells isolated from postnatal day
seven (P7) optic nerves divide between zero and eight times before they stop
dividing and terminally differentiate into post-mitotic oligodendrocytes (Barres
et a l , 1994). Moreover, if the two daughter cells o f an individual precursor cell
are sub-cultured into separate micro wells, they tend to undergo the same
number o f divisions before they stop dividing and differentiate into
oligodendrocytes (Temple and Raff, 1986). These findings suggest that a
timing mechanism operates in the precursor cells to limit their proliferation,
and that the timer is an intrinsic property o f individual cells. The heterogeneity
in the number o f divisions that different precursor cells undergo before
differentiating is believed to reflect a variation in the maturation o f precursor
cells that occurred in vivo prior to isolation, as embryonic precursor cells divide
many more times on average than do postnatal precursors (Gao and Raff,
1997). The finding that precursor cells cultured at 33°C divide more slowly but
stop dividing and differentiate earlier, after fewer divisions, than at 37°C
suggests that the timer does not operate by counting cell divisions but instead
The intrinsic timer consists o f at least two components - a timing
component that measures the elapsed proliferative time, and an effector
component that triggers differentiation once the timing component signals that
‘time is up’ (figure 1-3; Barres et a l , 1994; Bogler and Noble, 1994).
Mitogens, such as PDGF, drive the timing component o f the timer and
hydrophobic signals, such as thyroid hormone (TH), are required for the
effector mechanism to operate normally. For example, if oligodendrocyte
precursor cells are purified from the optic nerve o f P8 rats, and are cultured at
clonal density in the presence o f mitogens and TH, they divide up to eight
times before they differentiate into oligodendrocytes. Differentiation occurs
synchronously within clones, such that after a few days, some clones will be
entirely composed o f post-mitotic oligodendrocytes whereas others, in the
same culture dish, contain only proliferating precursor cells. B y contrast, if the
cells are cultured in the presence o f mitogens but in the absence o f TH most o f
them continue to divide more than eight times and few differentiate into
oligodendrocytes. However, if TH is added to these cultures after eight days,
by which time almost all of the cells would have differentiated had TH been
present all along, then most o f the cells stop dividing and differentiate within
four days, suggesting that TH is not required for the timing component o f the
timer to operate (Barres et a i , 1994). Bogler and Noble provided independent
evidence for distinct timing and effector components, using a combination o f
PDGF and basic fibroblast growth factor (bFGF), rather than an absence o f TH,
/
/
/
/
/
/
^ /
/
/
/
/
/
/
/
/
time ->
It seems likely that the intrinsic timer that operates in culture also
governs the schedule o f oligodendrocyte development in vivo. The timely
development o f oligodendrocytes in culture, which relies on the normal
operation o f the timer, matches the schedule observed in vivo (Raff, 1989; Raff
et a i , 1985). Delivery o f surplus PDGF to P8 rat optic nerves does not increase
the proliferation o f oligodendrocyte precursor cells in the nerve (Barres et a l ,
1992b), suggesting that the precursors do not normally stop dividing and
differentiate due to limiting concentration o f mitogen, at least at this stage o f
development. Oligodendrocyte precursor cells purified from embryonic optic
nerves tend to divide in culture for a longer time than precursor cells isolated
from post-natal animals, suggesting that the timing component o f the timer
records the duration o f the proliferative period in vivo (Gao and Raff, 1997).
Lineage analysis o f the developing CNS, using a retrovirus that indelibly labels
cells and their progeny with |3-galactosidase, suggested that clusters o f labelled
oligodendrocyte-lineage cells contained either oligodendrocytes or precursors,
but never both. (Grove et a l , 1993). These results suggest that differentiation
o f oligodendrocyte precursor cells in the developing CNS occurs
synchronously, as it does in vitro (Temple and Raff, 1986), providing the
strongest evidence for the operation o f the timer in vivo.
Although the timer may operate in precursor cells in vivo, there are
probably many additional factors that control the timing o f oligodendrocyte
development in the optic nerve. For example, the Notch signalling pathway,
whose components are expressed in the optic nerve during development, has
been shown to influence the differentiation o f oligodendrocyte precursor cells
TH is required for the normal development o f oligodendrocytes in the
optic nerve: hypothyroid rats (Ahlgren et a l , 1997; Ibarrola and
Rodriguez-Pena, 1997) and mice (Ahlgren et a l , 1997) have many fewer oligodendrocytes
in their optic nerves at P7 than do wild-type animals. In addition to its effects
on oligodendrocyte precursor cells, TH also has effects on the maturation o f
oligodendrocytes: for example, hyperthyroidism accelerates myelination
whereas hypothyroidism delays it (Dussault and Ruel, 1987; Warringa et a l ,
1987). TH influences the differentiation and maturation o f precursor cells o f
many vertebrate lineages, including brain, lung, muscle, bone and erythroid
progenitor cells (Oppenheimer, 1991; Legrand, 1986; Schwartz, 1983).
Myoblasts and erythroid progenitor cells appear to use counting mechanisms
similar to oligodendrocyte precursor cells (Quinn et a l , 1985; Allen and
Dexter, 1982; Dainiak et a l , 1978). The rodent thyroid gland becomes active
before birth and TH levels progressively increase during the first postnatal
weeks in the rat (Puymirat, 1992; Dussault and Ruel, 1987; Samel, 1968). TH
is well suited, therefore, to co-ordinate events, such as oligodendrocyte
development and myelination, that occur during this period. The possibility
exists that TH may help the systemic co-ordination o f vertebrate development,
especially at the stage o f organogenesis, just as it orchestrates the events of
amphibian metamorphosis (Gilbert and Frieden, 1981; Shi et a l , 1996; Tata,
1993).
The sensitivity o f oligodendrocyte precursor cells to the effects o f TH
progressively increases with time as the proliferate in culture. Precursors
isolated from the optic nerves o f P14 rats are more sensitive to TH than PI
a l , 1994). Part o f the intrinsic timer appears to involve an accumulation o f TH
P-receptors: the expression increases in perinatal precursor cells, in the absence
o f TH, and reaches a plateau at a time when most cells would have
differentiated (figure 1-4). Moreover, the rate o f accumulation is faster when
precursor cells are cultured at 33°C than at 37 °C, conditions where the timing
component o f the timer runs faster (Gao et a l , 1998).
How might the intrinsic timer measure elapsed time, and how does it
stop the cell cycle and initiate terminal differentiation once time is up?
Whatever the mechanism, it is likely to interact eventually with the
intracellular machinery that controls progression through the cell cycle. In
principle, the timer could depend upon: (1) the decay o f stimulatory proteins,
such as cyclins or CDKs, that normally drive progress through the cell cycle;
(2) the accumulation o f inhibitory proteins, such as the CDK inhibitors (CKIs),
that act to retard progress through the cell cycle; or (3) both o f these
mechanisms. It seems most likely that both o f these mechanisms are involved
as this would ensure that the stopping mechanism is more robust.
The eukaryotic cell cycle is controlled by a family o f CDKs that are
cyclically activated to trigger the different phases o f the cell cycle at the right
time and in the correct order (Sherr, 1994; Morgan, 1995; Lees, 1995). The
decision to initiate cell division is made in the first gap phase o f the cycle (Gi):
once cells pass through a restriction point in Gi they are committed to undergo
another round o f the division cycle (Pardee, 1989). In making this choice, cells
integrate a wide variety o f extracellular signals, such as growth factors,
mitogen antagonists, differentiation inducers, and spatial cues. Without
Gi, and become quiescent. Mitogens stimulate the synthesis o f D-type cyclins,
and the assembly o f cyclin D/CDK4 and cyclin D/CDK6 holoenzymes
stimulate the cell to re-enter the cycle and progress through Gi into S phase.
Inhibition o f the cell cycle in Gi is, in part, mediated by CKIs, which
bind to and inhibit CDKs. The CKIs have been divided into two families based
upon their structures and CDK targets. The first class includes the INK4
proteins, so-named for their ability to inhibit the catalytic subunits o f ÇDK4
and CDK6, specifically plb^”^'^" (Serrano et a l , 1993), (Hannon and
Beach, 1994), (Guan et al., 1994), and p l9 “ ''‘' (Chan et a l , 1995). The
second class comprises the more broadly acting Cip/Kip family o f proteins that
affect the activities o f cyclin D-, E-, and A-dependent kinases. The latter class
includes p21^'^^ (Gu et a l , 1993; Harper et a l , 1993; el-Deiry et a l , 1993;
Xiong et a l , 1993; Dulic et a l , 1994; Noda et a l , 1994), p27^'^^ (Polyak et a l ,
1994a; Polyak et a l , 1994b; Toyoshima and Hunter, 1994), and p57^'^^ (Lee et
a l , 1995; Matsuoka et a l , 1995), which bind to both cyclin and CDK subunits.
Over-expression o f these proteins in various cell lines arrests the cell cycle in
Gi (Sherr and Roberts, 1995; Hunter and Pines, 1994). Moreover, several CKIs
are up-regulated when developing cells exit the cell cycle, suggesting a
possible role in stopping proliferation at the appropriate time (Harper and
Elledge, 1996; Jiang et a l , 1994; Steinman et a l , 1994). In yeast, for example,
the CKl Earl mediates cell-cycle arrest mediated by mating pheromone (Peter
and Herskowitz, 1994). An increase in p21 expression is associated with
cell-cycle exit prior to terminal differentiation in several mammalian lineages,
including kératinocytes (Harvat et a l , 1998) and myocytes (Walsh and
senescence o f fibroblasts proliferating in culture, which can be viewed as a
special kind o f terminal differentiation, is associated with the accumulation o f
p l6 (Palmero et a l , 1997; Hara et a l , 1996; Serrano et a l , 1996; Hayflick,
1965). Cell-cycle arrest has been associated with an increase in p27 expression
in various circumstances, such as contact inhibition and treatment with TGFp
(Sherr and Roberts, 1995; Polyak et a l , 1994a). Levels o f p27 are high in many
tissues where cells are exiting the cell cycle and terminally differentiating
(Kato e t a l , 1994; Nourse e t a l , 1994).
Several lines o f evidence suggest that the accumulation o f the p27 is
part o f the timer in oligodendrocyte precursor cells (Durand et a l , 1998;
Durand et a l , 1997). First, p27 expression is high in all oligodendrocytes,
whereas it is variable in their precursors. Second, when precursor cells are
deprived o f PDGF in culture, the rate at which p27 rises is indistinguishable
from the rate at which the cells commit to cell-cycle withdrawal and
differentiation, raising the possibility that p27 is part o f the effector mechanism
that stops the cell cycle. Third, p27 progressively accumulates as precursor
cells proliferate in culture in the presence o f PDGF but in the absence o f TH,
even though most cell do not stop dividing and differentiate in these conditions.
It reaches a plateau o f expression at around the same time that most precursor
cells would have stopped dividing and differentiated into oligodendrocytes had
TH been present, suggesting that the progressive rise in p27 expression is part
o f the timing component (figure 1-4). The level o f p27 expressed by precursor
cells also rises as they proliferate in vivo (Yasuhito Tokumoto, unpublished
observations). Since the cells in culture continue to proliferate with this high