Probing Dust Settling in Proto-planetary Disks with ALMA
Yann Boehler1,3,a, Anne Dutrey2,b, Stéphane Guilloteau3,c, and Vincent Piétu3,d
1Centro de Radioastronomıa y Astrofısica, UNAM, Apartado Postal 3-72, 58089 Morelia, Michoacan, Mexico 2Univ. Bordeaux, LAB, UMR 5804, F-33270, Floirac, France
3CNRS, LAB, UMR 5804, F-33270 Floirac, France
4IRAM, 300 rue de la Piscine, 38400 Saint Martin d’H‘eres, France
Abstract. Investigating the dynamical evolution of dust grains in proto-planetary disks is a key issue to understand how planets should form. We identify under which con-ditions dust settling can be constrained by high angular resolution ALMA observations at mm wavelengths, and which observational strategies are suited for such studies .We find out that an angular resolution better than or equal to » 0.1” (using 2.3 km baselines at 0.8mm) allows us to constrain the dust scale height and flaring index with sufficient precision to unambiguously distinguish between settled and non-settled disks, provided the inclination is close enough to edge-on (i>75◦
). Ignoring dust settling and assuming hydrostatic equilibrium when analyzing such disks biase the derived dust temperature, the radial dependency of the dust emissivity index and the surface density distribution.
1 Introduction
Grain growth and dust settling are two key ingredients in the planets formation process. Settling will speed up the growth process by favouring grain collisions, firstly by increasing the relative vertical velocities, as settling acts differently in function of the dust dynamic properties [1], and secondly by concentrating dust close to the midplane. On top of that, a high dust to gas ratio in this area, can affect the gravitational stability and control the initial step of the formation of planetesimals [2]. Contrary to other shortest wavelenghts, the moderate opacity of the mm/submm domain allows dust mass estimate and should accordingly probe material throughout the complete disk structure. In this paper, we then study the impact of dust settling on the disk imaging at mm wavelengths, in order to define adequate observational strategies to constrain this phenomenon with ALMA.
2 Methods
We investigate here potential way to distinguishanysettled disk fromanynon-settled one. Our ap-proach is to analyze simulated images of settled disks with non-settled, homogeneous disk models. Under this approach, settled disks may result in very unusual parameters which cannot be ascribed
ae-mail: [email protected]
be-mail: Mailaddressforsecondauthorifnecessary ce-mail: Mailaddressforlastauthorifnecessary de-mail: Mailaddressforlastauthorifnecessary DOI: 10.1051/epjconf/20134602002
© Owned by the authors, published by EDP Sciences, 2013
This is an Open Access article distributed under the terms of the Creative Commons Attribution License 2.0, which permits unrestricted use, distribution, and reproduction in any medium, provided the original work is properly cited.
Table 1.Disk physical parameters for a 1 solar mass.
Physical characteristics Adopted values
type of grains Moderate (≤3 mm) or Large (≤10 cm) gas scale height Hydrostatic Equilibrium
Averaged Gas/Dust 100
Kinetic and Dust Temperature Tk(r)=30 r
R0 −0.4
Kelvin Reference and Inner radius R0=100 AU andRint=3 AU
Truncated disk
Gas Surface Density (g.cm−2) 4.35 r R0
−1
withRout=100 AU
Tapered disk
Gas Surface Density (g.cm−2) 17.4r R0
−0.5
.exp(RR
c)
1.5withR
c=50 AU
to “normal” non-settled disks. For example, the dust scale heightH0 should be small, as well as the
flaring indexh, in comparison with the hydrostatic scale height.
2.1 Disk Description
The disks parameters are representative of the disks studied by [3] and are given in Table 1. The disks are in hydrostatic equilibrium with no vertical temperature gradient and orbit around a 1Mstar. In the truncated model, the gas surface density is a simple power law with sharp inner and outer radius. In the viscous model, the density is tapered by an exponential outer edge. Both models have the same total (gas+dust) disk mass is 0.03 solar mass. Each disk has been imaged at 4 inclination angles (90◦,
85◦, 80◦and 70◦).
2.2 Dust Properties
2.2.1 Dust emissivity
The dust emissivity as a function of frequency depends on the dust size distribution and grain compo-sition. Given the important unknowns in the dust geometry and composition, we have elected to use a parametric method to model. Our dust emissivity model is based on two asymptotes: one at small wavelengths (a λ) where the absorption coefficient is dictated by the geometrical cross section,
and another at long wavelengths (aλ) for which a power law applies. These two regimes are then connected by a resonance region nearλ=2πa, caracterized by its height and width.
The minimum grain size was 0.01µm and the maximum grain size 3 mm for the moderate grain model or 10 cm for the large grain model. The dust size distribution was represented by a power law of index pd = 3 and with the constant densityρd = 1.5 g.cm−3. In the example presented in these
proceedings, the parameters have been adjusted in order to match the dust properties used by [4].
2.2.2 Dust settling
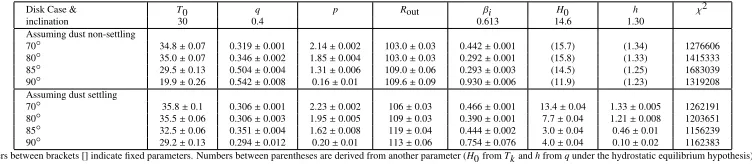
Table 2.Minimizations of a tapered settled disk by an homogeneous truncated one: moderate size grains
Disk Case & T0 q p Rout βi H0 h χ2
inclination 30 0.4 0.613 14.6 1.30
Assuming dust non-settling
70◦ 34.8±0.07 0.319±0.001 2.14±0.002 103.0±0.03 0.442±0.001 (15.7) (1.34) 1276606 80◦ 35.0±0.07 0.346±0.002 1.85±0.004 103.0±0.03 0.292±0.001 (15.8) (1.33) 1415333 85◦ 29.5±0.13 0.504±0.004 1.31±0.006 109.0±0.06 0.293±0.003 (14.5) (1.25) 1683039 90◦ 19.9±0.26 0.542±0.008 0.16±0.01 109.6±0.09 0.930±0.006 (11.9) (1.23) 1319208 Assuming dust settling
70◦ 35.8±0.1 0.306±0.001 2.23±0.002 106±0.03 0.466±0.001 13.4±0.04 1.33±0.005 1262191 80◦ 35.5±0.06 0.306±0.003 1.95±0.005 109±0.03 0.390±0.001 7.7±0.04 1.21±0.008 1203651 85◦ 32.5±0.06 0.351±0.004 1.62±0.008 119±0.04 0.444±0.002 3.0±0.04 0.46±0.01 1156239 90◦ 29.2±0.13 0.294±0.012 0.20±0.01 113±0.06 0.754±0.076 4.0±0.04 0.10±0.02 1162383 Numbers between brackets [] indicate fixed parameters. Numbers between parentheses are derived from another parameter (H0 fromTkandhfromqunder the hydrostatic equilibrium hypothesis). The
second row indicates the expected values of the parameters.
The main factor controlling the degree of settling is the dimensionless product of the dust stopping timeτsby the angular velocity. This product is proportional to the grain size. WhenΩτ1, the dust particles are coupled to the gas. On the contrary, whenΩτ 1 (case for large grains), the dust particles are decoupled from the gas and settle towards the midplane.
It is convenient to further approximate the effects of dust settling by relating the “settling factor”
s(a,r) = Hd(a,r)/Hg(a,r) to the settling parameterΩτ0 = (Ωτs)(r,z = 0): We have adopted the
following law, which matches the previous asymptotic results
s(a,r) = 1 if Ωτ0< ωc
= Ωτ0
ωc
!−0.5
if Ωτ0> ωc (1)
withωc=6.5 10−4being equal to the viscosity parameterα, within a factor of order unity [8].
2.3 Disks Simulations
We used the ray-tracer of the radiative transfer code DISKFIT [9] to generate brightness distributions at different wavelengths. The simulated brightness distributions obtained from DISKFIT were then processed through the regularly upgraded ALMA simulator implemented in the GILDAS software package [10] in order to produce the visibilities.
As a first guess, we choose to simulate observations obtained using 50 antennas with a single antenna configuration, so that observations at different wavelengths can be performed nearly simul-taneously. A maximum baseline length of 2.3 km was used and the observations were assumed to be around the transit. Pseudo-observations of settled disks, have been created at four different fre-quencies, 100, 230, 340 and 670 GHz. At the distance of the nearest star forming regions (140 pc for Taurus-Auriga), the corresponding linear resolutions are 42, 18, 12 and 6 AU.
3 Results
Attempting to represent a settled disk by non-settled ones introduces several inconsistencies which reveal the existence of dust settling, provided the inclination is high enough. Table 2 displays the results.
3.1 Deriving the Scale Height
low values to better mimic the small disk thickness (∼19 K instead of 30 K). Relaxing the non-settled hypothesis allows us to recover the input temperature profile. For the moderate grains models, we found at high inclinations a dust scale height of 3-4 AU and of 2-3 AU for the large grains. By comparaison to the gas scale height which is equal to about 14 AU, this discrepancy shows clearly the existence of the dust settling.
3.2 Impact of the Surface Density Profile
If the surface density law for the pseudo-observation between the pseudo-observation and the model is not exactly the same, the dust scale height is more difficult to derive at low inclination (i. e.<75-80 degrees). This result indicates that at inclinations below 80◦, the recovered scale height is sensitive
to the exact shape of the surface density distribution, and cannot in general be determined accurately. Moreover, settled disks actually appear “pinched” (h<1) rather than flared (h>1).
3.3 Others parameters
Although they can serve as secondary indicators and are sensitive to the dust settling at high inclination (≥80◦), others parameters like the spectral indexβ,p, ... cannot serve as diagnostics.
3.4 Instrumental Effects:
Thermal noise was added to the simulateduvdata (corresponding to 30 min of observations for each frequency). The resulting image noise (point source sensitivity) are 13µJy at 100 GHz, 20 at 230 GHz, 30 at 340 GHz and 111 at 670 GHz and did not prevent us to observe the dust settling. Thermal noise is then not a serious limitation to measure dust settling.
However, the atmosphere induces path length variations which are only partially recovered by the calibration techniques anticipated for ALMA. We have then evaluated the impact of the atmospheric phase noise and found that it should be below about 40◦to avoid smearing by limited seeing.
3.5 Impact of the various Wavelengths
The above studies show that all the impact of dust settling is only in the effective scale height. Then, if we know the gas structure from previous observations, only one frequency is necessary. The best frequency for our analysis, giving sufficient spatial resolution and low thermal and phase noise was 340 GHz. More generally, spatial resolutions lower than 1” (or 14 AU for the Taurus aurigae region), no longer have sufficient resolution for our propose.
Nevertheless, if the gas structure is unknown, we need at least two frequencies to derive the dust temperature by resolving the optically thick parts of the disk. With dust emissivity index radial gradi-ents like found by [3] and predicted by simulations of [1], proper identification of an optically thick core region requires at least 3 frequencies.
References
[1] T. Birnstiel, L. Ricci, F. Trotta, C.P. Dullemond, A. Natta, L. Testi, C. Dominik, T. Henning, C.W. Ormel, A. Zsom, A&A516, L14+(2010),1006.0940
[2] P. Goldreich, W.R. Ward, ApJ183, 1051 (1973)
[4] L. Ricci, L. Testi, A. Natta, R. Neri, S. Cabrit, G.J. Herczeg, A&A 512, A15+ (2010), 0912.3356
[5] S. Fromang, R.P. Nelson, A&A496, 597 (2009),0901.4434 [6] S.A. Balbus, J.F. Hawley, ApJ376, 214 (1991)
[7] S.A. Balbus, J.F. Hawley, Reviews of Modern Physics70, 1 (1998) [8] B. Dubrulle, G. Morfill, M. Sterzik, Icarus114, 237 (1995)