Vascular Health and Risk Management
Dove
press
O R i g i n a l R e s e a R c H
open access to scientific and medical research
Open access Full Text article
steady-state bioavailability of prescription
omega-3 on a low-fat diet is significantly improved
with a free fatty acid formulation compared with
an ethyl ester formulation: the ecliPse ii study
elliot Offman1
Ted Marenco1
sandy Ferber2
Judith Johnson3
Douglas Kling3
Danielle curcio3
Michael Davidson3
1clinical Pharmacology sciences,
celerion, Montreal, Qc, canada;
2array Biostatistics llc, evanston, il,
Usa; 3Omthera Pharmaceuticals inc,
Princeton, nJ, Usa
correspondence: elliot Offman celerion, 100 Boul. alexis-nihon, suite 360, Montreal, Quebec, canada H4M 2n8
Tel +1514 744 8731
email [email protected]
Abstract: The systemic bioavailability of free fatty acid (FFA) forms of eicosapentaenoic acid (EPA) and docosahexaenoic acid (DHA) compared with ethyl ester (EE) forms is dependent on the presence of intestinal lipases and is highest during consumption of high-fat meals. Given that patients with cardiovascular disease are advised to reduce dietary fat intake, potentially lowering the bioavailability and therapeutic benefit, the hypothesis that FFA forms provide for higher bioavailability compared with EE forms under low-fat diet conditions was tested where the pharmacokinetics of the FFA form (Epanova™) were compared with those of an ethyl ester form (Lovaza®) following repeat dosing. Fifty-two healthy male and female subjects were equally allocated to one of two open-label, parallel-group cohorts. Following a Therapeutic Lifestyle Changes diet for a minimum of 7 days, blood samples were drawn for endogenous values for EPA and DHA over a 24-hour period. Subjects were then administered 4 × 1 g capsules of either Epanova (OM3 FFA) or Lovaza (OM3 EE) once daily for 14 days, following which serial blood samples were drawn over a 24-hour period to characterize the bioavailability of EPA and DHA from the respective formulations. In addition, changes from baseline in lipid profile were explored. Systemic bioavailability, as measured by area under the curve from time zero to 24 hours (AUC0–τ) and the maximum measured plasma concentrations during the 0–24 hour dosing interval (Cmax,ss) of unadjusted total plasma EPA + DHA were approximately 3-fold and 3.9-fold higher, respectively, for Epanova relative to Lovaza. Following baseline adjustment, the magnitude of difference in bioavailability was approximately 5.8-fold and 6.5-fold higher in AUC0–τ and Cmax,ss, respectively, for Epanova relative to Lovaza. Serum triglycerides were reduced by a significantly greater extent (P = 0.013) for Epanova relative to Lovaza (21% versus 8%). The bioavailability of the FFA forms of EPA and DHA in Epanova are significantly greater than the bioavailability from the EE forms present in Lovaza under low-fat dietary conditions normally recommended for patients with cardiovascular disease. This increased bioavailability may lead to improved triglyceride-lowering in patients with hypertriglyceridemia.
Keywords: hypertriglyceridemia, eicosapentaenoic acid, docosahexaenoic acid, pharmacokinetics
Introduction
Hypertriglyceridemia is increasing in the US and throughout the world, with an esti-mated prevalence of four million Americans meeting the definition of severe hyper-triglyceridemia ($500 mg/dL).1 The risk of pancreatitis is clinically significant in
severe hypertriglyceridemia, and actions to prevent acute pancreatitis are warranted.2
Clinical guidelines for management of severe hypertriglyceridemia recommend
Vascular Health and Risk Management downloaded from https://www.dovepress.com/ by 118.70.13.36 on 27-Aug-2020
For personal use only.
Number of times this article has been viewed
This article was published in the following Dove Press journal: Vascular Health and Risk Management
Dovepress Offman et al
that the patient be admitted to hospital, if symptomatic, to secure a careful follow-up of the patient’s triglyceride values. Restriction of overall energy and energy derived from fat (10%–15% recommended) as well as alcohol absti-nence are encouraged. Therapeutic options include fibrate therapy, prescription omega-3 fatty acids, and nicotinic acid.3 Challenging aspects of current omega-3 therapy for
this indication include the dose required (4 g/day), and that optimal absorption of an ethyl ester formulation requires the medication be taken with a high-fat meal, which is con-traindicated in patients with severe hypertriglyceridemia due to impaired lipoprotein lipase activity and the resulting postprandial hypertriglyceridemia.4
In order for omega-3 fatty acids to be absorbed when provided as ethyl esters (OM3 EE), the ethyl ester bond must undergo hydrolysis by pancreatic lipase enzymes to be converted into free fatty acids for intestinal absorption. In contrast with OM3 EE forms that require this digestive step, the free fatty acid forms of omega-3 are not dependent on pancreatic enzyme activity5–12 and are readily absorbed,
so have improved bioavailability that is less dependent on meal fat content.13 A novel free fatty acid formulation of
omega-3 (OM3 FFA, Epanova™, Omthera Pharmaceuticals Inc, Princeton, NJ, USA) was developed to maximize the bioavailability of the omega-3 fatty acids, eicosapentaenoic acid (EPA) and docosahexaenoic (DHA), in patients with hypertriglyceridemia who are advised to restrict fat intake.3
A previous study (ECLIPSE I [Epanova® Compared to
Lovaza® In a Pharmacokinetic, Single-dose, Evaluation])4
compared bioavailability only after a single dose; the pres-ent study (ECLIPSE II) was designed to characterize how the OM3 FFA and OM3 EE formulations would compare in terms of plasma levels of EPA and DHA at steady state over a 2-week period under low-fat dietary intake conditions. The hypothesis being tested was that the EPA and DHA delivered in the OM3 FFA product (Epanova) would produce higher blood levels of EPA, DHA, and EPA + DHA than those from the comparator OM3 EE product (Lovaza® GlaxoSmithKline,
Research Triangle Park, NC, USA), which would provide evidence to support greater EPA and DHA bioavailability from the free fatty acid formulation.
Materials and methods
study design and procedures
This was an open-label, single-site investigation (Celerion Inc, Tempe, AZ, USA) to compare the relative oral bio-availability of unadjusted and baseline-adjusted total EPA, total DHA, and total EPA + DHA following repeated dose
administration of Epanova compared with repeated dose administration of Lovaza. Additionally, comparisons of changes in lipids between Epanova and Lovaza, and their relationship to plasma EPA + DHA, were evaluated in an exploratory manner. Another objective of this study was to assess the effects of repeated-dose Epanova on the pharma-cokinetics and pharmacodynamics of a single 25 mg dose of warfarin, the results of which will be reported in a separate publication.
Prior to the first procedure conducted on any subject, the ECLIPSE II protocol underwent review by the Celerion Institutional Review Board in compliance with US Code of Federal Regulations (21 CFR 56) and International Confer-ence on Harmonization guidelines, (www.ich.org; ICHE6 Good Clinical Practice), and a signed informed consent form was obtained from all subjects, who were informed of their right to withdraw from the study at any time. The study was conducted according to Good Clinical Practice and in accordance with the ethical requirements referred to in the European Union directive 2001/20/EC and the principles enunciated in the Declaration of Helsinki (Seoul, 2008).
Within 28 days prior to receiving the first dose of investigational product, medical history and demographic data (including name, sex, age, race, and tobacco use) were recorded. Each of the 52 subjects enrolled received a physical examination, including complete vital signs and a 12-lead electrocardiogram. Laboratory screening tests included hematology, coagulation, serology, urinalysis, and clinical chemistry tests, which included a lipid panel for total cholesterol, low-density lipoprotein cholesterol (LDL-c), high-density lipoprotein cholesterol (HDL-c), and triglycerides.
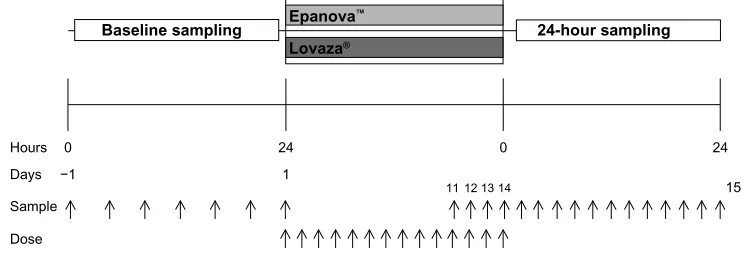
The study employed an open-label, two-cohort, parallel design. In both cohorts (n = 26 per cohort), subjects received either 4 g (4 × 1 g) of Epanova or 4 g (4 × 1 g) of Lovaza once daily for 14 consecutive days. In terms of free fatty acid com-position per 1 g capsule, the Epanova formulation was assayed as containing 550 mg EPA and 200 mg DHA, whereas the Lovaza was assayed to contain 465 mg EPA and 375 mg DHA. The ECLIPSE II study design is presented in Figure 1.
Subjects in both cohorts were maintained on a low-fat diet throughout the entire study (from check-in [9 days prior to the first dose of Epanova or Lovaza] until release from confinement) consistent with the recommendations of the Therapeutic Lifestyle Changes (TLC, National Cholesterol Education Program [NCEP] Adult Treatment Panel III) diet.3
They were also educated on, and requested to maintain, a constant diet with respect to vitamin K intake through study
Vascular Health and Risk Management downloaded from https://www.dovepress.com/ by 118.70.13.36 on 27-Aug-2020
Dovepress improvements in bioavailability of omega-3 free fatty acids
completion (vitamin K instruction started 2 weeks prior to the first dose). Subjects were confined in the clinical research unit from the evening before the first dose through to the final blood draw for pharmacokinetic and/or pharmacodynamic assessment and any end of study procedures. All food con-sumed after check-in was prepared by study staff under the supervision of a registered dietitian to ensure consistency with the TLC diet recommendations. The subjects received the same breakfast on all days where a breakfast was served; lunch, dinner, and snacks differed each day, but all meals were consistent between cohorts. Beginning approximately 30 minutes prior to each dose, a breakfast containing less than 10% of energy as fat was consumed daily. The breakfast consisted of one cup of oatmeal, one cup of fat-free milk, one quarter of a cup of raisins, one cup of honeydew melon, and one cup of calcium-fortified orange juice. Subjects were required to fast for a minimum of 10 hours overnight prior to the breakfast and continue to fast for at least 4 hours there-after. The proportion of each consumed meal was recorded in the subject’s case report form.
inclusion/exclusion criteria
Non-tobacco-using males and/or females aged 18–55 years and with a body mass index of 18–29.9 kg/m2 were allowed
to participate if they were considered medically healthy; defined as having no clinically significant abnormalities in terms of clinical chemistry laboratory values, electro-cardiography, and physical examination results. Female patients assigned to the Epanova cohort were to be of non-childbearing potential due to the exposure to warfarin in this cohort. Non-childbearing potentia was defined as: hav-ing undergone a sterilization procedure at least 6 months prior to check-in, ie, basal tubal ligation, hysterectomy, hysterectomy with unilateral or bilateral oophorectomy, bilateral oophorectomy; or having been postmenopausal for at least 24 consecutive months prior to check-in, with a
screening follicle-stimulating hormone level .40 mIU/dL. Female subjects assigned to the Lovaza cohort could be of childbearing potential, but had to remain sexually inactive or be using an appropriate method of contraception for the entire duration of the study. In addition to a willingness to comply with the prescribed TLC diet, subjects were not to have consumed fish oil or other EPA and/or DHA contain-ing supplements within 2 months prior to study start.
compliance and exposure
Epanova 1 g capsules containing a mixture of polyunsaturated free fatty acids were provided by Omthera Pharmaceuticals Inc. Lovaza 1 g capsules were sourced from a pharmacy wholesaler. All expiry dates were confirmed to be within the appropriate shelf-life throughout the entire study period. All investigational products were administered under the supervision of the principal investigator and clinical research staff to ensure compliance. All doses were administered with 240 mL of water, following which clinical staff performed hand and mouth checks of subjects to ensure the dose was completely swallowed. Subjects remained ambulatory or seated upright for the first 4 hours following dosing and were to avoid unusual, unaccustomed, or strenuous physical activity (eg, weightlifting, running, bicycling) from prestudy (screening) through study completion.
Pharmacokinetic blood samples
For both the Epanova and Lovaza cohorts, samples (n = 7) for analysis of total EPA and DHA in plasma were collected for 24-hour baseline assessment prior to the first dose. In addition, fasting predose trough samples were drawn prior to the 11th, 12th, 13th, and 14th doses for assessment of steady-state, as well as 1, 2, 3, 4, 5, 6, 7, 8, 9, 10, 12, and 24 hours following the 14th dose to determine plasma con-centrations of total EPA, total DHA, and total EPA + DHA. Lipoprotein lipid parameters were collected at screening,
24 0
24 0
Hours
15 11 12 13 14
1 −1
Days
Sample
Dose
Epanova™
Baseline sampling 24-hour sampling
Lovaza®
Figure 1 ecliPse ii study design.
Vascular Health and Risk Management downloaded from https://www.dovepress.com/ by 118.70.13.36 on 27-Aug-2020
Dovepress Offman et al
check-in, prior to the initial dose, and at the end of the dosing period, or prior to release from the clinic or upon early withdrawal.
For both cohorts, the blood sample for total EPA and DHA analysis was drawn into 4 mL chilled evacuated tubes containing K2EDTA and stored at room temperature for up to 60 minutes until centrifugation. Plasma aliquots were placed in storage at -80°C within 60 minutes of collection. Sample analysis for total EPA and total DHA in human plasma was performed at Cetero Research (Toronto, ON, Canada). Briefly, the liquid chromatography-tandem mass spectro metry method employed deuterated forms of EPA and DHA as internal standards with linear ranges of 1–200 µg/mL and 2–400 µg/mL for EPA and DHA, respectively. Percent coefficients of variation and accuracy for all calibration and quality control standards were ,5% and .95% for both total EPA and total DHA.
The biochemical analysis of serum lipids was per-formed using the photometric measuring unit of a Cobas®
6000 analyzer (Roche Diagnostics Ltd, Indianapolis, IN, USA). Serum lipoprotein lipid parameters reported included triglycerides, LDL-c, HDL-c, and non-HDL-c. Non-HDL-c was calculated as the difference between measured con-centrations of total and HDL-c. LDL-c was calculated as non-HDL-c minus one fifth of the measured triglyceride concentration.
Pharmacokinetic analysis
Total ePa and DHa
Using noncompartmental pharmacokinetic analysis of the actual sample collection time, parameters were derived for the unadjusted and baseline-adjusted plasma total EPA, total DHA, and total EPA + DHA concentration-time data using WinNonlin® version 5.2 (Pharsight Corp, Mountainview,
CA, USA), and SAS® version 9.1.3 (SAS® Drug
Develop-ment Platform, version 3.4; SAS Institute Inc., Cary, NC, USA), as appropriate. Pharmacokinetic parameters calcu-lated are presented in Table 1.
Since the human body is capable of converting dietary α-linolenic acid to EPA and DHA, albeit in limited quanti-ties, such that these latter two fatty acids might be present endogenously in measurable quantities in the subjects in this study, unadjusted plasma total EPA and total DHA concentra-tions that were below the limit of bioanalytical quantitation were set to half of the lower limit of quantitation. Molar ratios were then used to calculate unadjusted total EPA + DHA concentrations in SAS® version 9.1.3 (SAS® Drug
Develop-ment Platform, version 3.4). Total EPA + DHA concentration
was calculated by the following equation and expressed in nmol/mL:
(Total EPA concentration/EPA MW) + (Total DHA concentration/DHA MW)
where molecular weights (MW) of 302.451 g/mol and 328.48828 g/mol were applied for EPA and DHA, respectively. For each subject, baseline adjustment was performed by subtracting the mean predose baseline (mean of seven predose plasma concentrations) prior to calculation of the pharmacokinetic parameters. The adjustment was subject-specific. All negative values were set to zero.
statistical analysis
The relative systemic exposure to total EPA, total DHA, and total EPA + DHA following repeat-dose administration of Epanova versus Lovaza was assessed by analysis of variance on the natural log-transformed pharmacokinetic parameters AUC0–τ and Cmax,ss of baseline-adjusted (primary analysis) and unadjusted (secondary analysis) values.
The results were then used for the calculation of geometric least-squares means and the differences between geometric least-squares means of the natural log-transformed pharma-cokinetic parameters following repeat-dose administration of Epanova versus repeat-dose administration of Lovaza. The 90% confidence intervals for the geometric least-squares means ratios of the back-transformed pharmacokinetic parameters AUC0–τ and Cmax,ss for Epanova versus Lovaza were presented. The 90% confidence intervals from the primary analysis on baseline-adjusted values were expected to fall entirely above the 80%–125% range.
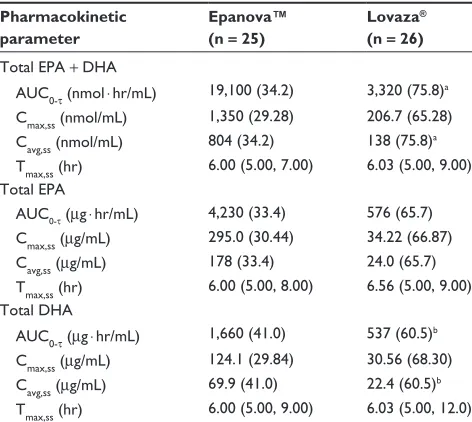
Table 1 Pharmacokinetic parameters calculated for baseline-adjusted total ePa + DHa, total ePa, and total DHa following repeated dosing
aUc0-τ area under the plasma concentration versus time curve from time 0 to 24 hours postdose cmin,ss Minimum measured plasma concentration cmax,ss Maximum measured plasma concentration
Tmax,ss Time of the maximum measured plasma concentration cavg,ss average plasma concentration at steady-state,
calculated as aUc0-τ/τ, where τ is the duration of the dosing interval, ie, 24 hours
Flux Percent peak-to-trough fluctuation at steady-state, calculated as (cmax,ss- cmin,ss)/cavg,ss× 100 swing Ratio of the magnitude of change between cmax,ss
and cmin,ss relative to cmin,ss at steady-state, calculated as (cmax,ss- cmin,ss)/cmin,ss× 100
Abbreviations: aUc, area under the concentration-time curve; ePa, eicosapentaenoic acid; DHa, docosahexaenoic acid.
Vascular Health and Risk Management downloaded from https://www.dovepress.com/ by 118.70.13.36 on 27-Aug-2020
Dovepress improvements in bioavailability of omega-3 free fatty acids
Analyses of changes in serum lipoprotein parameters were performed for exploratory purposes. All analyses of lipid parameters were performed using SAS® version
9.3. Percent change from baseline in lipid parameter levels after 2 weeks of dosing was summarized for each treatment cohort using all subjects. For each treatment cohort, baseline lipid levels were defined as the average of the values from 7 days prior to the day 1 dose and the day 1 predose value. For each lipid parameter, comparisons of percent change from baseline in lipid levels between the two treatment cohorts were performed using analysis of covariance with treatment cohort as a factor and baseline lipid value as a covariate in the model. Unadjusted P-values from the equal slope analysis of covariance model were calculated for testing the difference in geometric least-squares means between treatment cohorts.
Additional exploratory analyses examining the relation-ship between the percent change in triglyceride levels and percent change in unadjusted plasma total EPA + DHA levels were performed for all subjects combined using the Pearson product-moment correlation coefficient (r). The Spearman rank-order correlation coefficient (rs) was used to evaluate the robustness of, or replace, Pearson’s r, when assumptions for application of parametric methods were questionable. Baseline total EPA + DHA levels were defined as stated above for pharmacokinetic parameter calculations. End-of-treatment total EPA + DHA levels were defined as the average of three predose values from the 11th, 12th, and 13th day of dosing for both cohorts. For these exploratory analyses of lipids, two-sided P-values , 0.05 were considered to be statistically significant. No adjustment for multiplicity was applied.
Results
study population
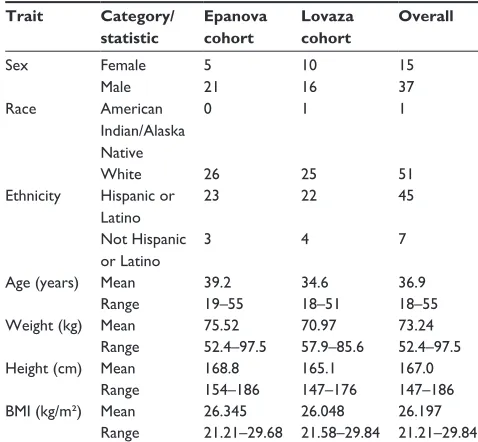
Subject demographics are presented in Table 2. Fifty-two subjects entered the study and were assigned to one of the two study cohorts. Fifty-one subjects completed the study, with one subject having withdrawn for personal reasons following the fifth dose of Epanova. Baseline DHA levels of the women in both cohorts in this study were comparable (45–50 µg/mL [Epanova cohort] and 47–53 µg/mL [Lovaza cohort]). The average daily energy intake during the study was approximately 2,410 kcal, with approximately 16.6% (approximately 399 kcal) coming from protein, 61.7% (about 1,490 kcal) coming from carbohydrates, and 21.7% (about 523 kcal) coming from fat.
Pharmacokinetic and statistics
Mean unadjusted plasma total EPA + DHA concentrations were similar prior to the first dose and markedly greater
following repeat dosing with Epanova than with Lovaza from day 11 through to 24 hours following day 14 dosing (Figure 2).
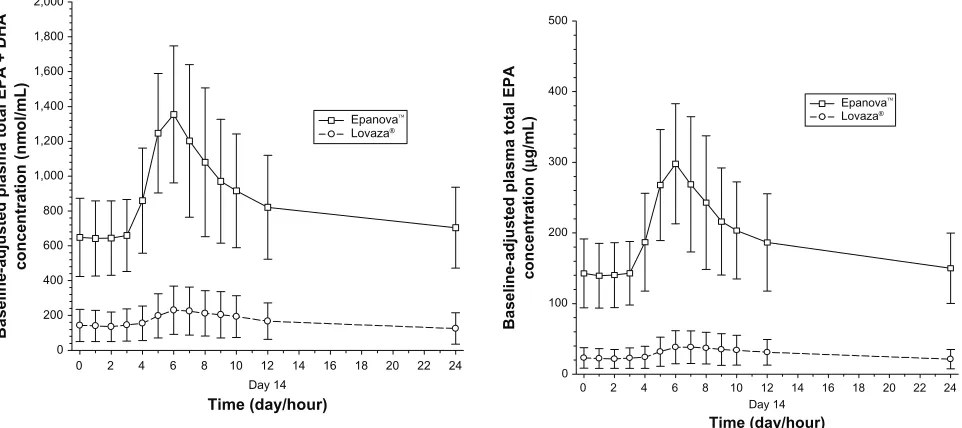
After 7 days following a TLC diet, subjects in both cohorts exhibited relatively similar baseline concentrations of total EPA + DHA (Figure 2) with arithmetic mean concentrations ranging from 175–197 nmol/mL and 172–193 nmol/mL for Epanova and Lovaza, respectively, over a 24-hour interval. Following single daily doses of either Epanova or Lovaza for 14 days, the unadjusted total EPA + DHA Cavg,ss in the Epanova cohort was approximately three-fold that of the Lovaza cohort, suggesting a substantially higher relative bio-availability of Epanova. When EPA, DHA, and EPA + DHA were corrected for endogenous EPA and DHA from dietary sources, the magnitude of the difference was even more apparent, with the greatest difference being evident in plasma EPA concentrations (Figures 3–5).
Based on the coefficient of variation for the geometric mean pharmacokinetic parameters, when adjusting for base-line EPA, DHA, and EPA + DHA, the variability of Epanova was approximately half of that observed for Lovaza (Table 3), suggesting that Epanova provides more consistent delivery of omega-3 fatty acids under low-fat dietary conditions. In terms of relative bioavailability (as measured by the geo-metric least-squares means for AUC0–τ), Epanova resulted in approximately 733%, 309%, and 576% of the values for total EPA, DHA and EPA + DHA, respectively, compared with Lovaza (Table 4). The magnitude of the difference can be better appreciated by considering the 90% confidence
Table 2 subject demographics and disposition
Trait Category/ statistic
Epanova cohort
Lovaza cohort
Overall
sex Female 5 10 15
Male 21 16 37
Race american
indian/alaska native
0 1 1
White 26 25 51
ethnicity Hispanic or latino
23 22 45
not Hispanic or latino
3 4 7
age (years) Mean 39.2 34.6 36.9
Range 19–55 18–51 18–55
Weight (kg) Mean 75.52 70.97 73.24
Range 52.4–97.5 57.9–85.6 52.4–97.5
Height (cm) Mean 168.8 165.1 167.0
Range 154–186 147–176 147–186
BMi (kg/m²) Mean 26.345 26.048 26.197
Range 21.21–29.68 21.58–29.84 21.21–29.84
Abbreviation: BMi, body mass index.
Vascular Health and Risk Management downloaded from https://www.dovepress.com/ by 118.70.13.36 on 27-Aug-2020
Dovepress Offman et al
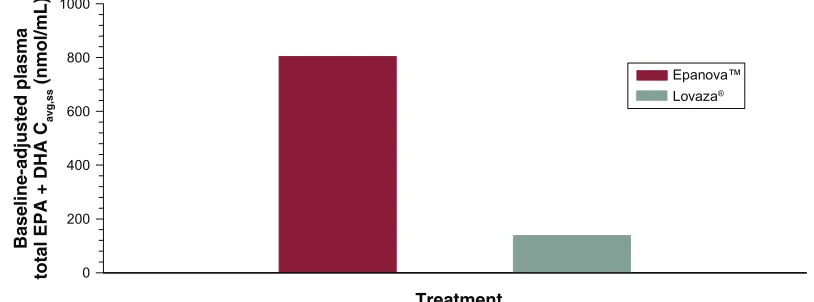
intervals of the geometric least-squares means ratios for the main measures of oral bioavailability (ie, AUC0–τ and Cmax,ss), where, in all cases, the lower tail exceeded 200% and the upper tail ranged from 390% to greater than 1,000% (for total EPA Cmax,ss). Consistent with the unadjusted Cavg,ss, adjustment for baseline endogenous omega-3 resulted in an approximate six-fold difference in total EPA + DHA Cavg,ss (Figure 6), most of which was due to the substantial difference (seven-fold) in total EPA between the two treatments (Figure 7).
lipoprotein lipids
Baseline and percent change from baseline in lipid values are presented in Table 5. Mean baseline triglycerides were
higher in the Epanova cohort (185.8 mg/dL) relative to the Lovaza cohort (145.3 mg/dL). After 2 weeks of dosing, there was a significantly larger percent reduction in triglycerides observed in the Epanova cohort compared with the Lovaza cohort (geometric least-squares means 21% versus 8%, P = 0.013). There were no statistically significant differences observed in percent change from baseline in HDL-c, LDL-c, or non-HDL-c between the two cohorts.
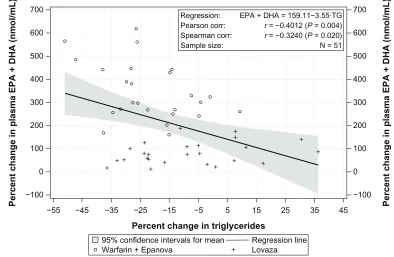
Correlations between percent change in triglyceride levels and percent change in unadjusted plasma total EPA + DHA over combined cohorts are presented in Figure 8. The data exhibited a potential departure from Pearson’s r assumptions; however, the direction and magnitude of the trend was supported by Time (day/hour)
Unadjusted plasma total EPA + DH
A
concentration (nmol/mL)
0 500 1,000 1,500 2,000 2,500
24 hr 0 hr
Day 14 Day 13
Day 12 Day 11
Day 1 Day −1
Epanova™ Lovaza®
Figure 2 Mean unadjusted plasma total ePa + DHa concentrations.
Abbreviations: ePa, eicosapentaenoic acid; hr, hour; DHa, docosahexaenoic acid.
Time (day/hour)
0 2 4 6 8 10 12 14 16 18 20 22 24
Baseline-adjusted plasma total EPA + DHA
concentration (nmol/mL)
0 200 400 600 800 1,000 1,200 1,400 1,600 1,800 2,000
Day 14
Epanova
Lovaza®
Figure 3 Mean (sD) baseline-adjusted plasma total ePa + DHa concentrations. Abbreviations: ePa, eicosapentaenoic acid; sD, standard deviation; DHa, docosahexaenoic acid.
Time (day/hour)
0 2 4 6 8 10 12 14 16 18 20 22 24
Baseline-adjusted plasma total EPA
concentration
(
µ
g/mL)
0 100 200 300 400 500
Day 14
Epanova Lovaza®
Figure 4 Mean (sD) baseline-adjusted plasma total ePa concentrations. Abbreviations: ePa, eicosapentaenoic acid; sD, standard deviation.
Vascular Health and Risk Management downloaded from https://www.dovepress.com/ by 118.70.13.36 on 27-Aug-2020
Dovepress improvements in bioavailability of omega-3 free fatty acids
Spearman’s rs. There was a statistically significant inverse relationship observed between percent change in triglycer-ides and percent change in total EPA + DHA (r = -0.4012, P = 0.004; rs= -0.3240, P = 0.020).
safety and tolerability
Throughout the study, both treatments were well tolerated. One subject (Epanova cohort) experienced an increase in
bilirubin and a decrease in neutrophil count, which were both considered unrelated to the study drug.
Discussion
Previous studies have demonstrated that the marine EPA and DHA in triglyceride form are more resistant to pancreatic lipase hydrolysis compared with other polyunsaturated fatty acids.5–7 Further, OM3 EEs are up to 50 times more
resistant than the natural triglyceride form to pancreatic lipase hydrolysis and require an additional hydrolysis step that utilizes carboxyl ester lipase to yield EPA and DHA free fatty acids, with ethanol as a byproduct.8–12 Several
studies have compared human intestinal absorption of fish oil fatty acids in the form of triglycerides, ethyl esters, and free fatty acids, and found that free fatty acids have up to five times more bioavailability than the ethyl ester form as determined by the plasma AUC.9–11 Because Epanova is a
free fatty acid formulation, it has less dependence on meal fat content and has significantly greater bioavailability than Lovaza, which contains an ethyl ester formulation.4 The
NCEP ATP III has recommended that patients with severe hypertriglyceridemia consume very low-fat diets, which results in less release of pancreatic lipase into the intestinal lumen, and could lead to reduced absorption of omega-3 in ethyl ester formulations.3 In this study, we compared the
plasma levels of total EPA + DHA after repeat-dose admin-istration of Epanova or Lovaza under low-fat diet conditions. Although no formal assessment of dietary compliance was completed prior to the confinement, at baseline both treat-ment arms had similar levels of plasma total EPA + DHA. However, at steady-state after 14 days of repeat dosing, subjects receiving Epanova had substantially higher and less variable trough levels of unadjusted total EPA + DHA compared with Lovaza. These observations support the view that after repeated administration in conjunction with a low-fat diet, the absorption of OM3 EE is significantly lower than that of OM3 FFA. This is likely attributable to the reduced amount of pancreatic lipase released in response to a low-fat diet. In addition, after 14 days of repeat dos-ing in conjunction with a low-fat diet, the rate and extent of systemic exposure over the normal dosing interval was also significantly improved with Epanova compared with Lovaza (Table 4).
In this 2-week study, the percent increases from baseline in plasma total EPA (253%) and DHA (41%) in the Lovaza cohort were consistent with the plasma changes in previous clinical trials with Lovaza that measured steady levels of omega-3 fatty acids. In nine previous Lovaza clinical studies in patients with hypertriglyceridemia, the range of percent Time (day/hour)
0 2 4 6 8 10 12 14 16 18 20 22 24
Baseline-adjusted plasma total DHA
concentration
(
µ
g/mL)
0 20 40 60 80 100 120 140 160 180
Day 14
Epanova
Lovaza®
Figure 5 Mean (sD) baseline-adjusted plasma total DHa concentrations. Abbreviations: sD, standard deviation; DHa, docosahexaenoic acid.
Table 3 summary of the baseline-adjusted pharmacokinetic parameters of total ePa + DHa, total ePa and total DHa in plasma
Pharmacokinetic parameter
Epanova™ (n = 25)
Lovaza®
(n = 26)
Total ePa + DHa
aUc0-τ (nmol ⋅ hr/ml) 19,100 (34.2) 3,320 (75.8)a
cmax,ss (nmol/ml) 1,350 (29.28) 206.7 (65.28) cavg,ss (nmol/ml) 804 (34.2) 138 (75.8)a
Tmax,ss (hr) 6.00 (5.00, 7.00) 6.03 (5.00, 9.00) Total ePa
aUc0-τ (µg ⋅ hr/ml) 4,230 (33.4) 576 (65.7) cmax,ss (µg/ml) 295.0 (30.44) 34.22 (66.87) cavg,ss (µg/ml) 178 (33.4) 24.0 (65.7) Tmax,ss (hr) 6.00 (5.00, 8.00) 6.56 (5.00, 9.00) Total DHa
aUc0-τ (µg ⋅ hr/ml) 1,660 (41.0) 537 (60.5)b
cmax,ss (µg/ml) 124.1 (29.84) 30.56 (68.30) cavg,ss (µg/ml) 69.9 (41.0) 22.4 (60.5)b
Tmax,ss (hr) 6.00 (5.00, 9.00) 6.03 (5.00, 12.0)
Notes: aUc0-τ, cmax,ss, and cavg,ss are presented as geometric mean (geometric cV%); Tmax,ss is presented as median (minimum, maximum). an = 25; bn = 23. Abbreviations: aUc, area under the concentration-time curve; aUc0-τ, area
under the plasma concentration versus time curve from time 0 to 24 hours postdose; cmax,ss, maximum measured plasma concentration; Tmax,ss, time of the maximum measured plasma concentration; cavg,ss, average plasma concentration at steady-state, calculated as aUc0-τ/τ, where τ is the duration of the dosing interval, ie,
24 hours; ePa, eicosapentaenoic acid; DHa, docosahexaenoic acid; hr, hours.
Vascular Health and Risk Management downloaded from https://www.dovepress.com/ by 118.70.13.36 on 27-Aug-2020
Dovepress Offman et al
change for EPA was 139%–361% with a mean of 236% and for DHA the range was 10%–77% with a mean of 36%. Therefore, the healthy volunteers on a low-fat diet in this trial in the Lovaza cohort had similar changes in omega-3 levels compared with patients with hypertriglyceridemia treated with Lovaza.14
Omega-3 fatty acids produce their triglyceride-lowering properties, at least in part, by acting on nuclear receptors in the liver.15,16 Delivery of omega-3 fatty acids
to the liver is dependent on their absorption through the intestines and subsequent incorporation into chylomicron particles. Chylomicron remnants are ultimately removed from the circulation by the liver, delivering EPA and DHA into hepatic tissues in addition to those that are taken up by the liver as free fatty acids released during triglycer-ide hydrolysis of lipoprotein and adipose triglycertriglycer-ides.17
In healthy subjects, plasma levels of total EPA + DHA are reliable markers of intestinal absorption and liver exposure, and higher total plasma levels of EPA and DHA
are consistent with increased bioavailability, although the authors acknowledge that other methods such as tracer studies would be needed to directly demonstrate enhanced bioavailability. ECLIPSE II evaluated a 4 g/day dosage of an OM3 FFA and OM3 EE formulation. After 2 weeks of treatment, Epanova reduced triglycerides by 21%, which was significantly greater than the 8% reduction achieved with Lovaza (P = 0.013). This suggests that the increase in bioavailability associated with Epanova may lead to better triglyceride reductions when administered at equivalent dosages. This is also supported by the significant correla-tion (rs= -0.3240, P = 0.020) between the percent change in serum triglycerides and percent change in plasma total EPA + DHA.
The study population was mostly Hispanics who had low baseline levels of omega-3 fatty acid compared with those observed in other studies. Hispanics may have reduced levels of omega-3 due to a low fish intake, and a high prevalence of fatty acid desaturase gene polymorphism, which is associated
Baseline-adjusted plasma
total EPA + DHA
Cavg,ss
(nmol/mL)
0 200 400 600 800 1000
Epanova™
Lovaza®
Treatment
Figure 6 Mean baseline-adjusted plasma total ePa + DHa - cavg,ss. Abbreviations: ePa, eicosapentaenoic acid; DHa, docosahexaenoic acid.
Table 4 summary of the statistical comparisons of the pharmacokinetic parameters of baseline-adjusted total ePa + DHa, total ePa, and total DHa in plasma
Pharmacokinetics parameter
Geometric least-squares mean
% mean ratio 90% CI P-value
Epanova™ Lovaza®
Total ePa + DHa
aUc0-τ (nmol ⋅ hour/ml) 19,110.87 3,320.07 575.62 447.37–740.64 ,0.0001
cmax,ss (nmol/ml) 1,349.57 206.69 652.93 523.48–814.39 ,0.0001
Total ePa
aUc0-τ (µg ⋅ hour/ml) 4,225.56 576.12 733.45 584.10–920.99 ,0.0001
cmax,ss (µg/ml) 295.04 34.22 862.28 687.73–1081.14 ,0.0001
Total DHa
aUc0-τ (µg ⋅ hour/ml) 1,660.19 536.86 309.24 245.01–390.30 ,0.0001
cmax,ss (µg/ml) 124.10 30.56 406.12 323.10–510.48 ,0.0001
Abbreviations: AUC, area under the concentration-time curve; CI, confidence interval; EPA, eicosapentaenoic acid; DHA, docosahexaenoic acid. AUC0-τ, area under the
plasma concentration versus time curve from time 0 to 24 hours postdose; cmax,ss, maximum measured plasma concentration.
Vascular Health and Risk Management downloaded from https://www.dovepress.com/ by 118.70.13.36 on 27-Aug-2020
Dovepress improvements in bioavailability of omega-3 free fatty acids
with decreased conversion of short-chain to long-chain fatty acids.18 Approximately two thirds of Hispanics have the fatty
acid desaturase polymorphism associated with decreased conversion of alpha-linolenic acid to EPA.18,19 However, fatty
acid desaturase gene polymorphisms are unlikely to affect EPA and DHA absorption, and steady-state plasma levels of total EPA and DHA in the present study were similar to those observed in other studies where Epanova was used as a treatment for hypertriglyceridemia, suggesting that the present results are generalizable to other ethnic groups and to hypertriglyceridemic patients.20,21 A potential limitation of
this study was the use of a nonrandomized, open-label design, which was necessary due to the warfarin component of the study, ie, subjects were recruited to specific cohorts based on the inclusion/exclusion criteria of the respective cohorts. However, as the main endpoints were pharmacokinetic
in nature, the risk of bias is considered very low by the authors.
JELIS (the Japan Eicosapentaenoic Acid Lipid Inter-vention Study) demonstrated that, in Japanese subjects, 2 g of EPA/day decreased cardiovascular events by 19% and that the on-treatment EPA levels correlated with the event reduction (levels greater than 100 µg/mL were associated with a clinical benefit).22 The baseline levels of EPA in
this study population were approximately one ninth the on-treatment level of the JELIS study population. The steady-state levels of unadjusted total EPA of 33–35 µg/ mL in the Lovaza cohort versus 145–156 µg/mL in the Epanova cohort prior to the 11th, 12th, 13th, and 14th doses suggest that in order to achieve the omega-3 levels associated with cardiovascular benefits in the JELIS trial, in a US population, either much higher doses of OM3 EE
Table 5 summary of the lipid parameters at baseline (mg/dl) and percent change from baseline after 2 weeks of dosing
Lipid/visit Epanova™ cohort Lovaza® cohort LSM difference P-value
Triglycerides
Baseline, mean (sD) 185.8 (82.40) 145.3 (75.90)
Percent change, mean (sD) -22.0 (14.50) -7.5 (19.26)
lsM (se) -21.2 (3.48) -8.3 (3.41) -12.9 0.013
HDl cholesterol
Baseline, mean (sD) 41.9 (10.68) 44.4 (10.37)
Percent change, mean (sD) -4.7 (9.07) -7.7 (10.15)
lsM (se) -5.0 (1.87) -7.4 (1.84) 2.3 0.382
lDl cholesterol
Baseline, mean (sD) 126.6 (27.03) 130.0 (38.53)
Percent change, mean (sD) -4.0 (13.16) 0.4 (14.39)
lsM (se) -4.0 (2.78) 0.4 (2.73) -4.5 0.257
non–HDl cholesterol
Baseline, mean (sD) 146.5 (32.25) 145.2 (42.77)
Percent change, mean (sD) -4.9 (10.88) 1.3 (14.18)
lsM (se) -4.9 (2.56) 1.3 (2.51) -6.1 0.093
Notes: epanova cohort, n = 26 at baseline and n = 25 after 2 weeks of dosing; lovaza cohort, n = 26 at baseline and n = 26 after 2 weeks of dosing. Abbreviations: lsM, geometric least-squares means; sD, standard deviation; se, standard error; HDl, high-density lipoprotein; lDl, low-density lipoprotein.
Baseline-adjusted plasma
Cavg,ss
(
µ
g/mL
)
0 50 100 150 200
EPA DHA
Epanova™
Lovaza®
Figure 7 Mean baseline-adjusted plasma total ePa + DHa - cavg,ss. Abbreviations: ePa, eicosapentaenoic acid; DHa, docosahexaenoic acid.
Vascular Health and Risk Management downloaded from https://www.dovepress.com/ by 118.70.13.36 on 27-Aug-2020
Dovepress Offman et al
are required, or a free fatty acid formulation is needed, to maximize the potential cardiovascular benefits associated with omega-3 fatty acids.
Conclusion
Free fatty acid formulations of omega-3 fatty acids provide sig-nificantly higher plasma levels of total EPA + DHA compared with ethyl ester formulations after 14 days of repeat dosing in subjects on a low-fat diet. The higher apparent bioavailability of free fatty acid forms suggests that triglyceride-lowering efficacy with free fatty acid formulations may be higher than with ethyl ester formulations at equivalent daily dosages.
Disclosure
EO and TM are paid employees of Celerion Inc. JJ, DK, DC, and MD are paid employees of Omthera Pharmaceuticals Inc. SF reports no conflicts of interest in this work.
References
1. Christian JB, Bourgeois N, Snipes R, Lowe KA. Prevalence of severe (500 to 2,000 mg/dL) hypertriglyceridemia in United States adults.
Am J Cardiol. 2011;107:891–897.
2. Reiner Z, Catapano AL, De Backer G, et al. European Association for Cardiovascular Prevention and Rehabilitation. ESC Committee for Practice Guidelines (CPG) 2008–2010 and 2010–2012 Committees ESC/EAS Guidelines for the management of dyslipidaemias: the Task Force for the management of dyslipidaemias of the European Society of Cardiology (ESC) and the European Atherosclerosis Society (EAS).
Eur Heart J. 2011;32:1769–1818.
3. National Cholesterol Education Program (NCEP) Expert Panel on Detection, Evaluation, and Treatment of High Blood Cholesterol in Adults (Adult Treatment Panel III). Third Report of the National Cholesterol Education Program (NCEP) Expert Panel on Detection, Evaluation, and Treatment of High Blood Cholesterol in Adults (Adult Treatment Panel III) Final Report. Circulation. 2002;106:3143–3421. 4. Davidson MH, Johnson J, Rooney MW, Kyle ML, Kling DF.
A novel omega-3 free fatty acid formulation has dramatically improved bioavailability during a low-fat diet compared with omega-3-acid ethyl esters: The ECLIPSE (Epanova compared to Lovaza in a pharmacokinetic single-dose evaluation) study. J Clin Lipidol. 2012; 6:573–584.
5. Ikeda I, Sasaki E, Yasunami H, et al. Digestion and lymphatic transport of eicosapentaenoic and docosahexaenoic acids given in the form of triacylglycerol, free acid and ethyl ester in rats. Biochim Biophys Acta. 1995;1259:297–304.
6. Small DM. The effects of glyceride structure on absorption and metabolism. Annu Rev Nutr. 1991;11:413–434.
7. El Boustani S, Colette C, Monnier L, Descomps B, Crastes de Paulet A, Mendy F. Enteral absorption in man of eicosapentaenoic acid in different chemical forms. Lipids. 1987;22:711–714.
8. Hazra A, Tripathi SK, Ghosh A. Pharmacology and therapeutic potential of the n-3 polyunsaturated fatty acids, eicosapentaenoic acid (EPA) and docosahexaenoic acid (DHA) in fish oils. Indian J Pharmacol. 1999;31:247–264.
9. Lawson LD, Hughes BG. Human absorption of fish oil fatty acids as triacylglycerols, free acids, or ethyl esters. Biochem Biophys Res
Commun. 1988;152:328–335.
10. Lawson LD, Hughes BG. Absorption of eicosapentaenoic acid and docosahexaenoic acid from fish oil triacylglycerols or fish oil ethyl esters co-ingested with a high-fat meal. Biochem Biophys Res
Commun. 1988;156:960–963.
11. Beckermann B, Beneke M, Seitz I. Comparative bioavailability of eicosapentaenoic acid and docosahexaenoic acid from triglycerides, free fatty acids and ethyl esters in volunteers. Arzneimittelforschung. 1990;40:700–704.
45 35 25 15 5 −5
Percent change in triglycerides
Percent change in plasma EPA + DHA (nmol/mL) Percent change in plasma EPA + DHA (nmol/mL) −15
−25
95% confidence intervals for mean
Warfarin + Epanova Regression lineLovaza −35
−45 −55 −100
0 100 200 300 400 500 600 700
−100 0 100 200 300 400 500 600 700
Regression: Pearson corr: Spearman corr: Sample size:
EPA + DHA = 159.11−3.55·TG
r = −0.4012 (P = 0.004)
r = −0.3240 (P = 0.020)
N = 51
Figure 8 correlation between percent change in triglyceride levels and percent change in unadjusted plasma total ePa + DHa; epanova and lovaza cohorts. Abbreviations: ePa, eicosapentaenoic acid; DHa, docosahexaenoic acid; corr, correlation.
Vascular Health and Risk Management downloaded from https://www.dovepress.com/ by 118.70.13.36 on 27-Aug-2020
Vascular Health and Risk Management
Publish your work in this journal
Submit your manuscript here: http://www.dovepress.com/vascular-health-and-risk-management-journal
Vascular Health and Risk Management is an international, peer-reviewed journal of therapeutics and risk management, focusing on concise rapid reporting of clinical studies on the processes involved in the maintenance of vascular health; the monitoring, prevention and treatment of vascular disease and its sequelae; and the involvement of
metabolic disorders, particularly diabetes. This journal is indexed on PubMed Central and MedLine. The manuscript management system is completely online and includes a very quick and fair peer-review system, which is all easy to use. Visit http://www.dovepress.com/ testimonials.php to read real quotes from published authors.
Dovepress
Dove
press
improvements in bioavailability of omega-3 free fatty acids
12. Hansen JB, Grimsgaard S, Nilsen H, Nordøy A, Bønaa KH. Effects of highly purified eicosapentaenoic acid and docosahexaenoic acid on fatty acid absorption, incorporation into serum phospholipids and postprandial triglyceridemia. Lipids. 1998;33:131–138.
13. Gura K, Strijbosch R, Arnold S, McPherson C, Puder M. The role of an intravenous fat emulsion composed of fish oil in a parenteral nutrition-dependent patient with hypertriglyceridemia. Nutr Clin Pract. 2007;22:664–672.
14. Australian Government: Department of Health and Ageing. Therapeutic Goods Administration. Australian Public Assessment Report (AusPAR) for omega-3-acid ethyl esters 90. 2010. Available from: http://www.tga. gov.au/pdf/auspar/auspar-omacor.pdf. Accessed March 22, 2013. 15. Chan DC, Watts GF, Mori TA, Barrett PH, Redgrave TG, Beilin LJ.
Randomized controlled trial of the effect of n-3 fatty acid supplemen-tation on the metabolism of apolipoprotein B-100 and chylomicron remnants in men with visceral obesity. Am J Clin Nutr. 2003;77: 300–307.
16. Yahagi N, Shimano H, Hasty AH, et al. A crucial role of sterol regulatory element-binding protein-1 in the regulation of lipogenic gene expression by polyunsaturated fatty acids. J Biol Chem. 1999;274:35840–35844. 17. Davidson MH. Mechanisms for the hypotriglyceridemic effect of marine
omega-3 fatty acids. Am J Cardiol. 2006;98:27i–33i.
18. Steffen BT, Steffen LM, Tracy R, et al. Ethnicity, plasma phospholipid fatty acid composition and inflammatory/endothelial activation bio-markers in the Multi-Ethnic Study of Atherosclerosis (MESA). Eur J
Clin Nutr. 2012;66:600–605.
19. Lemaitre RN, Tanaka T, Tang W, et al. Genetic loci associated with plasma phospholipid n-3 fatty acids: a meta-analysis of genome-wide association studies from the CHARGE Consortium. PLoS Genet. 2011;7:e1002193.
20. Kastelein JJP, Maki KC, Susekov A, et al. Dose response of a novel free-fatty acid formulation of omega-3 for the management of dyslipidemia in patients with severe hypertriglyceridemia EpanoVa fOr Lowering Very High TriglycErides (The EVOLVE Trial). Abstract APS.202.04 presented at the American Heart Association Scientific Sessions, Los Angeles, CA, November 6, 2012.
21. Maki KC, Orloff DG, Nicholls SJ, et al. A highly bioavailable omega-3 free fatty acid formulation improves the cardiovascular risk profile in high-risk statin-treated patients with residual hypertriglyceridemia (the ESPRIT Trial). Clin Ther. 2013. 2013 Aug 30. pii:S0149-2918(13)00807-2. doi: 10.1016/j.clinthera.2013.07.420. [Epub ahead of print].
22. Yokoyama M, Origasa H, Matsuzaki M, et al. Effects of eicosapen-taenoic acid on major coronary events in hypercholesterolaemic patients (JELIS): a randomised open-label, blinded endpoint analysis. Lancet. 2007;369:1090–1098.
Vascular Health and Risk Management downloaded from https://www.dovepress.com/ by 118.70.13.36 on 27-Aug-2020