Electrical Behavior of Garut Citrus Fruits During
Ripening
Changes in Resistance and Capacitance Models of
Internal Fruits
J. Juansah , I W. Budiastra, K. Dahlan and K. B. Seminar
Abstract -- The electrical behavior of Garut citrus fruits have been studied using impedance measurement at various levels of acidity, firmness, and frequencies. This research has been done as a step in order to study the internal citrus properties that do not damage it. So, the aim of the present study was to investigate the behavior of electrical properties and modeling of citrus fruits including internal resistance and its capacitance changes using nondestructive test. Electrical circuit models have been constructed using series and parallel configurations adopted from literature. The new model has been constructed on the based of the internal structure of citrus fruits. In the specific parameters of the resistor and capacitor which describes the internal condition of fruit, the results of simulations have high compatibility and the best deterministic coefficient is the new model. Profile graphs of electrical modeling results have shown the same form with the experimental results. Electrical conductance of intact citrus Garut increased exponentially while the impedance and capacitance decreases exponentially when the frequency is increased. The acidity and firmness changes lead to changes in internal electrical properties of Garut citrus fruits. Based on the new model, membrane capacitance and tissue resistance also can describe the acidity and firmness phenomenon of fruits. The resistances of part component of circuit model were declined as pH increases. While, both of capacitance and pH have positive correlations. In the firmness phenomenon, both of firmness and resistance have a line change, where increasing firmness, it also increases the value of resistance. But it not happens in capacitance behavior as firmness change. The capacitances were decreased as firmness improved.
Index Term-- Electrical impedance spectroscopy, Electrical models, Membrane capacitance, and Garut citrus.
I. INTRODUCTION
Citrus is a major world horticultural commodity, second only
J. Juansah
Biophysics Division, Physics Department
Bogor Agricultural University (IPB). Bogor 16680. West Java - Indonesia.
I W. Budiastra
Department of Mechanical and Biosystem Engineering Bogor Agricultural University (IPB). Bogor 16680. West Java - Indonesia.
K. Dahlan
Biophysics Division, Physics Department
Bogor Agricultural University (IPB). Bogor 16680. West Java – Indonesia.
to bananas in terms of volume of world trade (exports and imports) [1]. Citrus has specific consumers that may have contributed to the economy of a region. Differences in climate and other environmental factors make these commodity grow according to the place where its growth. This citrus has certain specifications and become famous as a typical fruit of a region. One of citrus varieties is Garut citrus fruits. Garut citrus fruits have the specific characteristics such as fragrant aroma, thick and juicy flesh, high in vitamin C content, etc. This orange has experienced a golden age in the 1980s. However, in the 1990s, the population declined sharply due to the disease of citrus vein phloem degeneration (CVPD). The local government launched a planting one million trees of Garut citrus and planned for completion in 2012. Garut citrus have been designated as National varieties of Indonesia in 1999. In addition, Garut citrus has been used as components of regional symbols in Garut area [2].
Agricultural products, such as citrus, are mostly perishable [3], short storage time, and cheap. However, demand for agricultural products will never desist as long as human population growth continues to increase. This is a problem and an opportunity to increase the added value of the products. In achieving these objectives requires a continuous assessment including in terms of technology, engineering, horticulture, even to the field of basic science.
Properties of these products caused by external factors such as weather, attacks of living things, and post harvest handling errors, and caused by internal factors, such as changes in chemical composition, metabolism, fiber conditions, moisture content, acidity, etc. To measure the properties of agricultural products is generally destructive. The products have been tested can not be marketed or consumed. To overcome this problem, many researchers developed a method that does not damage the material known as a non-destructive method. Non-destructive evaluation has recently been the subject of studies and researches. Most of the techniques invented by researchers are often expensive and impracticable in agricultural industry. Electrical measurements provide the opportunity to address this issue.
banana fruit decreased as a result of the ripening treatment and the best frequency of sine wave that can predict the level of ripeness was 100 kHz. The electrical impedance of kiwifruit during fruit ripening was studied by Bauchot et al. Their measurements were made on whole fruit, and tissues excised from the outer pericarp, inner pericarp and core. During ripening, there was little change in the impedance characteristics of the kiwi fruit, despite a 10-fold decrease in firmness [6]. Also, electrical impedance measurements were used to investigate some properties of agricultural products such as in tomato [7], nectarine [8], and meat [9] [10]. The Q value is a fairly good indicator of the loss of freshness in meat [11].
The system designed to performed an impedance measurements provide a non-destructive and rapid method to predict moisture and salt content, as in smoked fish products. These results are promising for the development of low-cost, rapid, and non-destructive [12].
Behavior of the electrical properties of materials is related to dielectric properties. Several important factors greatly influence the dielectric properties of materials. Some of these factors are related to the nature of the material (composition, structure), while others are associated with the conditions when electro heating is applied (temperature, frequency), and others are involved with the age or maturity stage of the food material [13].
Electrical impedance spectroscopy (EIS) measures the electrical properties of materials as a function of frequency. It is based on the interaction of an external electric field with the electric dipole moment of materials [14]. Also, EIS allows to built electrical models of the measured material in the form of an electrical circuit of resistors and capacitors and analyze its response to source signals of variable amplitude and frequency [15]. For example, the electrical impedance of citrus trees can be applied in models that describe their water requirements associated with transport mechanisms of xylem tissues [16]. Wu et al reported that the distributed model based on the Cole–Cole impedance equation gave the best fit to the measured impedance data of the fresh eggplant [14].
The electrical properties of the fruit are important in the cognitive aspect, especially to find out responses of the fruit to electric fields of variable frequency. The purpose of this study is to analyze the behavior of electrical properties and modeling of the Garut citrus fruit by using low voltage electrical signals that do not damage it. The electrical properties and modeling of the Garut citrus fruit also correlated to acidity and firmness in order to study the behavior of fruits during ripening.
I. MATERIALSAND METHODS
A. Materials
The experiment was carried out on seven groups of Garut citrus. The fruits were taken from Garut Regency (7°13′S 107°54′E), in Indonesia. Fruits were picked at ambient temperature. The measurements of all parameters were done when the fruits were still in fresh condition.
B. Measurement
The Firmness of citrus was measured by using force sensor (CI-6746, PASCO). The probe diameter of force sensor is 10 mm. Penetration depth of the force sensor on fruits is made constant level of 5 mm. The weight of these citrus was measured by using an electronic balance with an accuracy of 0.01 gram (Sartorius ED 822, Goettingen, Germany). The Citrus acidity was determined using a pH meter (YSI EcoSense pH 100, Xylem Inc., USA).
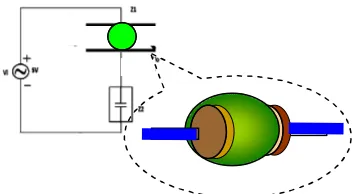
Electrical parameters of citrus fruits were measured by using LCR meter (3532-50 LCR HiTESTER, Hioki, Tokyo, Japan). These parameters are electrical impedance, conductance and capacitance. The samples of citrus are placed between two plate conductive electrodes, as dielectric material [17]. The conductive plates selected from copper material (Fig 1). The parameter values of electricity were measured within a frequency of 50 Hz to 1 MHz at 100 frequency points. The input voltage of the signal was 1 volt (rms). Each measurement of different shoots repeated three times and then the average is calculated.
In this investigation, the measured electricity was grouped based on the weight and acidity of citrus fruits to obtain a value of electricity in an attempt to compensate for the weight variation. It has also been done by Zachariah and Erickson in assessing the maturity of avocado fruits with a capacitance per weight measurement [18].
C. Analysis and modeling
We have used three equivalent electrical circuits to model the electrical parameters of citrus fruits. Basic modeling of the electrical circuit was based on the model at kiwi fruit [6] which adopted from Zhang’s model [19], and eggplant [14] which adopted from Hayden’s model [20]. The citrus models shown on Fig 2. Furthermore, we derive the equation of electrical parameters from those models. The results of equations were correlated with results of experimental data by curve fitting.
There are several equivalent circuits that may result in a good fit for a given data, and it is necessary to select the model that provides the best and most realistic representation of the sample. The choice should be based on the simplicity and consistency of the system’s properties and also on whether the circuit elements are connected in series or in parallel [21].
Fig. 1. The Schematic of measurement system to investigate the electrical properties of Garut citrus fruit. The capacitance sensing system adopted from
(a) (B)
(c)
Fig. 2. Electrical equivalent circuit for Garut citrus fruits: (a) lumped model of Hayden, (b) Zhang, and (c) the new model.
Based on experimental data, i.e. impedance, capacitance and conductance of citrus fruits, we conducted the prediction models of electrical circuit in order to study the phenomenon of internal electrical fruit. Subscripts of Z and H
on Fig 2 were indicating the notation for Zhang’s model and Hayden’s.
The equation for capacitance, conductance and impedance as a function of angular frequency ( ) can be derived from the electrical circuit in Fig. 2. The equation for the conductance (Geq) and capacitance (Ceq) of the Hayden’s
model showed in equations 1 and 2. While for the Zhang’s model equation shown in equations 3 and 4. The new model was created based on the constituent parts of the orange fruit, i.e. the outer shell, flavedo, albedo, seeds, segment, and wall segments. The conductance and capacitance values based on this new model shown in equations 5 and 6. An impedance equation (Z) was obtained from the equations 7.
2H , 1 H , 2 H , 1 H , 2 H , 1 H , 2 2 H , 1 2 H , 1 H , 2 H , eq X R R R R R X R R G (1)
2,H 1,H 1,H 2,H 1,H 2,H 1,H
2 H , 1 2 H , 1 H , 2 H , eq R R X R X R R ω X R R C (2) l k
Geq,Z (3)
n m
Ceq,Z (4)
42 2 2 4 4 2 eq R p s p pqR srR s G (5)
42 2 4 4 eq R p s ω prR sp 2 sqR C (6) eq eq ωC
1 j G
1
Z (7)
Where: j = imaginary number X= Electrical reactance. R= Electrical resistance
With additional symbols are:
2
Z , 1 Z , 2 Z , 3 Z , 1 Z , 2 Z , 3 Z , 2 2 Z , 1 Z , 2 Z , 3 Z , 1 Z , 2 Z , 3 Z , 1 Z , 2 Z , 3 Z , 1 Z , 2 Z , 3 Z , 1 Z , 2 Z , 3 Z , 1 Z , 2 Z , 1 Z , 2 X R R R R R X X X R R R R X X R R R R R R R X X R R k
2
Z , 1 Z , 2 Z , 3 Z , 1 Z , 2 Z , 3 Z , 2 2 Z , 1 Z , 2 Z , 3 Z , 1 Z , 2 Z , 3 Z , 1 Z , 2 Z , 3 Z , 1 Z , 2 Z , 3 Z , 2 Z , 1 Z , 3 Z , 1 Z , 2 Z , 2 Z , 1 Z , 2 X R R R R R X X X R R R R X R R R R R X X R R R X X R l
2
Z , 1 Z , 2 Z , 3 Z , 1 Z , 2 Z , 3 Z , 2 2 Z , 1 Z , 2 Z , 3 Z , 1 Z , 2 Z , 3 Z , 1 Z , 2 Z , 3 Z , 1 Z , 2 Z , 3 Z , 2 Z , 1 Z , 2 Z , 3 Z , 1 Z , 2 Z , 1 Z , 2 X R R R R R X X X R R R R ω X R R R R R X R R R X X R R m
2
Z , 1 Z , 2 Z , 3 Z , 1 Z , 2 Z , 3 Z , 2 2 Z , 1 Z , 2 Z , 3 Z , 1 Z , 2 Z , 3 Z , 1 Z , 2 Z , 3 Z , 1 Z , 2 Z , 3 Z , 1 Z , 3 Z , 1 Z , 2 Z , 2 Z , 1 Z , 2 X R R R R R X X X R R R R ω X X R R R R X R R R X X R n
X3 R2X1 X2 R2 R1 R3X1 R3R2R1 R3X2X1
p
R2R1 X2X1 R3 R2 R1
q
R2X1 X2 R2 R1 R3X1
r
X3R2R1 X3X2X1 X3R3R2 R1
X2R3
R2 R1
1 R3R2X1
s
For the linearity and error parameters based on electrical modeling and selected variables, all data were subjected to regression analysis using the Microsoft Excel program (Version 2007). To study the behavior of fruits changes during ripening, all internal parameters of resistors and capacitors model are correlated to firmness and pH of citrus.
II. RESULTS AND DISCUSSIONS
Capacitance describes the ability of capacitors to store energy and electrical charge. The presence of a dielectric material in capacitors causes an increase in the capacitance value. The dependence of dielectric parameters have been examined by plotting curves between capacitance and frequency as shown in Fig.3. The capacitance of Garut citrus fruit decreases with increase in frequency, which exhibits the dielectric dispersion in the orange fruit. Changes in capacitance of citrus fruits are varied, i.e. at low frequency has a value range of about 0.001 pF/Hz and 0.05 pF/Hz at high frequency. High values of capacitance at low frequency (50 Hz) could be attributed to high mobility of dipole due to free water state and electrode polarization. Frequency changes will affect the condition of the ions in the material. Ionic loss is inversely proportional to frequency and become critical as we go to the lower frequency. Dissipation of dipolar energy at higher frequencies is less dominant and ionic loss become almost absent [22].
change in the direction of an external electric field. Changes in the external electric field will be followed by changes in the internal electric field of the fruit. Increased frequency will increase the speed of dipole changes. Thus, the frequency of the electrical signal will have consequences on the time for polarization. The value of high frequency means a short time in the polarization. Thus, the total polarity would be low.
TABLE I
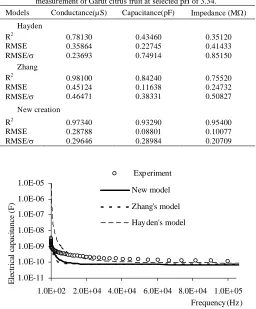
Linearity and error for the electrical parameters between model results and measurement of Garut citrus fruit at selected pH of 3.34.
Models Conductance(µS) Capacitance(pF) Impedance (M)
Hayden
R2
RMSE
RMSE/
0.78130 0.35864 0.23693
0.43460 0.22745 0.74914
0.35120 0.41433 0.85150 Zhang
R2
RMSE
RMSE/
0.98100 0.45124 0.46471
0.84240 0.11638 0.38331
0.75520 0.24732 0.50827
New creation
R2
RMSE
RMSE/
0.97340 0.28788 0.29646
0.93290 0.08801 0.28984
0.95400 0.10077 0.20709
1.0E-11 1.0E-10 1.0E-09 1.0E-08 1.0E-07 1.0E-06 1.0E-05
1.0E+02 2.0E+04 4.0E+04 6.0E+04 8.0E+04 1.0E+05 Frequency (Hz)
E
le
ct
ri
ca
l
ca
p
ac
it
an
ce
(
F
)
Exp eriment
New model
Zhang's model
Hay den's model
Fig. 3. Experimental and modeling results for the total electrical capacitance of Garut citrus at various frequencies. Selected sample at pH of 3.34.
1.0E-07 1.0E-05 1.0E-03 1.0E-01 1.0E+01
1.00E+02 2.00E+05 4.00E+05 6.00E+05 8.00E+05 1.00E+06 Frequency (Hz)
E
le
ct
ri
ca
l
co
n
d
u
ct
an
ce
(S
)
Experiment Zhang's model Hayden's model New model
Fig. 4. Experimental and modeling results for the total electrical conductance of Garut citrus at various frequencies. Selected sample at pH of 3.34
1.0E+03 1.0E+04 1.0E+05 1.0E+06 1.0E+07
0.00E+00 2.00E+05 4.00E+05 6.00E+05 8.00E+05 1.00E+06
Frequency (Hz)
E
le
ct
ri
ca
l
im
p
ed
a
n
ce
(
O
h
m
)
Experiment
Zhang's model Hayden's model New model
Fig. 5. Experimental and modeling results for the electrical impedance of Garut citrus at various frequencies. Selected sample at pH of 3.34
For proper description of the dielectric behavior of the citrus fruit and other biological materials, however, contributing phenomena other than dipolar relaxation also need to be taken into account, such as the ionic conduction at lower frequencies, the behavior of bound water, and the influence of constituents other than water.
The experimental results for the electrical conductance of citrus fruits as a function of signal frequency are shown in Fig. 4. Electrical conductance values for citrus fruits at any given frequency range is very small. The highest conductance value is in the range of mS (at 1 MHz). Based on the slope of the curve in Fig.4, the value of the electrical conductance changes that occur in citrus fruit is very small, i.e. at low frequency has a value range about 0.0011 S/Hz, and at high frequency has a value approximately 0.0002 S/Hz. Garut citrus shows resistive properties, so it is an insulator or a poor conductor. Thus, the ions and electrons in the citrus fruit, seeds, skin, and flesh are bound relatively stable. The low conductance indicates ions strongly bound to the constituent substances of citrus fruit.
Frequency also describes the signals transmission every second and a number of alternating current changes per second. If the frequency is enlarged, the rate of changing current direction in the external circuit will be faster. This is the external condition of the electrical signal that will affect the internal conditions of Garut citrus, especially on the mobility of electric charge.
Electrical conductance values expressed the ability of charge movement in the material and depended on the number of ions or free electrons of the material. Electron of conductive material is easy to follow changes in the external alternating current. Thus, the increasing of electrical conductance would easily occur if the frequency is increased. While the resistive material is not easily occur. So, the increasing in frequency only slightly changes the conductance value of the resistive material. This occurs also in citrus fruits.
of the signal will increase the rate of movement of electric charge, so the ions move in orange will be more effective.
If the frequency is increased, then the value of electrical impedance of citrus fruits also decreased. This is clearly seen in Fig.5. Electrical impedance acts as a friction to movement of electric charges that occur in materials. Magnitude of electrical impedance in the circuit is influenced by the frequency, resistance and reactance. At very low frequencies the reactance will be large, so that its impedance will be large too. When the frequency is increased, the reactance will decrease. This correlates with a decreasing in impedance. The change in electrical impedance that occur at low frequency interval has great value, which is about 637.75 /Hz. While at higher frequencies have a very small change, which is about 0.0033 /Hz.
Impedance value is also the total resistance of alternating current that correlated to the conductance and capacitance as a function of frequency. Capacitive reactance is the imaginary impedance and its value is inversely proportional to the multiplication of capacitance and frequency, while the conductance is inversely proportional to resistance. When the frequency increases, the conductance value also increased. This would correlate with a decrease in impedance. While the decline in the value of the capacitance and increase in frequency will be correlated with a decrease in impedance values. Both capacitance and conductance phenomenon would strengthen the mutual impedance values. Overall, the impedance will decrease if the frequency is increased.
A number of models (circuit diagrams) have been used to describe the flow of current through plant tissues. Zhang and Willison [24] fitted these models to data collected using blocks of tissue excised from carrot root and potato tuber, and they found that the model presented in Fig. 2a most closely fit their data. Inherent in this model is the transmembrane resistance, which is generally assumed to be so high that it can be excluded from the analysis [19].
y = 71.274x3 - 602.71x2 + 1341.7x + 525.89
R2 = 0.9973
5.E+02 7.E+02 9.E+02 1.E+03 1.E+03
2.50 3.00 3.50 4.00 4.50 5.00
p H
R
e
si
st
a
n
c
e
o
f
R
1
(
O
h
m
)
(a)
y = -59 59 .8x3 + 94 08 8x2 - 4 75 07 6x + 82 87 56
R2 = 0.9 91 8
2 .E + 04 4 .E + 04 6 .E + 04 8 .E + 04 1 .E + 05 1 .E + 05
2.5 0 3 .0 0 3.5 0 4 .0 0 4.5 0 5.0 0 p H
R
e
si
st
a
n
c
e
o
f
R
2
(
O
h
m
)
(b)
y = 3E+06x3 - 3E+07x2 + 1E+08x -
1E+08
R2 = 0.9983
0.E+00 2.E+06 4.E+06 6.E+06 8.E+06 1.E+07
2.50 3.00 3.50 4.00 4.50 5.00
pH
R
e
si
st
an
ce
o
f
R
3 (
O
h
m
)
(c)
y=-4E+06x3 +5E+07x2 - 2E+08x +
3E+08
R2 = 0.9976
0.E+00 4.E+06 8.E+06 1.E+07 2.E+07
2.50 3.00 3.50 4.00 4.50 5.00
pH
R
es
is
ta
n
c
e
o
f
R
4 (
O
h
m
)
(d)
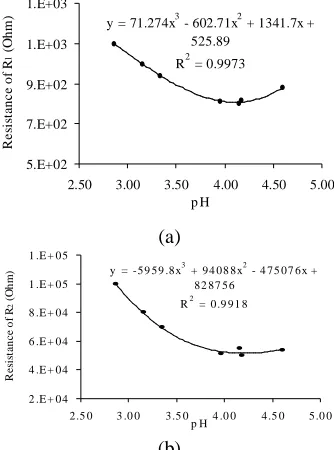
Fig. 6. The electrical resistance changes of internal component of Garut citrus
at various acidity based on modeling results. Internal resistance changes for R1
(a), for R2 (b), for R3 (c) and for R4 (d).
However, in nectarine fruit tissue this assumption may not be correct since membranes are known to become leaky during ripening of stonefruit. Justification for the identification of the cell wall and vacuole resistances is well established by Harker and Dunlop in nactarine [8]. Also, in citrus fruit tissue all assumption may not be correct since the internal tissue more complicated. Justification for the identification of the resistance of seeds (R1), resistance of segment (R2), resistance of
segment wall (R3), resistance of outer shell (R4), capacitance
of segment (C1), capacitance of albedo (C2), and capacitance
of flavedo (C3) are more reliability.
The modeling results of the electrical circuit also shown in Fig. 3, 4, and 5. Simulation results of capacitance, conductance, and impedance profiles show similarity with experimental results. It was obtained by inserting specific values of the capacitor and resistor to models equation. This indicates that the electrical component values which represent the electrical properties for internal of citrus are specific. The value for each resistor is large enough. This is possible because the condition of citrus fruit has a lot of insulating materials such as oil, sugar, starch, pectin, and vitamins [23]. While the value for the capacitor component is very small. It is also possible because some of the membrane on the fruit has relatively low capacitive properties, and the membranes surrounding small areas separately.
electrical impedance. It means that the new improved model is the best estimation model for Garut citrus.
According to Fig. 3, the electrical capacitance of the Hayden’s model results are less suitable than others, especially at frequencies below 10 kHz. At this frequency, the modeling result looks really deviate from the experiment results. This is also shown graphically as well as with the determination coefficient which has low value. However, at frequencies above 10 kHz shows good fit to experimental data for citrus fruit. While, the capacitance based on Zhang's model is relatively more close to the experimental data than the Hayden’s model. An improvement in the Zhang’s model is done by inserting an additional circuit in accordance with the physical condition of an orange. The results show that the new model is best suited to the experimental data in almost every frequency. This is also shown graphically as well as with the determination coefficient which has highest value and low of error (Table 1).
Conductance values based on the Hayden’s model for frequencies below 50 kHz shows a good fit with experimental data for citrus fruit, but at frequencies above 50 kHz shows a low compatibility. While the results of the Zhang’s model and the new model has a chart that is very close to the experimental data on the all range of frequencies. In the frequency range 100 kHz to 1MHz, the model of Zhang does not have a good match. At these frequencies, the modeling results of Zhang appear larger than the experimental data. Thus, the correlation between the model with experimental results is not high enough, i.e. 0.7813. This is in contrast with the new model. This new model has the highest compatibility. That is evidenced by the high value of coefficient deterministic, i.e. 0.9734. Overall, all models have the good fit conductance at a lower frequency of 50 kHz and the new model has the best fit at all frequencies.
y = -0.1246x3 + 8.9178x2 - 185.72x +
2007
R2 = 0.9553
5.E+02 7.E+02 9.E+02 1.E+03 1.E+03
2.50 12.50 22.50 32.50
Firmnes s (N)
R
e
si
st
a
n
c
e
o
f
R
1
(
O
h
m
)
(a)
y = 5.3354x3 - 198.61x2 + 3612.9x + 27145
R2 = 0.9933
2.E+04 4.E+04 6.E+04 8.E+04 1.E+05 1.E+05
2.50 12.50 22.50 32.50
Firmn es s (N)
R
e
si
st
a
n
c
e
o
f
R
2 (
O
h
m
)
(b)
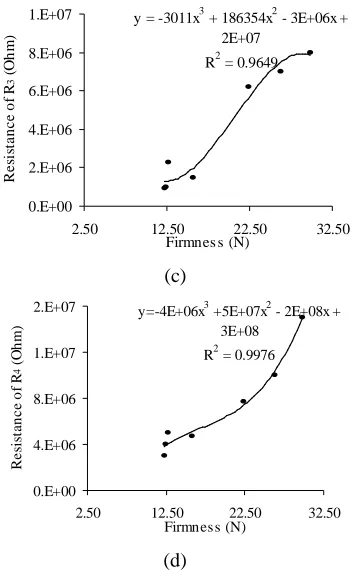
y = -3011x3 + 186354x2 - 3E+06x +
2E+07
R2 = 0.9649
0.E+00 2.E+06 4.E+06 6.E+06 8.E+06 1.E+07
2.50 12.50 22.50 32.50
Firmnes s (N)
R
e
si
st
a
n
c
e
o
f
R
3
(
O
h
m
)
(c)
y=-4E+06x3 +5E+07x2 - 2E+08x +
3E+08
R2 = 0.9976
0.E+00 4.E+06 8.E+06 1.E+07 2.E+07
2.50 12.50 22.50 32.50
Firmnes s (N)
R
e
si
st
an
c
e
o
f
R
4 (
O
h
m
)
(d)
Fig. 7. The electrical resistance changes of internal component of Garut citrus at various firmness based on modeling results. Internal resistance changes for
R1 (a), for R2 (b), for R3 (c) and for R4 (d).
Based on the results in Fig.5, the simulation results have a high compatibility with the experimental results for citrus fruit at very low frequencies. But, the simulation results show deviations from the experimental results at the frequency range of 1 kHz to 50 kHz. Largest deviations occur for the model adopted from Zhang. At frequencies above 50 kHz it shows fit again. Thus, the consequences of deviations in some frequency causes a curve fitting is not good. This is evidenced by the very low coefficient of deterministic for the Zhang model. Meanwhile, the impedance value of the new model is best suited to the experimental data for all frequencies (Table 1).
Based on the internal resistance model, all of the resistances have high value. It is correlated to the resistive properties of Garut citrus. Value of R4 (flesh / outer shell resistance) is a
highest value (Fig 6 and 7). It is possible because of its large size and compositions. While, the seeds of citrus (R1) has
lowest resistance. It may cause by the size and amounts in the fruit are relatively small. Also, in plant tissues, the resistance of an extracellular pathway should be high because of the small cross-sectional area of the wall and the low concentration of mobile ions [8].
of many parts of juice sacs membrane [23] that arranged in series. So the total capacitance of the segment will be small.
Citrus fruits are non-climacteric, they do not ripen after harvest and do not show any respiratory rise accompanied by major changes in flavor and biochemical composition after harvest in relation to ripening [23]. Immature fruit is usually very acid and has an internal texture that is coarse.
In this study, the maturity behaviors of citrus fruit are characterized by a pH increasing and firmness declining. The pH of citrus juices also provides an idea about the acidity of fruit, and it could be one way of expressing acidity. The firmness provides a texture of fruit. Decreasing the acidity of fruit marked with decreasing concentration of hydrogen ions, accompanied by a decrease in firmness of fruit. It was a scene when the fruit has increased maturity.
During normal fruit ripening, firmness declines and the melting texture characteristic of fruit develops because of changes in cell wall composition and cell wall hydration [8].
The decrease in acidity was considered to be due to dilution as the fruit increased in size and in juice content. Organic acids are respiratory substrates in the fruit. Higher respiratory quotient (CO2 produced/O2 consumed) indicates utilization of
acids, mainly citric and malic acids through the TCA (tricarboxylic acid) cycle, in which acids are oxidized and ATPs are formed for synthesis of new compounds. Several metabolites are formed during the process [23].
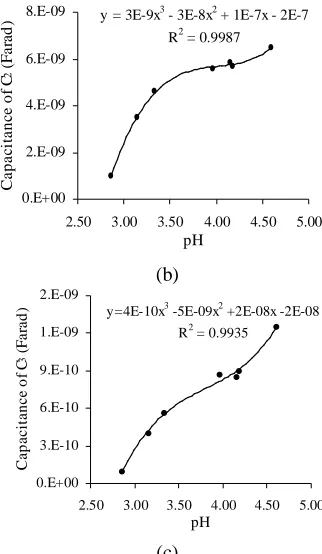
Decreasing in acidity of the fruit is accompanied by decreasing internal resistance (R1 to R4) and increasing in
membrane capacitance (C1 to C3) as showed in Fig 6 and 8.
The entire figure shows nonlinear relationship. A decrease in internal fruit resistance may be related to increased concentration of mobile ions in cell wall and/or increase in cross-section of the cell wall.Cell wall resistance declined as freshly harvested fruit ripened, and this decline was closely related to changes in fruit texture. Increasing in firmness or texture of the fruit is accompanied by increasing internal resistance (Fig 7) and decreasing in membrane capacitance (Fig 9). An increase in internal fruit resistance may be related to decrease surface area of the cell wall [8].
During ripening, extensive changes may occur in the cell wall, membranes and the composition of the cell contents [25]. All of these changes would affect the capacitance of the tissues. If the permeability of membranes around the cytoplasm were affected in such a way as to eliminate ionic polarization in the region of the membrane, large changes in capacitance would occur. Thus, effects on membranes and interfaces could be a major cause of changes in both the electrical resistance and impedance in citrus.
y = 2 E - 1 1 x3
- 2 E - 1 0 x2
+ 8 E - 1 0 x - 9 E - 1 0 R2 = 0 . 9 9 7 2
0 . E + 0 0 3 . E - 1 1 6 . E - 1 1 9 . E - 1 1 1 . E - 1 0 2 . E - 1 0
2 . 5 0 3 . 0 0 3 . 5 0 4 .0 0 4 . 5 0 5 . 0 0
p H
C
ap
a
ci
ta
n
c
e
o
f
C
1
(
F
a
ra
d
)
(a)
y = 3E-9x3 - 3E-8x2 + 1E-7x - 2E-7
R2 = 0.9987
0.E+00 2.E-09 4.E-09 6.E-09 8.E-09
2.50 3.00 3.50 4.00 4.50 5.00
pH
C
a
p
a
ci
ta
n
ce
o
f
C
2
(
F
a
ra
d
)
(b)
y=4E-10x3 -5E-09x2 +2E-08x -2E-08 R2 = 0.9935
0.E+00 3.E-10 6.E-10 9.E-10 1.E-09 2.E-09
2.50 3.00 3.50 4.00 4.50 5.00
pH
C
a
p
a
c
it
a
n
c
e
o
f
C
3 (
F
a
ra
d
)
(c)
Fig. 8. The changes of capacitance component from modeling results of Garut
citrus at various acidity. Membrane capacitance changes for C1 (a), for C2 (b),
and for C3 (c).
y =2E-11x3 -2E-10x2 +8E-10x
-9E-10
R2 = 0.9972
0.E+00 3.E-11 6.E-11 9.E-11 1.E-10 2.E-10
2.50 12.50 22.50 32.50
Firmness (N)
C
a
p
a
c
it
a
n
c
e
o
f
C
1 (
F
a
ra
d
)
(a)
y = 3E-9x3 - 3E-8x2 + 1E-7x - 2E-7
R2 = 0.9987
0.E+00 2.E-09 4.E-09 6.E-09 8.E-09
2.50 12.50 22.50 32.50
Firmness (N)
C
a
p
a
c
it
a
n
c
e
o
f
C
2 (
F
a
ra
d
)
y = 4E-10x3 -5E-09x2 + 2E-08x -2E-08
R2 = 0.9935
0.E+00 3.E-10 6.E-10 9.E-10 1.E-09 2.E-09
2.50 12.50 22.50 32.50
Firmn es s (N)
C
a
p
a
c
it
a
n
c
e
o
f
C
3
(
F
a
ra
d
)
(c)
Fig. 9. The changes of capacitance component from modeling results of Garut
citrus at various firmness.Membrane capacitance changes for C1 (a), for C2
(b), and for C3 (c)
III. CONCLUSIONS
Interpretation of electrical properties gives a chance to study the behavior of Garut citrus fruits maturity. None of the electrical models was able to predict all of the behavior changes expected to occur during ripening. The models have improved our understanding of Garut citrus fruit ripening that membrane capacitance and tissue resistance changes are accompanied by firmness and acidity changes in fruits. The changes of tissue resistance and membrane capacitance indicate the changes in mobility of ion in cell and physiological changes of fruits during ripening.
The scope of all discusion of this papers be used only for the healthy citrus fruits. However, this paper does not examine the contents of fruits damage, disorder, or biological activity associated with the electrical behavior of citrus. This limitations should be taken into account when this method is proposed as a comprehensive evaluation to study the behavior and properties of citrus fruit.
IV. FUTURE WORK
In future studies, the dominant frequency of the electrical signal that can detect changes in the internal properties of the fruit needs to be assessed accurately. Resonance frequency of the fruit also needs to be studied as a consideration in the determination of fruit quality. The correlation between the qualities of citrus fruit with electrical parameters needs to be studied more comprehensive. So the prediction of fruit quality parameters based on the electrical properties can be found.
V. REFERENCES
[1] R. Storey and R.R. Walker. 1999. “Citrus and salinity,” Scientia
Horticulturae, vol 78, pp 39-81.
[2] The Government of Garut Regency, 2010, Garut Luncurkan
Penanaman Sejuta Pohon Jeruk Garut. Www.Garutkab.go.id. Accessed on Dec. 2011.
[3] N.N. Mohsenin, 1986. Physical Properties of Plant and Animal
Material. Gordon and Breach Press, New York, USA.
[4] M. Soltani, R. Alimardani, and M. Omid, 2011. “Use of dielectric
properties in quality measurement of agricultural products,” Nature and Science, vol 9, no 4, pp 57-61.
[5] M. Soltani, R. Alimardani, and M. Omid, 2011. “Evaluating banana
ripening status from measuring dielectric properties,” Journal of Food Engineering vol 105, pp 625–631.
[6] A.D. Bauchot, F. R. Harker, and W.M. Arnold, 2000. “The use of
electrical impedance spectroscopy to assess the physiological condition of kiwifruit,” Postharvest Biology and Technology, vol 18, pp 9–18.
[7] A.R. Varlan, and W. Sansen, 1996. ”Nondestructive electrical
impedance analysis in fruit: normal ripening and injuries characterization,” Electro-Magnetobiology, vol 15, pp 213–227.
[8] F.R. Harker, and J. Dunlop, 1994. “Electrical impedance studies of
nectarines during cool storage and fruit ripening,” Postharvest Biology and Technology, vol 4, no 1–2, pp 125–134.
[9] J.L. Damez, S. Clerjon, and S. Abouelkaram, 2005. “The use of
electrical impedance spectroscopy to mesostructure assessed by alternating current spectroscopy during meat ageing,” In Proceedings of the 51 international congresses of meat science and technology, pp 327-330.
[10] J.L Damez, S. Clerjon, S. Abouelkaram, and J. Lepetit, 2007.
“Dielectric behavior of beef meat in the 1-1500 kHz range: Simulation with the Fricke/Cole-Cole model,” Meat Sci., vol 77, pp 512-519.
[11] Z. F. Ghatass, M.M. Soliman, and M.M. Mohamed, 2008. “Dielectric
Technique for Quality Control of Beef Meat in the Range 10 kHz - 1 MHz,” American-Eurasian Journal of Scientific Research, vol 3, no 1, pp 62-69.
[12] P. Karásková, A. Fuentes, I. Fernández-Segovia, M. Alcañiz, R.
Masot, and J.M. Barat, 2011. “Development of a low-cost non-destructive system for measuring moisture and salt content in smoked fish products,” Procedia Food Science, vol 1, pp 1195-1201.
[13] M.E. Sosa-Morales, L. Valerio-Junco, A. López-Malo, H. S. García,
2010. “Dielectric properties of foods: Reported data in the 21st century and their potential applications,” LWT - Food Science and Technology, vol 43, pp 1169-1179.
[14] L. Wu, Y. Ogawa, and A. Tagawa, 2008. “Electrical impedance
spectroscopy analysis of eggplant pulp and effects of drying and freezing–thawing treatments on its impedance characteristics,” Journal of Food Engineering, vol 87, pp 274–280.
[15] E. Vozáry, and P. Benkő, 2010. “Non-destructive determination of
impedance spectrum of fruit flesh under the skin,” Journal of Physics: Conference Series, vol 224, no 012142.
[16] N. Muramatsu, and K. Hiraoka, 2007. “Water status detection of
satsuma mandarin ( citrus unshiu Marc) trees using an electrical impedance method,” Environ. Control Biol, vol 45, no 1, pp 1-7.
[17] M. Soltani, R. Alimardani, and M. Omid, 2010. “Prediction of banana
quality during ripening stage using capacitance sensing system,” AJCS, vol 4, no 6, pp 443-447.
[18] G. Zachariah, L. C. Erickson, 1965. “Evaluation of some physical
methods for determining avocado maturity,” California Avocado Soc. Yearbook, vol 49, pp 110-115.
[19] M.I.N. Zhang, D. G. Stout, J. H. M. Willison, 1990. “Electrical
impedance analysis in plant tissues: symplasmic resistance and membrane capacitance in the Hayden model,” Journal of Experimental Botany. Vol 41, no 224, pp 371–380.
[20] R. I. Hayden, C. A. Moyse, F. W. Calder, D. P. Crawford, D.S.
Fensom, 1969. “Electrical impedance studies on potato and alfalfa tissue,” Journal of Experimental Botany, vol 20, no 63, pp 177–200.
[21] H. Ozier-Lafontaine, and T. Bajazet, 2005. “Analysis of root growth
by impedance spectroscopy (EIS),” Plant and Soil, vol 277, pp 299– 313.
[22] S. P. Singh, P. Kumar, R. Manohar, and J. P. Shukla, 2010.
”Dielectric Properties of Some Oil Seeds at Different Concentration of Moisture Contents and Micro-fertilizer,” International Journal of Agricultural Research, vol 5, no 8, pp 678-689.
[23] M. S. Ladaniya, 2008. Citrus Fruit, Biology, Technology and
Evaluation. Elsevier Inc. Printed and bound in the USA. 574 pp.
[24] M. I. N. Zhang, and J. H. M. Willison, 1991. “Electrical impedance
analysis in plant tissues: a double shell model,” J. Exp. Bot., vol 42, pp 1465-1475.
[25]. R. C. Bean, J. P. Rasor, G. G. Porter, 1960. “Changes in electrical