Abstract—This research conducted a study on non-financial performance relationship with a financial performance. The framework used is the Balanced Scorecard. Non-financial performance is represented by faculty satisfaction, service quality and student satisfaction, while financial performance is represented by the financial sustainability. In this research, the data collection is done by distributing questionnaires to the faculty and students. The Partial Least Square for Multivariate Analysis is employed for processing the data. The result of this research is useful to be able to explore more deeply the relationship between each of the indicator whether non-financial and the financial sustainability.
Index Terms—Non-financial performance, financial performance, faculty, student and Balanced Scorecard.
I. INTRODUCTION
In today's era, the competition in education services is very tight, especially at the university level. Growth in the number of universities has increased rapidly every year. A growing number of new universities are founded every year that have even tightened the competition. According to data released by Indonesia Higher Education Department, the number of universities in Indonesia increasing, it is reported that in 2008 there were 2556, in 2009 there were 2596, in 2010 there were 3017 and last in 2013 there were 3812. Many universities are competing to recruit students each year. Realizing the rapid growth and increasing competition, it is of course necessary for a university to keep the performance high so that more students are interested to enroll. Particularly now that more and more parents of students who want to enroll their children to universities that have the best quality, it is necessary that the university performance is optimal from time to time.
In higher education context (university), according to Balanced Scorecard (BSC) framework, the fundamental factor of Service Quality is Faculty Satisfaction. Service quality will influence student satisfaction and then student satisfaction will influence financial performance or financial sustainability. This is the framework which is developed by Kaplan and Norton in the concept of Balanced Scorecard. Some researches related to Balanced Scorecard have been done recently, such as one research done by Yee et al [1] entitled “The Impact of Employee Satisfaction on Quality and Profitability in High-Contact Service Industries” and by
Manuscript received May 1, 2013; revised July 13, 2013.
The authors are with the Petra Christian University (e-mail: [email protected]).
II. FINANCIAL PERFORMANCE
III. NON FINANCIAL PERFORMANCE:FACULTY
SATISFACTION
Faculty satisfaction is a fundamental factor which determines financial performance in university context. Hence, faculty satisfaction is the representative of employee satisfaction. Robbins [6] affirms that employee satisfaction refers to the general attitude of an individual employee toward his job. Someone who has high employee satisfaction
Josua Tarigan and Deborah Christine Widjaja
The Relationship between Non-Financial Performance and
Financial Performance Using Balanced Scorecard
Framework: A Research in Education Context
Devie et al. [2] entitled “The Relationship between Non-Financial Performance and Financial Performance Using Balanced Scorecard Framework: A Research in Cafe and Restaurant Sector”. Besides financial performance, non-financial performance is essential to be analyzed, because non-financial performance will determine the market value of the business organization. This is the spirit of Balanced Scorecard in which faculty satisfaction, service quality, student satisfaction, and financial performance are considered as a four-balanced quadrant that drives organizational strategy initiatives. If there is one of the quadrants with less attention then the organization will lose the balance that will cause the organization unable to achieve the organization's strategy.
is more likely to demonstrate positive attitude toward his job; whereas, someone who is not satisfied with his job is more likely to exhibit negative attitude toward his job. Moreover, Davis [7] reveals that job satisfaction refers to a collection of employee feelings on how pleasant or unpleasant his job is. Davis presented the employee satisfaction factor in his method called Job Descriptive Index (JDI). In this research, there are five indicators of job descriptive index, namely: the job itself, pay, supervision, co-workers, and promotions [1], which are employed to measure the feeling or attitude on satisfaction which is revealed by employees. What is meant by the job itself is the work done by the job holders daily; whether the work matches the educational backgrounds, the ability, interests and skills of the job holders [8].Pay can be salary or wage. Salary is the fixed remuneration paid to employees periodically which has a definite assurance in its payment. While wage is remuneration paid to employees by referring to the treaty agreed upon payment. Each employee has different motive and expectation upon salary or wage that he or she receives. However, according to Cushway [9] most people would probably agree that employees would always find a fair salary or wage that is interpreted by the organization through a good payroll system. Moreover, supervision is the monitoring if the work plan has been done right or not. It is the process that ensures that the action is in accordance with the plans. Co-workers as a fourth indicator is defined as a level of relationship in which colleagues can demonstrate competence, friendliness, and mutual respect that allows the creation of a social harmony, a supportive work environment, which in turn makes a job more enjoyable [10]. Lastly, promotion according to Nitisemito [11] is a process of employee movement from one position to another position higher.
IV. NON-FINANCIAL PERFORMANCE:SERVICES QUALITY
Faculty satisfaction will determine the service quality delivered by the university to the students. According to Bets, et al [12] there are six factors that can be used to measure the service quality of an educational institution. First, Policies and Procedures, which measures the student satisfaction with all sorts of rules and procedures that apply. Secondly, Physical Condition, which measures the student satisfaction with the physical condition of campus facilities. Third, Student Fulfillment, which measures the feelings of student satisfaction in getting useful things during the learning process. Fourth, Quality of Education, which measures the student satisfaction with the performance of the campus in the academic aspects. Fifth, Social Life, which measures the student satisfaction with the social life in the campus environment. Last, Recognition, measures the student satisfaction with the behavior of the entire campus staff towards the student.
V. NON-FINANCIAL PERFORMANCE:STUDENT
SATISFACTION
Customer satisfaction in an educational institution refers to the satisfaction of the students who are studying in the
institution. It is very important to maintain the student satisfaction to be able to improve the financial sustainability of the educational institution. The meaning of student satisfaction itself is basically similar to customer satisfaction. According to Though [13], student satisfaction usually refers to how the behavior shown by the students facing every activity at the university campus. Though stated that there are three measures of student satisfaction. First, the student was pleased with the learning activities available on the campus. When a student feels satisfied with the available learning activities on campus, then he will feel happy to follow the learning activities in campus. The student feels that by following the learning activity on the campus, it will bring about a good thing for himself.
Second, students play an active role during the learning activity takes place. Students who were satisfied with the learning process will show an active attitude during the event took place. Students show an active attitude because they feel that the learning process is interesting so that they are keen to participate in the process. However, when students showed passivity during the learning process then it shows students are not satisfied with the process of learning that takes place. Third, students actively participated in the activities on campus, such as student activities. Students who are satisfied with the campus performance will demonstrate an active attitude in activities on campus, such as following student activities on campus, attending seminars on campus, and many others. By showing activeness in campus activities indicates that the students were satisfied with the performance of its campus so that they want to involve actively in any campus activities available.
VI. THE HYPOTHESIS
Faculty satisfaction which in this case is the employee of a university will bring an enormous influence on the performance and quality of service they provide to students. If the teacher has a good performance then the teacher job satisfaction is also good, but if performance is poor then the teacher satisfaction is also poor [14]. Teachers who are satisfied with the work place will be fully committed and provide the best of their capabilities. Teachers who are satisfied consider that giving the best is remuneration for services provided by their workplace. The theory used as a basis that faculty satisfaction affects the quality of service is the principle of equity in social exchange theory. Wayne et al (1997) and Flinn (2005) in Yee et al [1] states in the context of social exchange theory as a superior offer working conditions that can make employees feel satisfied, and then in turn employee will provide the employer a commitment to provide better performance for the organization leading to a higher quality of service. Based on these studies, the first hypothesis is proposed:
H1: Faculty satisfaction has a positive and significant influence on service quality.
employee satisfaction is good, it would promote good performance. The employees, in this case, are the teachers.
Meanwhile, according to Taylor and Baker [15] customer satisfaction, in this case, student satisfaction is formed by the willingness and ability of service providers who serve customers as reflected in employee performance. According to Robbins and Judge [16], the evidence shows that satisfied employees can improve customer satisfaction and loyalty. In educational organizations, maintenance and student heritage depend on how teachers relate to students. Teachers who are satisfied tend to be more friendly, cheerful and responsive which the students appreciate. Based on these studies, the second hypothesis is proposed:
H2 : Faculty satisfaction has a positive and significant influence on student satisfaction.
Good service quality provided by the organization to the customer will have a positive impact on customer satisfaction. Customer of a university is a student studying in the university. Students will feel satisfied and loyal to the university. Meanwhile, when the poor service quality is provided, the students will not feel satisfied with the university and not to be loyal to the university. Many studies have shown that good service quality would give good impact to customer satisfaction.
H4: Student satisfaction has a positive and significant influence on financial sustainability.
In the Balanced Scorecard concept, it is explained that there is a causal relationship from four perspectives [18]. Similarly, the influence of faculty satisfaction can also affect
the financial sustainability gained by the organization. Faculty satisfaction described as learning and growth perspective has a major role to the financial sustainability representing a financial perspective to be gained by an organization. In this case, the faculty satisfaction will make teaching performance better and at the same time, the service delivered by the teacher will become better as well. Then the students who are satisfied with the service will be loyal to the organization or university. Student loyalty will bring students to always return to the university in the future and encourage them to recommend the university to someone else. This will bring good financial sustainability for the university. Based on these studies, the fifth hypothesis is proposed:
H5: Faculty satisfaction has a positive and significant influence on financial sustainability.
Good service quality will bring an organization to achieve good financial sustainability. The findings of the preceding study showed that the increase in quality will enable the organization to profit as well as gaining higher market share and premium prices [19]. In one study, Gale [20] found that businesses that make effort to increase the service quality above average set price 8% higher than their competitors. Based on these studies, the sixth hypothesis is proposed:
H6: Service quality has a positive and significant influence on financial sustainability.
VII. SAMPLING AND STATISTICAL TESTING
Population in this research is faculty and student of one business school in Surabaya. In multivariate calculation, the number of samples are minimum 10 times more than the number of research variables. Therefore, the minimum samples of this research are 80 respondents, which is 40 from both faculties and students. Moreover, the sampling method is using purposive sampling. This research employs in total 90 faculty respondents and student respondents, which 45 for each group. Several phases of data analysis and data validation are done such as: validity test, reliability test and other analysis using Partial Least Square (PLS). In this research, respondents were asked to indicate their agreement/disagreement with each item on a five-point Likert scale ranging from 1 for “strongly disagree” to 5 for “strongly agree”. The confidence interval degree is 95%.
VIII. FINDING AND RESEARCH RESULT
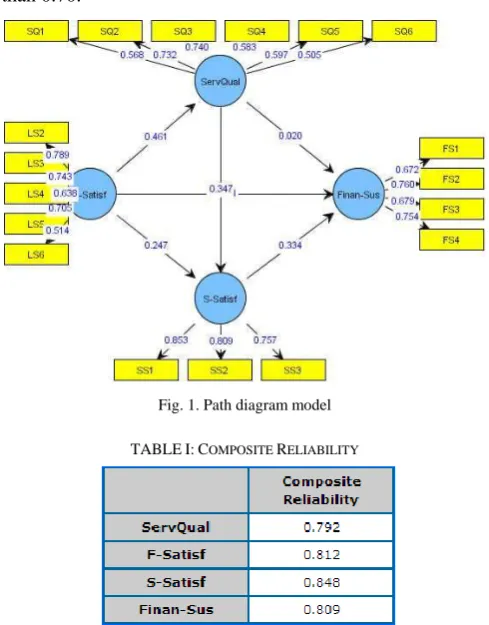
In analyzing the influence of financial performance and non-financial performance, several analysis tools are employed in PLS, such as: the outer model which comprises of convergent validity, composite reliability and also inner model. From the convergent validity, the result of the analysis shows that the validity and reliability levels are good in which all the questionnaire items have loading value above 0,5. The result of the research and the outer loading value of each variable are shown in Fig. 1 below.
The second part is the composite reliability. Composite reliability test the reliability value between blocks of indicators of constructs that shape it. Table I is the the output of composite reliability, in which the composite reliability is The theory used in connecting the service quality and
student satisfaction is the attitude theory proposed by Lazarus (1991) and Bagozzi (1992) in Yee et al.[1]. In the theory, it is stated that when an activity is assessed to have achieved the planned results, the fulfillment of the desired results achieved and followed by affective responses that will lead to satisfaction. If the quality of services assessed in accordance with what was planned it would ultimately lead to student satisfaction. Based on these studies, the third hypothesis is proposed:
H3: Service quality has a positive and significant influence on student satisfaction.
good if the value is above 0.70.Based on the output table, it is shown that the composite reliability value for faculty satisfaction variable (F-Satisf) is 0.812, for service quality (ServQual) variable is 0.792, for student satisfaction (S-Satisf) variable is 0.848, and for financial performance (Finan-Sus) is 0.809, where the four values are all greater than 0.70.
Fig. 1. Path diagram model TABLEI:COMPOSITE RELIABILITY
The next analysis is the result from the inner weight, which shows that the relationship among the variables is positive (original sample estimate). From the six kinds of relationship among the variables, it can be seen that there are two kinds of relationships which are not significant in which the t-statistic values are lower than 1,96. This applies for the relationship between ServQual and Financial Sustainability (0.118) and Faculty Satisfaction with Student Satisfaction (1.744).
TABLEII:INNER WEIGHT RESULT
IX. DISCUSSION,RECOMMENDATION AND IMPLICATIONS
One of the goals of this research on Balanced Scorecard is to look in more detail the relationship condition between the perspectives that exist in the Balanced Scorecard. Then each of these relationships will be explored into a matrix with four
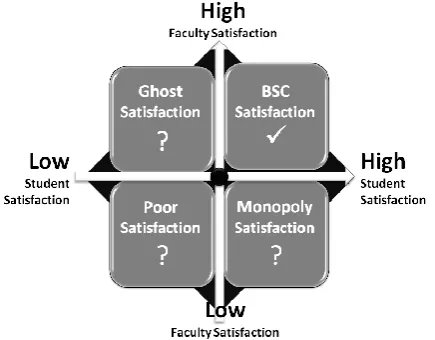
quadrants. Therefore, the six relationships that exist in the Balanced Scorecard can be made 6 matrix and 24 quadrants. However, the matrix or quadrants that we see in detail is the relationship in the Balanced Scorecard that is not proven based on hypothesis, in this case the relationship between SERVQUAL with Financial Sustainability, and Financial Sustainability with Student Satisfaction. In the case of SERVQUAL and Financial Sustainability, it can be made a matrix as in figure 2 which produces four quadrants. The quadrant we need to consider in detail is the quadrant that has a question mark "?". The ideal quadrant which corresponds to the hypothesis is "BSC Quality" quadrant, in high SERVQUAL and high Financial Sustainability results.While Monopoly Quality is low SERVQUAL, but producing high Financial Sustainability. This condition only occurs under conditions of monopoly market, where customers do not have the option to choose. While Poor Quality is the condition when the SERVQUAL is low with low Financial Sustainability as well. In this condition, the organization needs to clean up because it has a low SERVQUAL. In this research, what happens is the condition of "Ghost Quality", meaning that the organization has been building high quality with high cost and ultimately lead to reduced Financial Sustainability. In order to have a good feedback, the organization need to make further analysis regarding all those question mark “?” quadrants.
Fig. 2. Matrix servqual-financial sustainability
Fig. 3. Matrix faculty satisfaction-student satisfaction.
X. CONCLUSION
Based on the data analysis, it can be concluded that out of six hypotheses, there are two hypotheses which are not proven (H2 and H6) because the relationship is not significant eventhough it is positive. Conceptually in BSC, it is proven that the relationship among variables or perspectives are positive. However, the level of significance are proven to be not significant. The organization need to make further analysis regarding all those question mark “?” quadrants in order to explore more deeply the relationship between each of the indicator whether non-financial and the financial sustainability.
REFERENCES
[1] R. W. Yee, A. Yeung, and T. C Cheng, “The impact of employee satisfaction on quality and profitability in high-contact service industries,” Journal of Operations Management, 2008.
[2] Devie, J. Tarigan, and D. C. Widjaja, “The Relationship between Non-Financial Performance and Financial Performance Using Balanced Scorecard Framework: A Research in Cafe and Restaurant Sector,” International Journal of Innovation, Management and
Technology, vol. 3, no. 5, October 2012.
[3] D. V. Meter and H. V. Carl, “The policy implementation process: A conceptual framework,” Administration and Society, 1975.
[4] C. S. Warren, J. M. Reeve, and P. E. Fess, Accounting Principles, South-Western, 2010.
[5] J. J. Weygandt, P. D. Kimmel, and D. E. Kieso, Financial Accounting: 2010 IFRS Update, 6th Edition, International Student Version, John Wiley, 2010.
[6] S. P. Robbins, Organizational Behavior: Concept, Controversies and Applications, Prentice-Hall, 2013.
[7] K. Davis and J. Newstrom, Organizational Behavior: Human
Behaviour at Work, Mc Graw-Hill, 2001.
[8] R. E. Riggio, Introduction to Industrial and Organizational
Psychology, New York City Harper Collins Collagr Publishers, 2007.
[9] B. Cushway, Human Resource Managament, McGraw-Hill, 2006. [10] F. Luthans, Organizational Behavior, McGraw-Hill, 2005.
[11] A. Nitisemito, Manajamen Personalia, Jakarta: Ghalia Indonesia, 1992.
[12] E. L. Bets, J. E. Klingensmith, and J. W. Menne, “The measurement and analysis of college student satisfaction,” Iowa State University of Science and Technology, 1971.
[13] A. Though, “Some major reasons for learning,” ERIC Document
Reproduction Service No ED033251, 1982.
[14] C. Ostroff, “The relationship between satisfaction, attitudes, and performance: An organizational level analysis,”Journal of Applied
Psychology, vol. 77, pp. 963-974, 1992.
[15] S. A. Taylor and T. L. Baker, “An assessment of the relationship between service quality and customer satisfaction in the formation of customers‟ purchase intentions,”Journal of Marketing, vol. 58, pp. 163-178, 1994.
[16] S. P. Robbins and T. A Judge, Perilaku Organisasi,Jakarta, Salemba Empat, 2008
[17] Rusdarti, “Pengaruh kualitas pelayanan dan nilai pelayanan terhadap loyalitas nasabah pada bank BPD jawa tengah cabang semarang,”
Jurnal Bisnis Strategi, vol 13, pp. 54-65, July, 2004.
[18] Mulyadi, Alat Manajemen Kontemporer Untuk Pelipatganda Kinerja
Keuangan Perusahaan, Jakarta, Salemba Empat, 2001.
[19] L. Phillips, D. R. Chang, and R. Buzzell, “Product quality, cost, and business performance: A test of some key hypotheses,” Journal of
Marketing,Spring, vol. 47, pp. 26-43, 1983.
[20] B. Gale, “Monitoring Customer Satisfaction and Market-Perceived Quality,”Worth Repeating Series, No. 922CSO1, American Marketing Association, Chicago, 1992.
Josua Tarigan is an assistant professor in Accounting
Department, Petra Christian University. Josua also freelance business consultants in Strategic and Management Accounting. He holds Certified Management Accountant (CMA) as well as other certifications in Finance (CFP) and Sustainability Reporting (CSRS). Author became a Member of ICMA and FPSB since 2011. (email: [email protected]).
Deborah Christine Widjaja is an assistant professor in Management