ISSN (Online): 2320-9364, ISSN (Print): 2320-9356
www.ijres.org Volume 4 Issue 3 ǁ March. 2016 ǁ PP.01-07
An alternative method to evaluate Threshold Criteria in image
segmentation using ROC analysis
Sonia Nardotto
1, Giorgia D’Angelo
2 1(DITEN, University of Genova, Italy) 2
(DITEN, University of Genova, Italy)
ABSTRACT
: In this paper, a new method of automatic threshold selection for image processing is given. The process starts from a biomedical volume (CT or MRI), applies a segmentation in order to extract a region of interest (ROI) and for each threshold criterion that can be applied, a final threshold map is done. After comparing the result with the ground truth, it provides a decision of which is the best threshold criteria for analyzed volume. The results are strictly connected to the type of volume taken into account; in fact, the method is able to be adaptable and independent from application field. This method aims to start from an assessed method for binary classification, the Receiver operating characteristic (ROC) curve, used in multiple fields or applications, where it is used to graphically discriminate the performance of a classifier. In this case, it is used to decide the best threshold criteria for this particular volume or field. Along this paper, it has been demonstrated the robustness of ROC curve evaluation method in case of multiple criteria where it is necessary to discriminate the optimal one. They have been also shown some results obtained by two criteria, in particular the criterion of the first local maximum on the histogram and the criteria that uses a shape factor as the compactness.Keywords:
evaluation, medical volume, region growing, ROC, segmentation, threshold criteria.I.
INTRODUCTION
In this work it is analyzed a very common problem which consists in the threshold for a method of image processing, in this case the segmentation of a medical volume (for example MRI) using the theory of connectivity[1]. It happens very often that there is the need to extract a region within a volume of interest and many types of techniques are used to achieve this purpose.
Segmentation technique used is based on region growing [1], which allows the extraction of a region starting from an initial seed point indicated by the user. Once the region is isolated is thus formed a cost map which includes connectivity information of each single voxel with respect to the original voxel. A threshold of this new volume,will be achieved as a final volume containing only desired object.
One of the main problems of the segmentation is to choose the optimal automatic threshold criterion that comes closest to the user's manual choice by definition considered optimal. When you have multiple criteria, applicable threshold is necessary to make a decision on what the final volume gets better. To obtain this kind of result, decision may be effected by a method, which takes account of the characteristic curve that is obtained by calculating the confusion matrix from the comparison between the original volume and the reference volume. For the calculation of the matrix of confusion is taken into account for each voxel of the result obtained by the segmentation of the true value that you should get.
This comparison allows generating a 2x2 matrix containing the values of True Positive(TP) that meansvoxel correctly identified, False Positive(FP), incorrectly identified, True Negative(TN), correctly rejected, False Negative(FN), incorrectly rejected. Through the combination of these values, it is possible to obtain a series of evaluation parameters suitable to test the segmentation and thresholding.
In particular, Roc curve allows discriminating between various criteria threshold, which is optimal for that type of processing in the context of a specific anatomical district. Some works have been performed using the Roc curve,for examplein [2], where a number of metrics derived from the confusion matrix is assessed. In literature, especially in the medical field, there are not many jobs usins Roc curve to define an optimal threshold value.Someworks that use the confusion matrix, are present instead in satellitesfield [3] but with poor application to the medical field.
II.
METHOD
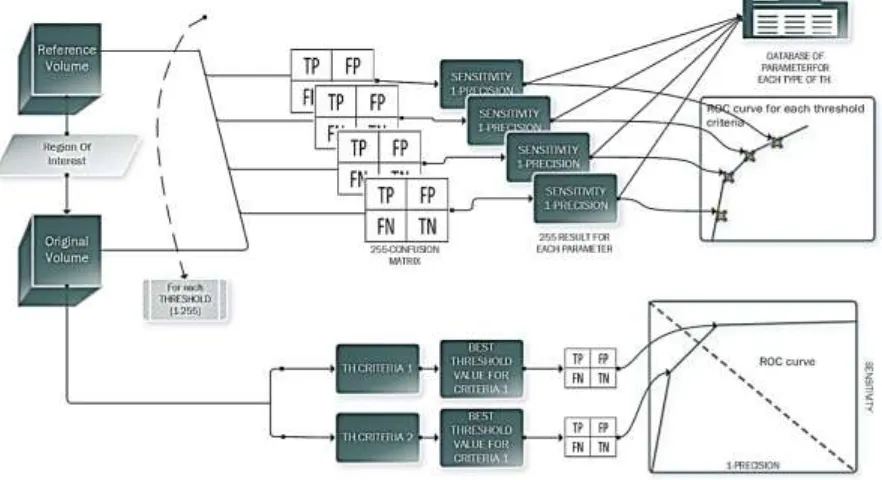
The method starts from the analysis of a volume originated where it is possible to indicate a point (voxel) which is contained into region of interest, this voxel is the seed point [1]. Then it is then generated a cost map andthe method contemplate two types of analysis, as it is show in Fig 1:
• It calculatesfor each criterion the errorbetween threshold value suggested by criterion and the best value obtained from ROC.
• It compares the threshold value given from each criterionwith the optimum threshold visible in the ROC curve, looking for the closer.
Fig. 1 Evaluation method for multiply possibility of threshold
The first step for each possible threshold value applicable to the volume compute confusion matrix with related parameters:true positive (TP), true negative (TN), false positive (FP) and false negative (FN). The confusion matrix hasbeen generated by the comparison of the automatic threshold process with manual segmentation performed by the doctor. For each confusion matrix it is possible to calculate a set of derived parameters, in this case to compute ROC curve they were chosen sensitivity (or Recall) and 1-specificity (or fallout). These parameters are fitted on a ROC curve that provides a graphic display of the above parameters. With regard to the ROC, if the points are close to the upper left, the result of the thresholding it is the optimal result. More points move away from this corner more prevails a measure that is relative to each other, thus losing final image quality. The right way is a good balance between the two measures. By analyzing the closest point to the upper-left and securing best value obtained from the ROC, it can be estimated as this value deviates from the threshold value automatically found by the software.
As regards the second study, from the cost map for each threshold criterion is calculated the automatic threshold relating to that criterion. It is calculated the confusion matrix, and its parameters related.All this results are fitted on the ROC curve.Another way to define parameters coming from confusion matrix is the following:
TPR = sensitivity = TP
TP +FN(1)
FPR = fallout = FP
FP +TN(2)
At this point on the ROC curve,there are as many points as the number of threshold criteria tested. To assess the best threshold criterion for that specific volume and for that specific bone, it is necessary to find the nearest point to the upper left corner, defined as the best threshold value from ROC method. This study should be done on a group of bones large enough and belonging to manypatients in order to evaluate which threshold criterion fits any bone. For example, for capitate bone the result is that the criterion 1 is the best and for each hamate works very well criterion 2; the method gave a satisfactoryresult.
There are many parameters that is possible to see in ROC curve that give information, one is the area under the curve (AUC). Ifusing classification proposed by Sweet[4],where value of this parameter determines if the test is more or less informative, it is possible to obtain this subdivision of AUC:
0.5<AUC< the test is inaccurate
0.7<AUC≤0.9 the test is moderately accurate;
0.9<AUC<1.0 the test is highly accurate;
AUC=1 perfect test.
As it shown in Fig 2 as a general rule[5]it can be stated that the point on the ROC curve closest to the upper left is the best compromise between sensitivity and specificity. In fact, the distance of each point of the ROC curve to the point (0, 1) is equal to:
d = (1 − Se)2+ (1 − Sp)2(3)
YoudenIndex (Y)maximizes the vertical distance between the "change line" and the generic point (x, y) of the ROC curve. In other words, the Youden index is the point on the ROC curve farthest from the diagonal obtained by maximizing the function:
[𝑆𝑒 + 𝑆𝑝 − 1](4)
To validate the proposed method were analysed two criteria threshold, the first (Fig 3) exploits the shape properties, in particular the criterion of compactness shown in (5) and described in [1]. The well-known shape-factor, C, is a simple compactness measure (adimensional) defined as:
𝐶 =𝑃2
𝐴(5)
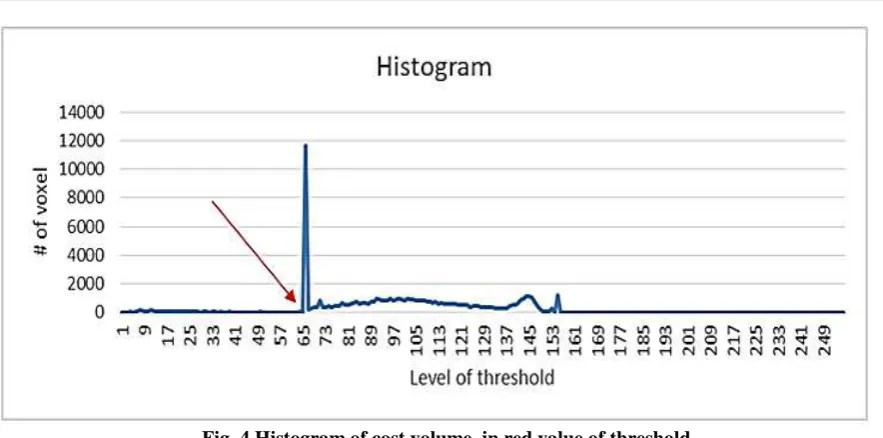
where P and A are respectively the perimeter and area of the region. For this criterion the best value of cut is exactly in the local minimum of compactness, given by (5). The second criterion (Fig 4) is the analysis of the histogram and the detection of the first significant peak corresponding to the aggregation of voxels that do not belong to the bone.
Fig. 2 ROC curve
Fig. 4 Histogram of cost volume, in red value of threshold
III.
RESULTS
The database (DB) is described in paper [6] and is made of 100 MRI T1-weighted volumes acquired by the low-field 0.2 Tesla ARTOSCAN (Esaote Spa, Genoa, Italy). Each volume is made of approximately 120 slices of size 256×256 pixels. For each bone of interest, a reference volume segmented manually by the rheumatologists is available for comparison with the automatically segmented trabecular bone.
In Fig. 5 are shown the original total volume and relative cost map obtained by the method presented in [1]; a crop for both for better viewing is done. three results after the thresholdingare also highlighted in red.
In Fig.6 it is possible to see the ROC curve where on the abscissa there is the value 1-specificity (or fallout) and on the ordinates sensitivity (or Recall). In Fig. 7 there is a detail of the ROC curve where it is possible to find the results of the three criteria. As it is shownFig.6, the majority of the points is in the quadrant at the top left and also qualitatively it may be noticed that the area under the curve (AUC) is very close to 1, in particular is 0.978360123.This definitely shows the goodness of segmentation method explained in [1].Going to analyze in detail this figure you can obtain the point corresponding to the minimum distance (d)between the corner at the top left and (x,y)value on ROC curve. This distance corresponds to the optimal threshold that is 64. Comparing this value of distance with other results obtained from tested criteria it is simpleto select and provide which is the best criteria of threshold for this specific volume.
Results of method of comparison between criteria are shown inTable 1:for compactness the threshold resultsas the best one is 52, with 0.094280586 as value of distance;for histogram threshold the best threshold given is 57, with 0.419035847 as value of distance; ROC threshold suggested is 64, with 0.062686091 as value of distance. The result of this decisional process is then that the histogram criterion is the best one for this type of bone, the pisiform, in carpus district of hand.The same result is obtainable for redundancy using YoudenIndex.
As shown in Table 2 for rejected result deriving by first criteria a volume of this size the loss of voxels on each slice is very small, due to a robust segmentation prior to thresholding.The main problem with this type of evaluation is that the doctor has operated a small classification of bone.There are some areas where the bone is edema and consequently the program does not recognize it as rightly cortical bone, but the physician considers it nonetheless still belonging to the bone. In addition, the doctor takes further cancellous bone also the entire cortical bone, that into the image is not clearly distinguishable, and then the difference between the volume automatically segmented and the segmented volume by the doctor could present the problems not due to bad automatic segmentation.
Going to analyses optimal resultrelated from the Roc curve, threshold value proposed by automatic segmentation can be seen, in the worst cases, a difference of about ten threshold values. For example, for a volume with dimension 35 x 35 x 54 (3538944 total voxels) the automatic threshold appears to be 52, while the ROC threshold is 64, with a number of lost voxels equal to 147 over the whole volume, with a 0.0041% of lost voxels. As it is possible to see in Table 2 e Fig.5, the difference between the threshold values it seems high because it goes from 52 to 64, but in qualitative and quantitative terms this is not significant.
for each possible threshold criterion available. All results are concentrated in a database of parameters for each type of threshold.
The current results are that the threshold criterion based on the compactness is the one that best suits any type of bone, although sometimes works worse that histogram criteria, due to segmentation method. We should assess the cases where the compactness criterion is wrong,whichvalue would suggest the criterion that use the histogram.
(a) (b)
(c) (d)
(g)
Fig. 1 Bone. (a) Original volume of hand district; (b) Cost values map; (c) Crop of original volume;(d) Crop of cost values map; (e) Finalthresholded volume with Compactness criteria; (f) Final thresholded volume with
Histogram criteria; (g) Final thresholded volume with ROC curve.
Fig. 6ROC curve of all compactness threshold
Fig. 7 Detail of the curve ROC, with all threshold criteria displayed
ROC COMPACTNESS HISTOGRAM
TPR 0.937426672 0.905748925 0.919827923
FPR 0.003758275 0.00235875 0.002751875
Distance (d) 0.062686091 0.094280586 0.419035847
Youden Index(Y) 0.933668397 0.903390174 0.917076048
Corresponding Threshold 64 52 57
Table 2 Results of evaluation of the “bad choice” related to the compactness threshold
IV.
CONCLUSION
This work developed and demonstrated a new method for automatic selection of the best threshold criteria applicable to a specific volume. In particular, it analysed the hand district with excellent results. This method is also independent from the type of volume and scope used. reference volume is useful only for the settling phase and decision, but in the moment in which the criterion has been chosen, the reference volume is no longer necessary.
It was exploited the approach of characteristic curve in an alternative approach to automate a decision that so far was driven by the user. They have been taken into consideration two criteria of possible threshold: criterion of the first local maximum on the histogram and the criterion that uses compactness; for each of them, have been made some observations, proving the goodness of the method. Some results have been exposed. The next steps are extending to multiple methods of threshold to be tested and several volumes of the entire database to be processed.
REFERENCES
[1] Nardotto, Sonia, et al. "Optimizing and Evaluating a Graph-Based Segmentation of MRI Wrist Bones."
New Trends in Image Analysis and Processing--ICIAP 2015 Workshops. Springer International Publishing, 2015.
[2] Taha, Abdel A., and Allan Hanbury. "Metrics for evaluating 3D medical image segmentation: analysis, selection, and tool." BMC medical imaging 15.1 (2015): 29.
[3] Wanli, Huang. "Parameters Optimization of Region growing Segmentation Based on Differential Evolution algorithm." 2015 International Conference on Advances in Mechanical Engineering and Industrial Informatics. Atlantis Press, 2015.
[4] Swets, John A. "Measuring the accuracy of diagnostic systems." Science 240.4857 (1988): 1285-1293. [5] Kumar, Rajeev, and AbhayaIndrayan. "Receiver operating characteristic (ROC) curve for medical
researchers." Indian pediatrics 48.4 (2011): 277-287.
[6] Tomatis, Veronica, et al. "A database of segmented MRI images of the wrist and the hand in patients with rheumatic diseases." New Trends in Image Analysis and Processing--ICIAP 2015 Workshops. Springer International Publishing, 2015.
Voxel lost on volume 147
Voxel lost on slice 2.722222