Public Spending and Scottish Devolution: crowding out, or crowding in?
Grant Allan*, Brian Ashcroft*+, Maria Plotnikova*+
Fraser of Allander Institute
*
and Centre for Public Policy for Regions+ University of StrathclydeWe are grateful to comments from participants at the David Hume Institute seminar “Does size matter? - An investigation of the link between post-devolution growth in public spending
and Scottish economic performance”, sponsored by the ESRC and held in Edinburgh on 10
Introduction
There has been a developing debate about the performance of the
Scottish economy under devolution and the effect of the expansion of the
public sector on Scottish growth. Several commentators have expressed
concern that the size of the public sector in Scotland is now a drag on growth,
while others take a more sanguine view. This debate is well summarised in
Marsh and Zuleeg (2006). However, this is a debate in which the evidence is
often not well marshalled and there is often more heat than light generated.
There is a suspicion that arguments about the effect and role of the public
sector often derive more from the ultimate values and political preferences of
proponents than from hard analysis and evidence.
Table 1 makes clear that public spending in Scotland has grown rapidly
under devolution. By 2007 the Scottish Executive’s Total Managed
Expenditure (TME) has grown by 46%, in real terms, on the 1999 base.
Between fiscal year 1999-00 and fiscal year 2003-04 total public spending as
a share of GDP in Scotland rose from 45% to 51% (UK 37% to 41%). The
Scottish Exec’s TME as a share of GDP rose from 20% to 25% over same
period, while the public sector job share in Scotland remained unchanged at
23% between 1999 and 2003, rising to 23.5% by 2005 (UK 19% to 20%). It is
understandable that these changes have led to fears of ‘crowding out’: the
potential negative impact of the growth of the public sector on the economic
performance of the private sector in Scotland and by implication on the growth
of the economy as a whole.
In this paper we seek to shed some light on these matters by first
considering the concept of crowding out in the context of Scotland’s political
economy. Secondly, we provide a detailed analysis of the growth performance
of the Scottish economy since devolution, which we think is revealing.
However, the analysis is largely illustrative and descriptive and does not
control for all the exogenous shocks that might have impacted on the Scottish
economy during the period. We seek to remedy this in the third part of the
version of the AMOS – A Macro-Micro Model of Scotland – computable
general equilibrium (CGE) model, which was developed by colleagues in the
Fraser of Allander Institute, in the Department of Economics at the University
of Strathclyde (Harrigan et al 1991, and Ferguson et al 2003). The final
section of the paper concludes with some pointers for further research on the
regional impacts of public spending growth.
1. The concept of crowding out and Scotland’s political economy
Crowding Out: concepts and evidence
Taylor (1979) suggests “…the term ‘crowding out’ means expansion by
the public (or administratively oriented) sector of the economy at the expense
of the private (or market oriented) sector” (p.86). Taylor distinguishes between
resource crowding out and financial crowding out. The former refers, in
Taylor’s view, to the crowding out that can occur when the economy is at or
near to full capacity. In these circumstances an increase in public expenditure
will bid up wages, prices and interest rates until the economy is back in a new
equilibrium with higher money wages and prices, unchanged real wages,
unchanged aggregate output, a lower volume of private sector output and a
bigger public sector.
In contrast, Taylor suggests that crowding out may also occur due to
the way in which public expenditure is financed even when there is
considerable spare capacity in the economy. So for example, if a fixed money
stock is maintained, interest rates will rise, crowding out private sector
investment. Conversely, if the public spending increase is financed through
increased taxation private sector spending will fall with any increase in
aggregate demand no more and possibly less than the direct fiscal stimulus
e.g. via the so-called ‘balanced budget multiplier effect’. Finally, if the theory of
‘Ricardian Equivalence’1 holds household consumption will fall and savings
1
rise as higher taxation is anticipated to finance the increase in public
spending.
One simple way of looking at the crowding out issue is to recognise
that the effect of a fiscal stimulus will depend on the position and elasticity of
the aggregate supply (AS) and aggregate demand (AD) curves relating the
aggregate price level to aggregate output in the economy in question. The
traditional, or classical, view of crowding out discussed above assumes either
of two possible situations in the face of a fiscal stimulus. First, an AS curve
with zero price elasticity (vertical) is assumed, producing complete resource
crowding out. Secondly, no change in aggregate demand occurs in the new
equilibrium because private sector demand is wholly displaced through
financial crowding out by, for example, an increase in interest rates, or
through actual or anticipated tax increases, as public spending rises.
At the other extreme there is what might be termed a Keynesian
‘fixed-price’ situation, where the AS curve is infinitely price elastic (horizontal). Here
the fiscal stimulus, in the absence of financial crowding out, generates a shift
in aggregate demand equal to the size of the direct fiscal stimulus plus the
secondary multiplier effects.
It can be argued that either assumption of a vertical or horizontal
aggregate supply curve over reasonable time horizons is too extreme. Modern
macroeconomics assumes that in the short run the AS curve will be upward
sloping for one or more of 4 reasons: nominal wage or price rigidities, or
stickiness, an explanation favoured by the so-called New Keynesians, and
worker misperceptions and producer misinformation leading to confusion
about real and nominal magnitudes. The latter two explanations are favoured
by the so-called New Classicals who take the view that demand shocks only
have real economic effects if they are unanticipated by workers and/or
producers (Mankiw, 2006)
In the long run it is assumed that either wages and prices become
flexible, or perceptions coincide with reality, with the economy adjusting to its
natural rate of unemployment and potential output, so that the AS curve
becomes vertical as in the traditional classical model. But the short run is
likely to persist for some time particularly if wage and price rigidities dominate2
and/or prices do not adjust quickly enough to clear markets. These
circumstances would appear to offer the possibility of unemployment
‘equilibria’ above the natural rate and output ‘equilibria’ below potential or full
employment output. The AS curve in a closed economy would then be upward
sloping, with a decreasing elasticity approaching zero as full employment is
reached. Madsen (1998) tests theories of aggregate supply using evidence
from the OECD countries and concluded that the short-run AS curve was
positively sloped due to sticky wages and prices. He could find no evidence in
favour of the New Classical worker or producer misperception models.
Moreover his findings indicate that it takes several years for wages and prices
to adjust to their long-run equilibrium levels.
So, it would appear that increased government spending either
generates financial crowding out or, if that does not occur, there is the
possibility of resource crowding out. However, resource crowding out, if it
occurs, will not be complete and may be minimal as both the aggregate price
level and aggregate real output increase.
At this point several caveats should be entered. First, to the extent that
crowding out of private sector activity does occur there is no way of knowing
whether the value placed by the market on the private sector activity foregone
is greater or less than the value to society of the increase in public spending
on non-market activities such as health and education provision. Moreover,
secondly, to the extent that private and public investment spending may raise
2
potential output e.g. through investments in education, R&D and
infrastructure, it is unlikely that the net impact on potential output can be
determined without a lot more information and analysis. Issues to be
addressed here would include, the balance between investment and
consumption in the public expenditure increase, and the nature of both the
specific private investments forgone and the extra public sector investments
and their respective impacts on output potential.
Thirdly, there is also an inter-temporal dimension, which concerns the
impact of increased public spending on growth. As noted above public
spending investments in education, R&D and infrastructure may not only raise
potential output but could move the economy to a higher growth path.
Conversely, additional public spending whether on consumption or investment
may through crowding out divert private sector spending and resources away
from growth enhancing activities by reducing entrepreneurship, innovation,
investment in physical and human capital and competition. This possible
effect can be termed dynamic crowding out.
It is in the context of the above second and third caveats that the
argument put forward by Kerevan (2006a) should be considered. Kerevan
argues that it is not simply the level but the composition of public spending
that is significant for crowding out. Kerevan contends that tax-financed public
spending that funds transfer payments to private households is less
distortionary than tax-financed state consumption. This is because in the
former resources are returned to the private sector, whereas in the latter
resources are diverted away from the private sector and, he contends, relative
prices are distorted. But there is no certainty that the replacement of private
consumption with state consumption necessarily produces an inferior
outcome. Is a pound spent by a household on a foreign holiday to be valued
more than a pound spent by the state on cancer treatment? However,
Kerevan’s particular worry appears to be the likely negative impact on private
sector investment flows with, presumably, attendant implications for GDP
growth. This could affect growth if private investment was affected but
would be damaged by high levels of state consumption. That does not mean
of course that such a mechanism cannot be specified, via for example a fall in
the returns to capital investment. But the increase in state consumption may
well stimulate local suppliers raising expected future returns and thereby
eventually encouraging more investment there. So, while such a harmful
outcome of state consumption on investment and growth is possible it is not
guaranteed and seems likely to depend on the particular circumstances
surrounding the resource transfer and spending. In a recent overview of
research in this area Handler et al (2005a) conclude that:
“ … the empirical literature …. is inconclusive: although the growth and composition of public expenditures and taxes as well as fiscal stance seem to have some effect in the short run, their long-run implications (on productivity and growth) cannot be easily quantified …” (page 1).
But Handler et al do note that different types or groups of public
spending should be considered separately and their study only reviews the
literature concerned with infrastructure, education, R&D and health spending.
These spending categories embrace a varying mix of consumption and
investment. But on health expenditures, which might be considered more
social than economic spending with a high current consumption element, they
conclude that
“The evidence is mostly that health expenditures have a positive, sizeable, and statistically significant effect on aggregate output. Other studies question the size of estimated effects and claim that reverse causation may prevail.” (pp 37-38).
Evidence is limited on the effect of public spending on other drivers of
growth. Handler et al (2005a) conclude that the literature suggests overall that
public expenditure on infrastructure appears to raise private sector output but
with diminishing marginal returns (p. 36-37). Education improves the stock of
human capital but there is much debate and conflicting evidence on its role in
economic growth (Easterly, 2002). Handler et al (2005a) report that on the
private sector “the majority of estimates reject the crowding-out hypothesis.”
(p. 37).
There is concern about the impact of high public spending and a large
public sector on entrepreneurial activities. Handler et al (2005a) argue that the
burden of income tax is of particular significance for the entry of new firms into
markets. However, detailed research in this area suggests that the rate of
entrepreneurial activity is affected by the tax structure rather than the rate of
any particular tax. Under certain circumstances a high personal tax rate can
encourage entrepreneurial activity3 (Cullen and Gordon, 2002; Lee and
Gordon, 2005). Others argue that existence of public sector wage premiums
(Blanchflower, 2000) – even if temporary – may attract workers from more
risky private sector activities, which could include starting new firms (Bellante
and Link, 1981). Although as Bell and Elliott (2005) point out this should imply
a private rather than a public sector wage premium. But presumably other
things are not equal and the public premium is accounted for by other factors.
Nonetheless, the risk that a public sector wage and conditions premium might
induce individuals away from new firm formation in the private sector would
appear to be real. Again the evidence is limited, and contradictory suggesting
the need for further research. Alesina et al (2001) found that the scale of
public employment discouraged market activities in the south of Italy and in
some estimations they found evidence of a negative effect on entrepreneurial
activity. In contrast, recent work involving two of the present authors (Ashcroft,
Plotnikova and Ritchie, 2007) found a positive relationship between new firm
formation in British counties during the 1990s and the share of employment in
public sector exerted together with urban agglomeration factors. A more
"singular" effect of public sector could be obtained at smaller spatial units of
analysis.
A fourth caveat is that the performance and efficiency of the public
sector and the impact of public spending on private sector economic activity
3
A marginal personal income tax rate that is above the effective tax rate on business income provides an encouragement to employment. Moreover, since tax evasion may be easier for the
may vary according to the scale of the public sector in the economy. On the
issue of scale and the performance and the efficiency of the public sector
Afonso et al (2005) in a study of OECD countries broadly find that countries
with small public sectors – public spending in year 2000 below 40% of GDP -
show better economic performance and efficiency than those with medium –
between 40% to 50% of GDP – and large - more than 50% of GDP - public
sectors. However, the literature survey of Handler et al (2005b) suggests that
“Altogether, there are conflicting results concerning the relationship between government size and its performance. The discrepancies may be partly explained by differences in the country samples, the time period covered, and in the relations investigated.”
Which leads them to conclude that
“The size of government is perhaps too broad a concept to capture a unidirectional causal relationship with government performance” (page 21).
Turning now to the relationship between the scale of the public sector,
crowding out, and the impact on productivity and growth Handler et al (2005a)
conclude from their literature survey that
“The evidence on the growth effects of government size points at a non-linear relationship: for small governments additional public expenditures have a positive impact on growth, while for large governments further additions tend to be growth retarding. It is an open question, however, where the optimum is located.” (Page 1)
This finding of an inverted U shaped relationship would appear to
have intuitive merit if smaller governments when increasing their spending
do so on necessary infrastructure investments, while larger governments
spend more on consumption and transfer payments. Some empirical
support for this is provided by evidence from the study by Afonso et al
(2005) who find that in economies with large governments incomes are on
average more evenly distributed. So, there may be trade offs between
standpoint of growth and efficiency it is not clear where the optimum is
located, although Handler et al (2005) note that empirical estimates of the
optimal size of public expenditures can be as low as 15% of GDP. They
nevertheless argue, perhaps contentiously, that this is unduly low in a
European context because of an effective path dependency reflecting a
historic power struggle between various social groups, which could not be
overturned without heavy costs. In view of this, they suggest that the
optimum is around 40%.
A fifth and final caveat affecting the likelihood and scale of crowding
out is the degree of openness of an economy to trade and factor flows.
With a fixed exchange rate and an open economy, the Mundell-Fleming
model4 implies no financial crowding out following a fiscal expansion. An
exogenous increase in domestic demand through the fiscal expansion
generates capital inflows and an endogenous increase in the money
stock. In the new equilibrium, the interest and exchange rates remain the
same while aggregate demand rises by the full amount of the fiscal
stimulus plus associated multiplier effects. This is not the case under
flexible exchange rates where the appreciation of the exchange rate as
the interest rate rises leads to a fall in export demand and a rise in import
demand, with the result that the expansion of demand may be fully
crowded out (Burda and Wyplosz, 1997). The significance of this result is
that when the focus of attention is on the regional economic implications of
fiscal stimuli then the situation is formally equivalent to the
Mundell-Fleming model of a national economy with fixed exchange rates.
Moreover, the elasticities of inward and outward flows of productive
resources, such as labour and physical capital, with respect to relative
regional wage, price and productive opportunities tend to be higher at the
regional than at the nation state scale (Harrigan et al, 1996). Following a
demand injection, through increased public spending, for example, the
increase in real wages, intermediate input prices and greater employment
and productive opportunities, will over time produce a net inflow of
4
productive resources. Aggregate supply will rise and any resource
constraints prompted by the growth in public spending will be eased.
Scottish and regional economy considerations
It follows from the above analysis, that in a small, open economy that is
part of a wider monetary and fiscal union the probability of financial crowding
out due to an own fiscal stimulus is minimal. This is exactly the situation in
Scotland, which under present constitutional arrangements shares the UK
interest rate, the UK tax structure, and the exchange rate with the rest of the
UK is fixed. In these circumstances, the money supply is endogenous, and
taxes do not in the first instance have to rise to fund the expansion because of
the subvention, via the Barnett formula and non-formula based funding, from
London. Moreover, ‘Ricardian equivalence’ issues should be avoided given
that taxes are set in London and experience suggests that Whitehall is
prepared to sustain a Scottish budget deficit, which is small in the overall
context of the UK’s public finances. In these circumstances the continuation of
the subvention to Scotland is a political not an economic issue.
The preceding discussion suggests that if Scotland is to be subject to
crowding-out effects from its own fiscal stimuli they must occur via either the
resource and/or dynamic crowding-out effects route, and more probably by
the latter than the former.
Kerevan (2006b) provides one of the few thoughtful assessments of the
potential for crowding out in the contemporary circumstances of Scotland’s
economy. He accepts the view that financial or ‘classical’ crowding out is
irrelevant to the Scottish experience because we share common interest rates
and tax rates with the UK. But he then goes on to offer an analysis of
crowding out in Scotland that is simply untenable. Scotland is portrayed as a
Third World country benefiting from windfall revenues from abroad – i.e. the
UK Treasury. In Kerevan’s view, this inflow of expenditure in excess of
revenues – up to 10% of GDP - leads to a ballooning trade deficit, relative
undermine Scotland’s long-term growth and productivity, but no clear
transmission mechanism is specified. Kerevan fails to acknowledge that in
modern open economies, if not in the Third World, markets tend to adjust both
within and between economies to ensure that resources flow in response to
price and quantity signals. And as noted above these market adjustments are
more powerful between the regions of a country. There is nothing in
economics to suggest that a sustained financial subvention from the rest of
the UK to Scotland will necessarily be damaging to Scotland’s economic
performance. While resource and dynamic crowding out effects cannot be
ruled out, they may be partial and offset by the output level and growth
promoting effects of the increased public expenditure. Ultimately the issue can
only be resolved by careful empirical, and preferably model based, analysis.
2. Scottish growth under devolution
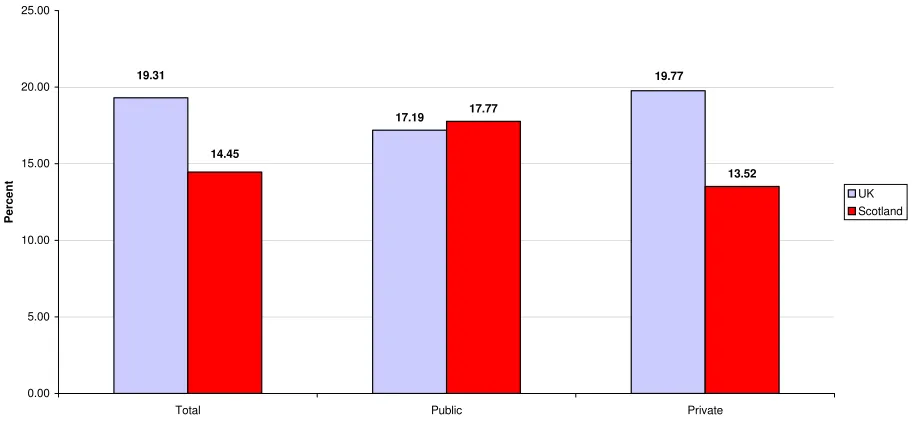
Figure 1 highlights the overall growth of GVA in Scotland and the UK between
the start of devolution – taken as 1999q2 – and 2006q1, using the Scottish
Executive’s and ONS’s published GVA data series. The Figure distinguishes
the total growth of the economy from the growth of public and private sector
over the period.5 Over the 27 quarters since the Scottish Parliament took up
its powers, the Scottish economy grew by just under 15%. The UK economy
grew faster at just over 19%. The growth of the public sector is estimated to
have been around 17% in both Scotland and the UK. Removing the growth of
the public sector form the total leaves estimated private sector growth of
under 14% in Scotland and just under 20% in the UK – a growth gap of just
over 6 percentage points in the UK’s favour.
5
Source: Scottish Executive and authors’ calculations.
Clearly, the private sector has laboured much more in Scotland during
the devolution period than its counterpart in the UK. But it is difficult to argue
that this weakness is due to the growth of the public sector in Scotland. The
public sector grew comparably in both Scotland and the UK yet private sector
growth was much weaker here. It is possible that the scale of the public sector
in Scotland, at 22% of overall GVA compared to 18% in the UK, may be
above some critical level so that comparable growth crowded out much more
private sector activity here than in the UK. But as our model-based
computable general equilibrium (CGE) analysis discussed below shows this is
probably fanciful.
We do not need to look to the growth of the public sector and the
complicated and uncertain process of ‘crowding out’ to see the most probable
reason why Scotland’s private sector growth was so much weaker during
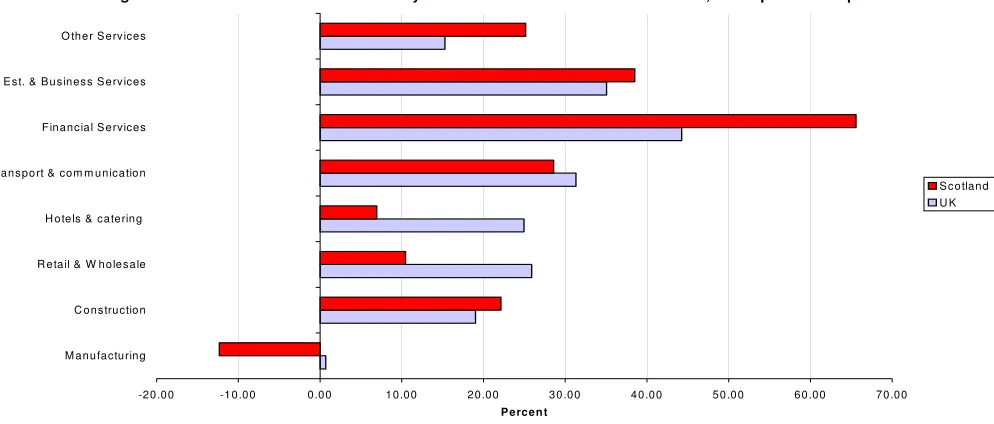
devolution. Figure 2 identifies the growth of GVA in key private sectors since
devolution. The sectors account for 97% of private sector GVA and 76% of the
economy as a whole. What is interesting in Figure 2 is that 4 sectors - other
services, real estate and business services, financial services and
construction - accounting for 47% of Scottish private sector GVA, all
[image:13.612.76.534.75.287.2]outperformed their UK counterparts, with other services and financial services
Figure 1: Scottish GVA Growth in Total and in Public and Private Sectors under Devolution - 1999q2 to 2006q1
19.77
17.19 19.31
13.52 17.77
14.45
0.00 5.00 10.00 15.00 20.00 25.00
Total Public Private
Percent
considerably outperforming them. The remaining 4 sectors all under perform
their UK counterparts. The growth of transport & communication while weaker
here was broadly similar at 29% compared to 31% growth in the UK, so it is
the weakness of the three other sectors: manufacturing, hotels & catering, and
retail & wholesale, that stands out and is worthy of further investigation.
Source: Scottish Executive and authors’ calculations.
Manufacturing GVA has fallen by more than 12% in Scotland during
devolution while UK manufacturing rose by just below 1% over the period. The
reason for this should by now be well known. It very largely reflects the
collapse of electronics production in Scotland due to the worldwide recession
in the ICT industry and related structural readjustments. The structure of
electronics in Scotland meant that the industry was hit harder by the recession
than electronics in the UK (Ashcroft, 2006). Since devolution, electronics GVA
has contracted by 34% in Scotland compared to a fall of 11% in the UK as a
whole (which itself is affected by the Scottish contraction). The fall of 34%
would have been sufficient to generate a contraction in Scottish
manufacturing, which, other things equal, would have amounted to two-thirds
of the 12% fall that actually occurred.
F ig u re 2: S co ttis h G V A G ro w th in K e y P rivate S ecto rs u n d e r D evo lu tio n , 199 9q 2 to 20 06q1
-2 0 .0 0 -1 0 .0 0 0 .0 0 1 0 .0 0 2 0 .0 0 3 0 .0 0 4 0 .0 0 5 0 .0 0 6 0 .0 0 7 0 .0 0 M a n u fa ctu rin g
C o n s tru ctio n R e ta il & W h o le s a le H o te ls & ca te rin g T ra n s p o rt & co m m u n ica tio n F in a n c ia l S e rvice s R e a l E s t. & B u s in e s s S e rv ice s O th e r S e rv ice s
P e rc e n t
[image:14.612.65.562.203.415.2]It therefore follows that a reasonable narrative is that the large decline
in electronics output over the period, with a comparable decline in
employment, led to cutbacks and postponements of the expenditure plans of
the affected households and this lowered spending in the high street affecting
retail & wholesale as well as hotels & catering compared to what otherwise
would have been the case. Over the period to 2006q1, retail & wholesale and
hotels & catering grew by 10% and 7% in Scotland compared to growth of
26% and 25% respectively in the UK. Since retail & wholesale is largely a
domestically traded sector - hotels and catering are much less so - there
seems to be no other obvious relative development in the Scottish economy
during the devolutionary period that could account for the disparity between
the sector’s performance and its UK counterpart. It could be that Scottish
households became more cautious over the period and began to save more
but that seems an unlikely explanation for the scale of the performance
differences in retail & wholesale between Scotland and the UK.
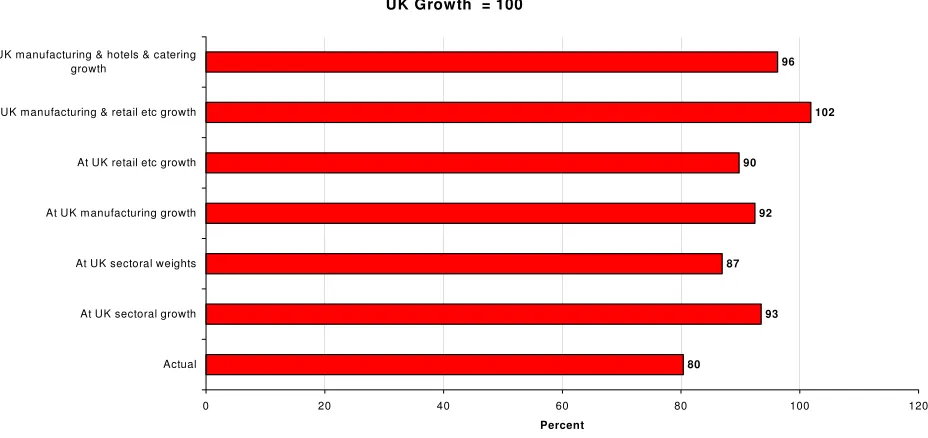
Figure 3 takes this analysis a stage further and offers the results of
several simulations using shift-share analysis where we substitute the growth
and weight of UK sectors for their Scottish counterparts. We take UK growth
over the devolution period to be 100. Given that, actual Scottish growth was
20% lower at 80. When the growth of sectors in the UK is substituted for the
growth rates of their Scottish counterparts this is sufficient to push overall
Scottish growth to 93% of UK growth. But Scottish growth is not pushed to
parity with the UK because some Scottish sectors were growing faster than
their UK counterparts and the relative importance of each sector differs across
the two countries. When the importance of each sector is held to be the same
by applying UK sectoral weights to the actual Scottish growth in each sector,
overall Scottish growth improves to 87% of the UK but not by much. This
implies that Scotland’s growth gap with the UK over the period was much less
one of a different structure of industry and much more one of different sectoral
growth rates. So, replacing the Scottish manufacturing growth rate with its
growth in the UK is sufficient in itself to push Scotland’s overall growth from
80% to 92% of the UK. Doing the same for retail and wholesale pushes
manufacturing and retail & wholesale growth rates by the growth of their UK
counterparts this is sufficient to push overall Scottish growth to 102 i.e. 2%
above actual UK growth.
Source: Scottish Executive and authors’ calculations.
What all this suggests is that in seeking to explain the significant weakness
of private sector growth in Scotland during devolution a very plausible story is
that the cause was largely due to the collapse of electronics production and
the knock-on demand, or multiplier, effects on high street spending. Nearly,
half of the Scottish private sector, embracing financial services, business
services & real estate, and other services, actually outperformed the UK
private sector during the period. But the scale of the decline of the Scottish
incidence of the world ICT recession, the decline in electronics and the
dampening effect on the growth of high street spending was more than
sufficient to outweigh the strong growth elsewhere in the Scottish service
sector. The public sector grew comparably in Scotland and the UK and there
would appear to be little justification for the view that weaker Scottish growth
since devolution relative to the UK was due to growth of the public sector and
[image:16.612.78.542.131.350.2]the rise in its share of the economy.
Figure 3: Scottish GVA Growth under Devolution 1999q2 to 2006q1 - Simulations UK Growth = 100
80
93 87
92 90
102 96
0 20 40 60 80 100 120
Actual At UK sectoral growth At UK sectoral weights At UK manufacturing growth At UK retail etc growth At UK manufacturing & retail etc growth At UK manufacturing & hotels & catering
growth
3. CGE analysis of impact of growth in public spending under devolution
The analysis in the preceding section was largely illustrative and descriptive
and does not control for all the exogenous shocks that might have impacted
on the Scottish economy during the devolutionary period. We seek to remedy
this in this part of the paper by modelling the impact directly of the growth in
public spending under devolution from 1999 to 2007 using a version of the
AMOS – A Macro-Micro Model of Scotland – computable general equilibrium
(CGE) model, which was developed by colleagues in the Fraser of Allander
Institute, in the Department of Economics at the University of Strathclyde
(Harrigan et al 1991, and Ferguson et al 2003).
The base year of the model is a Social Accounting Matrix for Scotland
in 1998, but we assume that this represents the economy in 1999 and model
the same percentage increases in government expenditure observed in
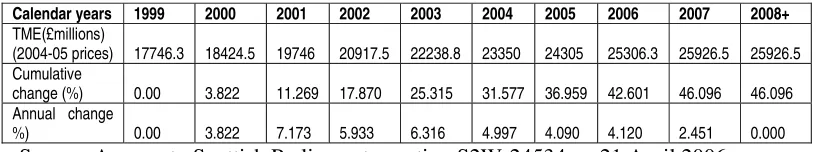
Scotland in the years since 1999. Total managed expenditure figures are
used to calculate the government expenditure percentage increases. These
are firstly annualised from financial years to calendar years, and then the
increases in government expenditure relative to 1999 are calculated. These
are given in the first two rows of Table 1. The shocks to the model are
inputted in each period, and then the model is calculated for equilibrium in that
period. The government expenditure shocks are “stepped” in, and are
assumed to remain from 2008 onwards at the level of 2007. The percentage
[image:17.612.101.510.603.679.2]shocks inputted to the model are given in the final row of Table 1.
Table 1: Annualised Total Managed Expenditure (TME) and Changes from 1999 Base
Calendar years 1999 2000 2001 2002 2003 2004 2005 2006 2007 2008+
TME(£millions)
(2004-05 prices) 17746.3 18424.5 19746 20917.5 22238.8 23350 24305 25306.3 25926.5 25926.5 Cumulative
change (%) 0.00 3.822 11.269 17.870 25.315 31.577 36.959 42.601 46.096 46.096
Annual change
%) 0.00 3.822 7.173 5.933 6.316 4.997 4.090 4.120 2.451 0.000
The Model
The model used is a variant of the AMOS model, built around a 1998
Social Accounting Matrix for Scotland. A full description of the model is given
in Ferguson et al (2003). For our purpose, it is should be noted that this is a
regional general equilibrium model parameterised on Scottish data. In this
CGE framework, there are three transactor groups – households, corporations
and governments, 25 commodities and activities (represented by 25 sectors)
and two exogenous external transactor groups (rest of the UK and rest of the
world).
Production is determined through cost minimisation with multi-level
production functions, exhibiting constant elasticity of substitution (CES)
technology at all levels of the production hierarchy, with the exception of
domestic intermediate transactions where a fixed coefficient (Leontief) form is
assumed.
Final demand consists of four components – consumption, investment,
exports and government expenditure. Consumption is a function of real
disposable income. Exports (and imports) are determined via an Armington
link (Armington, 1969)6 and are therefore relative-price sensitive with trade
substitution elasticities of 2. Nominal government expenditure is taken to be
exogenous – and the shocks involve changes to this variable.
We assume a single Scottish labour market with perfect sectoral
mobility, but, most importantly, we assume that wages are determined subject
to a bargaining function in which the real consumption wage is directly related
6
to workers’ bargaining power, and therefore inversely related to the regional
unemployment rate. The bargaining function of this wage curve is taken from
the regional econometric work of Layard et al (1991).
We run the simulations below in a multi-period setting, given our
interest in the period-by-period impacts of a series of expenditure shocks.
These periods are interpreted as years, in that we have used annual data
where we econometrically parameterise relationships, especially those that
update variables between periods. Within AMOS, in each of these periods
both the total capital stock and its sectoral composition are fixed, and
commodity markets clear continuously. However, each sector's capital stock
is updated between periods via a simple capital stock adjustment procedure,
according to which investment equals depreciation plus some fraction of the
gap between the desired and actual capital stock in each sector. This process
of capital accumulation is compatible with a simple theory of optimal firm
behaviour given the assumption of quadratic adjustment costs. Desired capital
stocks are determined on cost-minimisation criteria and actual capital stocks
reflect last period's stocks, adjusted for depreciation and gross investment.
The economy is assumed initially to be in long-run equilibrium, where desired
and actual capital stocks are equal.
Population adjusts in the central case through net migration between
Scotland and the rest of the UK, where net migration to Scotland is positively
related to the real wage differential, and negatively to the unemployment rate
differential, with the rest of the UK. It is parameterised from the
econometrically estimated model reported in Layard et al (1991). Through
sensitivity analysis we vary these elasticities of substitution making migration
less responsive to unemployment rate and real wage differentials.
The model is not a forecasting model in the sense that paths of
variables are assumed, e.g. population, GDP, oil prices, etc., rather we
assume that the economy is initially in equilibrium so that if it runs forward with
no shocks it will recreate the initial base year values. We run the model for 50
1 to 8 and then no further shocks from period 9 onwards. The simulation
results that we report here compare the simulation results to the constant
base scenario in which there are no shocks to the model. All the differences
therefore, can be attributed solely to the direct or indirect effects of the
positive demand disturbance.
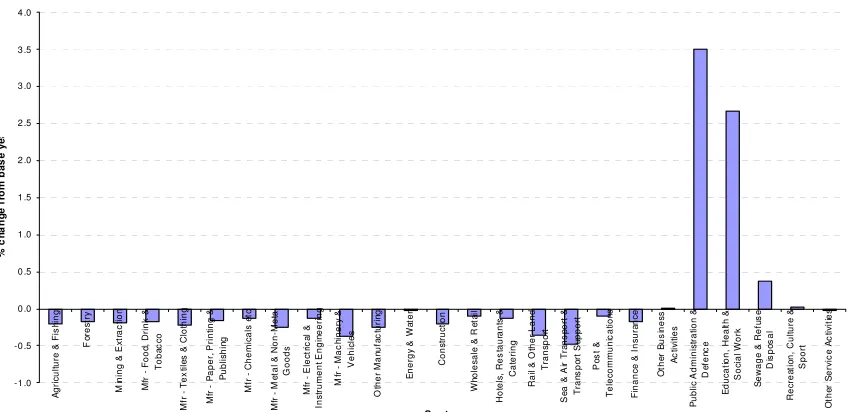
Central simulation
Initially, the increases in government expenditure raise demand for the
products of those sectors from which the government purchases directly in the
base year model. Demand increases significantly in the “public administration
and defence” and “education, health and social work” sectors. The stimulus to
demand in these sectors pushes up output prices, raising capital rental rates
and increasing output. Some crowding out of output occurs in the first period
(when sectoral capital stocks are fixed) as the expansion in demand raises
wages and the price of intermediate inputs for all sectors. Sectors with the
expenditure demand stimulus experience an increase in output, while those
not stimulated directly experience a slight fall in output in the first period
(2000) (Figure 4). At the aggregate level, the increase in wages and lowering
[image:20.612.96.523.505.711.2]of the unemployment rate leads to positive in-migration to Scotland from 2001.
Figure 4: Sectoral output in 2000, % change from 1999
-1 .0 -0 .5 0 .0 0 .5 1 .0 1 .5 2 .0 2 .5 3 .0 3 .5 4 .0 A g ri c ul tur e & F is h ing F o re s try M ini n g & E x tr ac ti on M fr F ood , D ri nk & T oba c c o M fr T ex ti le s & C lot hi ng M fr P aper , P ri nt ing & P u b lis h in g M fr C hem ic al s e tc M
fr - M
e ta l & N o n -M e ta l G oods M
fr - E
le c tr ic a l & Ins tr um ent E ngi n eer ing M fr - M a c h in e ry & V ehi c les O ther M an uf a c tur in g E ner gy & W a ter C ons tr uc ti on W h ol es a le & R e ta il H o te ls , R e s ta u ra n ts & Ca te ri n g R ai l & O ther Land T rans por t Se a & Ai r T ra n s p o rt & T ran s po rt S u ppor t Po s t & T el e c om m uni c at ion s F inanc e & I ns ur a nc e O the r B us ines s A c ti v iti e s P ubl ic A dm ini s tr at ion & De fe n c e E du c at ion, H eal th & So c ia l W o rk S ew a ge & R ef u s e Di s p o s a l R ec rea ti o n , C ul tur e & S por t O th e r S e rv ic e A c ti v it ie s
S ecto r
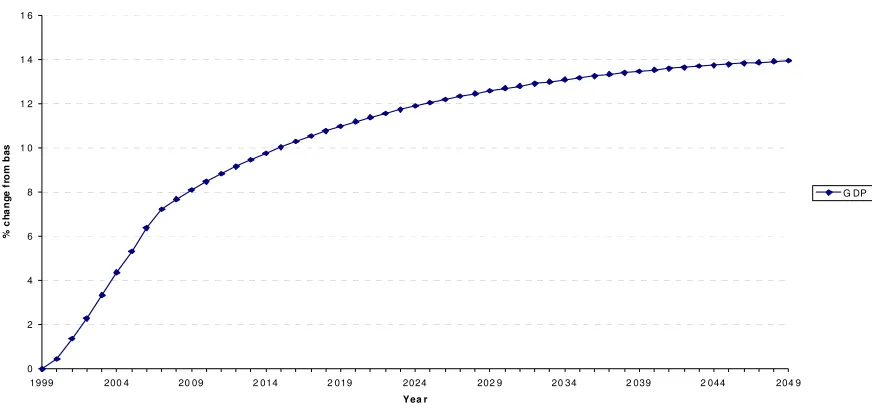
From 2007 onwards, the increases in government expenditure stop and
the economy begins adjusting to its new long-run equilibrium. By tracking the
key variables to 2049 we can see the dynamic time path of GDP,
employment, exports and imports. GDP increases significantly initially as
government expenditure increases, but then from 2007 the rate of growth of
[image:21.612.85.521.284.488.2]GDP begins to slow. By 2049, GDP is around 14% higher than in 1999
(Figure 5). Sectoral output, shown in Figure 4 in 2000, has recovered and in
[image:21.612.79.510.533.736.2]2049 the output of all sectors has increased relative to the 1999 (Figure 6).
Figure 5: GDP impact from 1999 to 2049, % changes from base
Figure 6: Sectoral output in 2049, % change from 1999
0 2 4 6 8 1 0 1 2 1 4 1 6
1999 200 4 20 09 2 014 2 019 2024 202 9 20 34 2 039 2 044 204 9
Yea r % c h a ng e f rom ba s G DP 0 5 1 0 1 5 2 0 2 5 3 0 3 5 4 0 4 5 5 0 Ag ri c u lt u re & F is h in g Fo re s tr y M in in g & E x tr a c ti o n M
fr - F
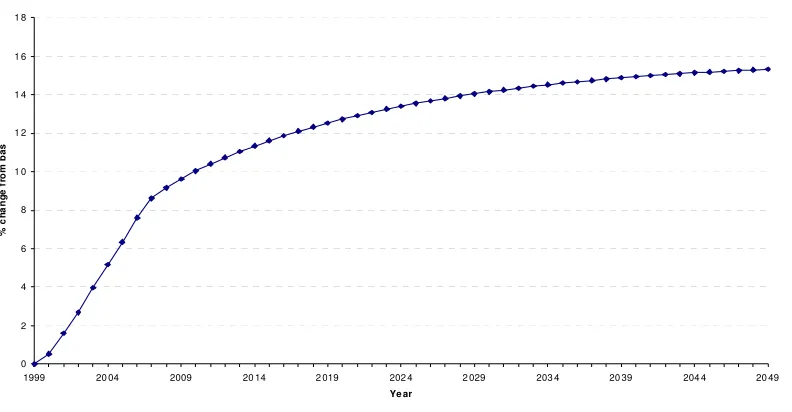
Employment also increases significantly in line with the higher real
wage encouraging both migration into Scotland, and movement of Scottish
non-workers into the labour force. The employment level by 2049 is around
[image:22.612.103.499.193.399.2]15.3% higher than in 1999 at 2.3million (Figure 7).
Figure 7: Employment from 1999 to 2049, % change from 1999
The population of Scotland also increases with positive net migration
(all population change is driven by inter-regional economic migration – we
make no assumptions about Scottish demographic profiles). Population
increases significantly from 2001 onwards, before settling on its long-run
equilibrium path movement. By 2049, the Scottish population is around
15.2% higher than in 1999 (Figure 8).
Figure 8: Population from 1999 to 2049, % change from 1999
0 2 4 6 8 1 0 1 2 1 4 1 6 1 8
1999 20 04 2009 20 14 2 019 202 4 2 029 203 4 20 39 204 4 20 49
Ye ar
% ch
an
g
e
fr
o
m
b
a
s
0 2 4 6 8 1 0 1 2 1 4 1 6
1 9 9 9 2 0 0 4 2 0 0 9 2 0 1 4 2 0 1 9 2 0 2 4 2 0 2 9 2 0 3 4 2 0 3 9 2 0 4 4 2 0 4 9
Y e a r
%
ch
an
g
e
fr
o
m
b
a
[image:22.612.111.486.575.733.2]Exports and imports to Scotland in aggregate can be tracked (Figure
9). In the first few years, the demand shock crowds out export activity in
favour of imports. Output in some sectors is affected by increased labour and
intermediate input costs, producing a loss of competitiveness and fall in GDP
in these sectors. Initially, imports to Scotland increase significantly, to around
11.1% above the 1999 value in 2007, but this falls slightly over time, and in
2049 is 10.7% higher than in 1999. Exports from Scotland fall during the first
eight years, falling by 4.7% by 2007, but by 2049, they have slowly recovered
[image:23.612.98.496.269.479.2]and are less than half a percent lower than in 1999.
Figure 9: Scottish exports and imports to Scotland, % change from 1999
The change in exports and imports can be shown broken down by
sector. In 2049, all sectors have lower export values (apart from “sewage and
refuge disposal” which shows no change) and increased imports (Figure 10).
The demand for imports in absolute terms is stimulated most in the sectors
most heavily affected by the government expenditure increase – “public
administration and defence” and “education, health and social work” where
imports increase by £447 and £637 millions respectively. The sectoral
changes in the absolute volume of exports show small reductions. The
greatest absolute fall in exports occurs in the “electrical and instrument
engineering” sector where exports fall by £23 million.
- 6.0% - 4.0% - 2.0% 0.0% 2.0% 4.0% 6.0% 8.0% 1 0.0% 1 2.0%
19 99 200 4 2009 2 014 2 019 20 24 202 9 2034 2 039 2 044 20 49
Y ear
% ch
an
g
e
fr
o
m
b
a
s
Figure 10: Absolute change in exports and imports by sector in 2049, £millions
[image:24.612.119.504.471.649.2]Table 2 summarises some of the key results of the central simulation.
Table 2: CGE analysis of Scottish Executive TME change 1999 – 2007, Central
Sensitivity analysis
Some sensitivity analysis was undertaken to check the robustness of
the central case impacts to our assumptions about key variables, namely the
speed of migration elasticities in response to unemployment and real wage
differentials. We find that the results are generally robust for small changes in
the elasticities, but less so for significant changes.
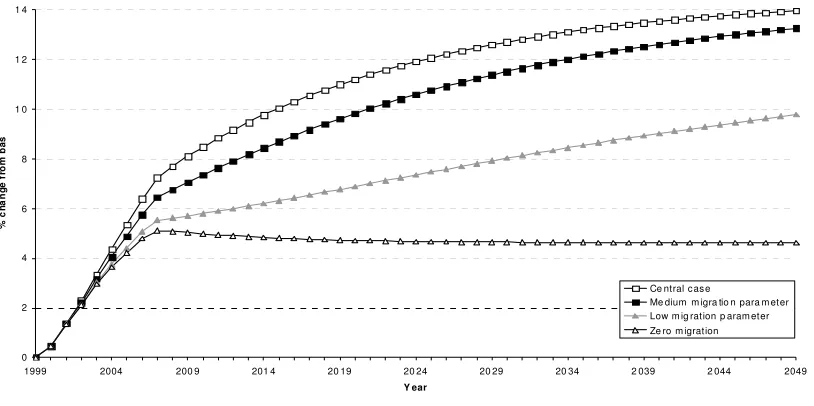
The GDP impact (Figure 11) with medium migration elasticities is
slightly lower than the central case for the fifty years from 1999 to 2049.
However, after 2012 the percentage difference between the central case and
the medium migration case is falling, with the medium migration case getting
closer to the central case results. By 2049, GDP in the medium migration
case is 13.3% higher than in 1999, only slightly below the central case
(14.0%). Both the low migration elasticity and the zero migration case reduce
the scale the GDP impact. Scottish GDP is 9.8% higher in the low migration
[image:25.612.95.502.462.665.2]elasticity case, and 4.6% higher in the zero migration case.
Figure 11: GDP impact with different migration assumptions from 1999 to 2049, %
change from base
0 2 4 6 8 1 0 1 2 1 4
1999 2004 200 9 201 4 20 19 20 24 20 29 20 34 2 039 2 044 2049
Y ear
%
ch
an
g
e
fr
o
m
b
a
s
Ce ntral c as e
The employment impacts under the different assumptions about
migration are qualitatively similar to those for GDP, with the less responsive
[image:26.612.104.508.222.422.2]cases producing a smaller impact on employment than the central case
(Figure 12). Again, the medium migration case is similar in scale to the
[image:26.612.105.505.554.734.2]central case.
Figure 12: Employment impact with different migration assumptions from1999 to 2049,
% change from base
Clearly the no-migration case will not produce any changes in
population, however by reducing the migration elasticities we see a smaller
increase in population. The Scottish population by 2049 is between 8.4% (in
the low elasticities case) and 15.2% (in the central case) higher (Figure 13).
Figure 13: Population change with different migration assumptions from 1999 to 2049,
% change from base
0 2 4 6 8 1 0 1 2 1 4 1 6
1999 20 04 2 009 201 4 20 19 2 024 202 9 20 34 2 039 204 4 2 049
Year
%
c
h
a
ng
e
f
rom
ba
s
C en tr al ca se
M ed ium m igration p aram e te r L ow m ig ration pa ram eter Z er o m ig ration
0 2 4 6 8 1 0 1 2 1 4 1 6
1 9 9 9 2 0 0 4 2 0 0 9 2 0 1 4 2 0 1 9 2 0 2 4 2 0 2 9 2 0 3 4 2 0 3 9 2 0 4 4 2 0 4 9
Y e a r
%
ch
an
g
e
fr
o
m
b
a
s
C e n t ra l c a se
Trade is an important feature in the central case. Exports declined and
then recovered to close to their initial level, while imports increased and
[image:27.612.105.511.303.512.2]remained higher than in the base year. Our sensitivity results for exports
(Figure 14) show that with migration less responsive to wage and
unemployment differences, the adjustment path is more gradual or, in the
case of zero net-migration, flattened (i.e. not showing a movement back
towards the initial level). Imports, on the other hand (Figure 15), are around
11% higher in 2007 than in 1999, and remain between 10.8% and 9.6%
[image:27.612.102.500.572.750.2]higher in 2049 when compared to 1999.
Figure 14: Scottish exports with different migration assumptions from 1999 to 2049, %
change from base
Figure 15: Imports to Scotland with different migration assumptions from 1999 to 2049,
% changes from base
-9 % -8 % -7 % -6 % -5 % -4 % -3 % -2 % -1 % 0 %
199 9 2 004 200 9 2 014 201 9 2 024 202 9 2 034 2039 20 44 2049
Year
%
ch
an
g
e f
ro
m b
a
s
Ce ntral case
Me dium migra tio n para meter Low mig ration p arameter Ze ro migratio n
0 % 2 % 4 % 6 % 8 % 1 0 % 1 2 %
1 9 9 9 2 0 0 4 2 0 0 9 2 0 1 4 2 0 1 9 2 0 2 4 2 0 2 9 2 0 3 4 2 0 3 9 2 0 4 4 2 0 4 9
%
ch
an
g
e
fr
o
m
b
a
s
C e n tr a l c a s e
4. Conclusions
In this paper we have tried to shed some light on the issue of the
hypothesised crowding out of private sector economic activity in the face of a
large and growing public sector in Scotland. Our initial discussion of the
concept of crowding out concluded that increased government spending may
either generate financial crowding out or, if that does not occur, there is the
possibility of resource crowding out. Further, dynamic crowding-out or
crowding-in effects, with the scale and growth of the public sector affecting the
drivers of growth, are also possible. Moreover, crowding out, if it occurs, need
not be complete and may be minimal as both the aggregate price level and
aggregate real output increase. And it should not be forgotten that public
spending might, through investment, have resource creating and growth
promoting effects.
Within the context of Scotland’s political economy, a small, open
economy that is part of a wider monetary and fiscal union, the probability of
financial crowding out due to an own fiscal stimulus is minimal. So, if Scotland
is subject to partial or complete crowding-out effects from its own fiscal stimuli
they must occur via either the resource and/or dynamic crowding-out effects
route, and more probably by the latter than the former. Moreover, in small,
open, regional economies such as Scotland markets tend to adjust both within
and between economies to ensure that resources, in the form of migrant
labour and physical capital, flow in response to price and quantity signals.
Following a demand injection, through increased public spending, for
example, the increase in real wages, intermediate input prices and greater
employment and productive opportunities, will over time produce a net inflow
of productive resources. Aggregate supply will rise and any resource
constraints prompted by the growth in public spending will be eased.
In view of the varying possibilities it was concluded that in any given
case, such as the recent Scottish experience, the issue can only be resolved
Two pieces of analysis were offered: an assessment of growth during
the period, and a model-based simulation of the effect of the 46% real rise in
Scottish Executive spending under devolution between 1999 and 2007.
In the first piece of analysis, output is shown to have grown by 19% in
the UK and by 14% in Scotland. Within this total, the private sector grew by
around 20% in the UK but by only 14% in Scotland, while the growth of the
public sector was much the same at around 17%. In view of this, we
concluded that it is difficult to argue that the relative weakness of the private
sector in Scotland could be attributed to the growth of the public sector. A
more plausible narrative is that the overall weak performance of the private
sector was due to the collapse of electronics production and the knock-on
effects on high street spending. Moreover, nearly half of the Scottish private
sector, embracing financial services, business services & real estate, and
other services, actually outperformed the UK private sector during the period.
Clearly, there was no obvious force dragging all of the private sector down.
The sectors underperforming were precisely those that one would expect to
be affected by the electronics collapse.
The computable general equilibrium analysis in fact suggests that the
rise in Scottish Executive spending7 during devolution is likely to have raised
GDP and employment in the Scottish economy. Resource as opposed to
financial or classical crowding out does occur in much of the private sector as
competitiveness is lowered through higher real wages and intermediate input
costs following the stimulus to demand due to the 46% real rise in Scottish
Executive spending between 1999 and 2007. But the crowding out is
insufficient to cancel out the overall boost to demand and output growth
caused by the rise in public spending. Hence, Scottish GDP rises by 7.2%
overall by 2007. Moreover, the crowding out effects on the Scottish private
sector diminish over time and eventually are removed once supply fully
adjusts. Supply adjusts as real wages increase reducing unemployment,
7
raising the activity rate and stimulating net in-migration into Scotland. The
balance of trade deteriorates as reduced competitiveness damages exports
and higher real income leads to more spending on imports. But as supply
adjusts thereby diminishing cost pressures, the trade balance improves,
although it remains worse than in 1999 because GDP and income are higher
leading to greater spending on imports. But the worsened trade balance is
sustainable because it reflects the continuing net financial subvention from
London.
Sensitivity analysis was undertaken to check the robustness of the
central case impacts to our assumptions about key variables. In view of the
importance of migration, we changed the speed of the migration elasticities to
medium, low and zero. In the no migration case, Scottish GDP and
employment still rise – for GDP to a 5% peak in 2007 - due to lower
unemployment, increased real wages and higher consumption. There is a
permanent crowding out effect on most private sectors as loss of
competitiveness is sustained, but this is not sufficient to produce a negative
GDP growth rate.
The AMOS model is a sophisticated simulation model of the Scottish
economy with a fully specified supply side, incorporating capacity constraints
and endogenous wage and price competitiveness effects. The version of the
model used is based around a social accounting matrix for Scotland for 1998,
which provides a separate set of accounts for key agents in the economy
including government, households, industries and the external sector,
identifying the income flows within and between each group. Key relations are
parameterised from estimates based on actual Scottish, or UK regional data.
However, the model does not allow for any supply creating effects of
the additional public sector spending e.g. via education spending. Nor does it
allow for changes that might produce dynamic crowding out or, indeed,
crowding in effects that concern the drivers of growth, for example, the impact
on entrepreneurship, innovation, skill formation etc. that would affect the
crowding out impact of a large and rising public sector since devolution then a
negative impact on entrepreneurship appears the most likely possibility. A
public sector wage premium consequent upon the growth in public spending,
even if temporary, may attract workers away from more risky entrepreneurial
activities such as starting new firms. But, positive effects through increased
direct and indirect demand links, particularly to local service firms, are also
possible. We are undertaking research on these matters in both Scotland and
References
Afonso, A, Schuknecht, L and Tanzi, V (2005) “Public sector efficiency: An international comparison” Public Choice, 123 pp. 321-347.
Alesina, A, Danninger, S, and Rostagno, M (2001) “Redistribution Through Public Employment: The Case of Italy” IMF Staff Papers Vol. 48, No. 3
Armington, P. (1969), "A Theory of Demand for Products Distinguished by Place of Production", IMF Staff Papers, Vol. 16, p157-178.
Ashcroft, B (2006) “Outlook and Appraisal: Reflections on the performance of Scottish electronics”, Quarterly Economic Commentary Vol. 30. No. 4, March, Fraser of Allander Institute, University of Strathclyde, Glasgow
Ashcroft, B, Plotnikova, M, and Ritchie, D (forthcoming 2007) “New Firm Formation in British Counties: Comparing the 1990s with the 1980s” Centre
for Public Policy for Regions Working Paper, Universities of Glasgow and
Strathclyde.
Barro, R (1989), “The Ricardian Approach to Budget Deficits”, Journal of
Economic Perspectives, 3: pp. 37-54.
Bell, D and Elliott, R (2005) “The Earnings Consequences of Moving Between the Private and Public Sectors in Great Britain.” Mimeo, University of Stirling.
Bellante, D and Link A. N. (1981) “Are public sector workers more risk adverse than private sector workers?” Industrial and Labor Relations Review,
34: 408 -12
Bewley, T (1999) Why Wages Don’t Fall during a Recession. Cambridge, MA: Harvard University Press.
Blanchflower, D. (2000) “Self-Employment in OECD Countries”, Labour
Economics, Vol. 7, Special Issue on Self-Employment, 471-505.
Burda, M, and Wyplosz, C (1997) Macroeconomics: a European text, Second edition, Oxford University Press
Cullen, J B and Gordon, R. H. (2002) “Taxes and Entrepreneurial Activity: Theory and Evidence for the US”, NBER Working Paper No 9015
Cumbers, A and Birch, K (2006) “Adding Value: Public Sector Spending and Scotland’s Economic Development”, UNISON Scotland, Glasgow.
Ferguson, L, Learmonth, D, McGregor, P G, Swales, JK, and Turner, K (2003), “The impact of the Barnett formula on the Scottish economy: a general equilibrium analysis”, Strathclyde Discussion Papers in Economics, No. 03-04
http://www.strath.ac.uk/media/media_34462_en.pdf
Handler, H, et al (2005a) “The impact of public budgets on overall productivity growth” WIFO, Austria , Working Papers no. 255
Handler, H et al (2005b) “The size and performance of public sector activities in Europe” WIFO, Austria , Working Papers.
Harrigan, F, McGregor, P G, Dourmashkin, H, Perman, R, Swales, J K, and
Yin Y P (1991) ‘AMOS: a macro-micro model of Scotland’ Economic
Modelling, 10, pp. 424-79.
Harrigan, F, McGregor, P G, and Swales, J K (1996) “The System-Wide Impact on the Recipient Region Of A Regional Labour Subsidy” Oxford
Economic Papers 48, pp.105-133
Kerevan, G (2006a), “Sweden holds no answers to our public sector crowding-out problem”, Scotsman, 28 June 2006.
Kerevan, G (2006b) “Devolution: A deepening economic policy failure” Ch 3 in Bill Jamieson (Ed.) Scotland’s Ten Tomorrows: The devolution crisis and how
to fix it, pp. 51-68, Continuum, London and New York
Layard, R, Nickell, S and Jackman, R (1991) Unemployment OUP, Oxford.
Lee, Y, and Gordon, R H (2005) “Tax structure and economic growth”,
Journal of Public Economics, 89 pp. 1027 – 1043.
Madsen, J B (1998) “New Keynesian Versus New Classical Theories of Aggregate Supply: Evidence from The OECD Countries” Scottish Journal of
Political Economy, Vol. 45, 3, pp. 273-293.
Mankiw, N G (2006), Macroeconomics, Worth Publishers, 6th edition.
Marsh, R and Zuleeg, F (2006) The Scottish Public Sector: Does Size Matter?
The David Hume Institute, Edinburgh
Scottish Executive (2006) Government Expenditure and Revenue in Scotland
2004 – 2005, Scottish Executive, Edinburgh.
http://www.scotland.gov.uk/Resource/Doc/159996/0043602.pdf
Taylor, C T (1979) “Crowding Out: Its Meaning and Significance” Ch. 4 in S T Cook and P M Jackson (Eds.) Current Issues in Fiscal Policy, Martin Robertson, Oxford.
Vargas, E E, Schreiner, D F, Tembo, G and Marcouiller, D W (1999)