1
Inter-Media Interaction and Effects in An Integrated Model of Political
Communication: India 2014
Francis Philip Barcla
PSG College of Arts and Science Coimbatore, Tamil Nadu, INDIA E-mail: [email protected]
Abstract
Online social media has become an integral part of the mediated-mass communication process. Hence, a
new political communication model is developed by integrating traditional mass media and mass opinion with online social media. Based on the model, a set of hypotheses is generated and tested using empirical
data gathered during the 2014 Indian parliamentary elections. In an integrated media environment, high levels of interaction (aggregate political opinion exchange) is observed to exist between mass media
(leading English newspapers published from India) and the social media (Twitter and Facebook), augmenting their effect on the masses. Social media was found to mediate the positive effect of the
English press on mass political preference. We also find evidence for a reciprocal relationship between the online social media and the masses.
Keywords: Press bias; Social media ; Reciprocal effect; Indian elections; Political preference
Introduction
Given the bulk of academic attention accorded to the online social media these times, just an inconsequential aggregate of research works explores their relationship with the traditional mass media.
Interaction between the mass media and social media and the influence that they exert on each other remain highly unexplored areas of communication research, as very few comparative studies correlate
them. As the online social media converges on the mass communication sphere, it becomes imperative to study how they act in tandem and affect mass opinions, perceptions and actions; more so, when the motif
2 It has been customary to view the masses as mere audience in traditional media research. But, thanks to the Internet-based broadcasting technologies and the widespread adoption of the online social media, that
good-old view has changed. Now, the common man can create simple messages and broadcast it to the world with ease. In a way, the online social media is a hybrid of the traditional media and the audience - where content is created by the people, broadcasted and also consumed by the people. Hitherto, the
broadcasting power was restricted to the traditional mass media and the commoners had little avenues to reach the masses with relative ease. That’s why we see traditional mass media and the online social media
as two distinct entities-segregated by the source of content. We view social media as a virtual public communication sphere—an extension of public interaction but with broader reach aided by technology.
Though an individual broadcaster on the social media may not have an audience reach as wide as that of traditional mass media, the messages have the tendency to spread, amplifying their own effect. When the
traditional mass media and online social media are two different entities, some sort of direct interaction can be observed between them that is, media messages are directly posted on the online social media in
the form of news tweets/links, while some journalists indulge in social media and take a cue from social media data and analysis. While this could be termed direct effect, there could also be indirect effect
passed on to one another by the people who use and connect with different types of communication media. For example, when some news has an effect on the people, that effect could also be felt in the
online social media. We hypothesize that increased interaction between these communication channels should create an integrated media environment, where each communication channel could influence others in the communication network. This happens more when people are exposed to and actively use
diverse communication media. In the present study, we create a communication model with a segment of traditional mass media and online social media platforms and analyse their interactions and effects on the
masses. We choose the 2014 Indian parliamentary elections, to study inter-media interactions, as it could be a period of heightened mass communication.
In a connected world, as it is today, it is essentially difficult for information and communication technologies to stand alone, survive and surge. Old media are not outdated but updated. For example,
newspapers start online editions, draw ideas from and publish social media content. New communication technologies interact with the old and each other. More often than not, they would rather collaborate and
complement instead of competing with one another. For example, social media circulate links to newspaper articles. Hong (2012) showed that newspapers’ adoption of social media marked an increase in
online readership. Social media is becoming a part of journalists’ work routines, and are used to break news, keep tabs on beats, spread the news (Messner, et al., 2011) and communicate with sources and
3 other—that is, there could be a situation of opinion exchange in political terms. Apart from this direct reciprocal relationship-as discussed earlier-there is also a presumed indirect relationship between these
two-actuated by the common users. That is, when the mass media have a positive effect on the people, the effect could be passed on to the social media, where and when the people express their opinions. In short, the people could also be mediating the effect of mass media on the online social media. People produce
and also consume social media content, and as a result, they could also exert a reciprocal effect. Before building an integrated model, past studies on individual effects of mass and social media on the masses
are reviewed.
Mass Media Effect
Media effect or influence is a widely studied area of communication research. Most of the earliest media research assumed direct effects—propelled by the magic bullet theory. Mass media were viewed as
powerful entities and the transmissional or hypodermic injection model of mass media dominated thinking during the first half of the twentieth century (Macnamara, 2003).
Research in the late 1950s and 1960s refuted the powerful claims of earlier theories and showed that media power was overestimated. It became the period of ‘limited effects’ thinking. Leon Festinger’s
cognitive dissonance theory and the uses-and-gratification perspective lent credence to this limited-effects view. Towards the end of the last century, media studies on political economy and culture reversed
thinking that mass media had limited effects, but did not return to the direct effects thinking. Theories on agenda-setting (McCombs and Shaw, 1972, and McCombs, 1977), framing (Gurevitch, et al., 1986),
priming (Blood, 1989) and agenda-building (Lang and Lang, 1983) came into being. Contemporary theories on media effects signify media impact. In the third and current stage of theoretical development, scholars seek to justify the discipline itself and demonstrate significant effects through refined theories,
better measurement tools, and improved methodological designs (Macnamara,2003). Most often than not, the literature of media effects is characterised as a three-stage progression initially embracing a theory of
strong effects followed by a repudiation of earlier work and new model of minimal effects followed by yet another repudiation and a rediscovery of strong effects. But Neuman, et al., (2011) conclude that such a characterisation was historically inaccurate and propose an ‘alternative history’ of six fundamental and
theoretically cumulative media effects models for the period 1956 -2005. In the sixth stage, Neuman, et
al., noted that there was a newly evolving theoretical tradition focusing on new technologies and interactive properties—the New Media Models, focus on human-computer interaction and
computer-mediated communication that only marginally represent mass communication. However, media effect has been reinstated in the contemporary period. In the present study, we choose the top four English
4 largest English-language newspaper readership (Hayden, 2012) and the fastest growing newspaper market (The Economist, 2011). While the newspaper industry is dwindling in the West, in Asia, especially in
India and China, it is exhibiting a positive trend (Hooke, 2012). Newspapers in India grew by 45% in paid circulation from 2000 to 2008 (All About Newspapers, 2010) due to the demand from an emerging urban and literate middle class that is enjoying higher incomes and rising standards of living (Hooke, 2012).
When the electoral strength was 814.5 million in 2014, the circulation of newspapers was over 320 million and that of English newspapers was 55.37 million. India is one of the few countries in the world
where competitive elections are conducted and newspapers are widely read. Even at this day and age, newspapers remain a primary source of political news, and shape public opinion about political figures.
Kaid and Strömbäck (2008) view modern elections as mediated events. Political parties in India use public relations and research companies to run and supervise their election campaigns more successfully
through the mass media (Dua, 1999; Karan, 2000; Sarwate, 1990). Druckman and Parkin (2005) had shown that editorial slant (or bias)—defined as the quantity and tone of a newspaper’s candidate coverage
as influenced by its editorial position—shapes candidate evaluations and vote choice. Several contemporary mass media studies have recorded positive effect on public opinion and voting behaviour
(Rhee [1997]; Kuypers [2002]; DellaVigna and Kaplan [2006]; Gerber, Karlan and Bergan [2006]; Chiang and Knight [2011] and Endersby [2011]). Barclay, et al., (2014a) attempted to predict the 2014
Parliamentary election results with the political orientations of the top four English newspapers published from India. Most media organisations in India are run by the corporate that reap rich dividends from advertising, subscriptions and sale of copyrighted material. Indian media is mostly free. Hence, we expect
mass media to have a positive effect. But is this positive effect of news bias being transferred to the online social media through the people? A review of the past studies involving Twitter and Facebook throws
some light on the civic roles of these social-networking websites.
Mass Opinion and Social Media
Social media is used for diverse purposes from chatter and social networking to critical news and information sharing, marketing, and social, ethical and political deliberations. Regardless of their content
and intended use, social media messages often convey pertinent information about the authors and their mood status. As such, tweets can be regarded as temporally-authentic microscopic instantiations of public
mood state (Bollen, et al, 2011). These researchers showed events in social, political, cultural and economic spheres do have a significant, immediate and highly specific effect on the various dimensions
of public mood, which can be deduced by analysing Twitter chats. The researchers also speculated that large-scale analyses of social media content can provide a solid platform to model collective emotive
5 insights into why particular events resonate with the population. They analysed Twitter sentiments to gauge the popularity of events among the masses. Opinions and feelings expressed on social media
platforms by diverse groups of people can be mined at low cost, and the mined attributes and contents could provide an opportunity to discover social structure characteristics, analyse action patterns qualitatively, and predict future events (Yu and Kak, 2012). Vitak, et al., (2011) observed that in the 2008
US presidential election, social network sites such as Facebook allowed users to share their political beliefs, support specific candidates and interact with others on political issues. The researchers also found
evidence that political activities on Facebook affected political participation among young voters. Political activity on Facebook was also found to be a significant predictor of other forms of political
participation. Williams and Gulati (2007) investigated the extent of Facebook profile use in 2006, and analyzed which Congressional candidates were more likely to use them, with what impact on their vote
shares. If the tendency of recent political studies inquiring into the roles that Facebook play during elections campaigns are any indication then the online social network has grown up to become an
important political and communication research tool (Small, 2008; Dalsgaard, 2008; Robertson, et al., 2009 and 2010). Sweetser and Lariscy (2008) performed a content analysis of Facebook wall comments
to inquire into the political behaviour of users. Barclay, et al., (2014, 2015 & 2015a) content analysed social media in the run-up to the 2012 US presidential elections and found a correlation between the
political trends on Twitter and Facebook and election results. Several attempts had also been made to predict the future with social media content (Asur and Huberman, 2010; Tumasjan, et al., 2010; Bollen, et al., 2011; Zhang, et al., 2011: Bandari, et al., 2012; Yu and Kak, 2012). Bermingham and Smeaton
(2011), Franch (2013) and Barclay, et al., (2014) also used Twitter and Facebook to track political sentiments. Most of them used Twitter content and all of them reported positive results. If the online
social media can be used to track political sentiments of the people, then it can also be used to estimate the effects of and the changes caused by traditional mass media. Ceron, et al., (2014) recognised the
ability of online social media to forecast electoral results and also found a correlation between social media trends and the results of traditional mass surveys. On the other hand, Gayo-Avello (2012) surveyed
a set of research articles on the subject and noted that though it is an interesting research problem, it is extremely difficult. The researcher commented that most of the authors failed to employ sound and
reproducible research methods and also that a majority of the studies lacked theoretical backing. Avello concluded that the predictive power of social media regarding elections has been exaggerated, and that
hard research problems still lie ahead. Enli and Moe (2013) also commented that social media and political communicatison were surrounded by hype. Diverse views had been expressed on the political
6 correlations between social media trends and election results, some of the others have commented that those reports are chance occurrences.
However, our argument is that if mass media affects the masses and the social media reflect public opinion, then the effect of the media bias could be transferred to the social media through the people. Note that as it was in the case of the direct relationship, this indirect relationship could also be presumed
to exist both ways. That is, while the people are affected by the mass media messages, they also exert some influence on the mass media in the form of feedback. Similarly, there could be a two-way
interaction between the people and social media—as the content is both created and consumed by the people.
Reciprocal Effect
As social media content is user-generated, it is logical to think that it reflects public mood and sentiments prevailing at a given time (Barclay, et al., 2014). That is, people’s perceptions have an effect on social
media content. To test it, the researchers associated social media popularity with election results. Twitter messages are also consumed by the users, and hence, it should also exert influence on their perceptions
and actions. Hennig-Thurau, et al. (2012) theorised that micro-blogging word of mouth (MWOM) through Twitter constitutes a new type of word-of-mouth communication that combines the real-time and personal influence of traditional (offline) word of mouth (TWOM) with electronic word of mouth’s
(EWOM) ability to reach large audiences. Several studies have also observed diverse long-term effects of
Twitter messages on the consumers (Burns and Eltham, 2009; Baran, 2011; Johnson, 2011; and Junco, et al., 2011). Hence, it is assumed that Twitter content both reflects public mood and sentiments (Bollen, et
al, 2011) and has an effect on the people. However, the reciprocal nature of online social media in their effect on the masses has not been modelled and well studied.
Why Consider Social Media?
The online social media has become an integral part of the mediated-communication process. In India, the number of Internet users by June 2014 was 243 million (registering a year-on-year growth of 28%), with
percentage of users being 19.19. Note that the population of India was estimated to be about 127 crore (1.27 billion) (IOP, 2014) and the number of eligible voters for the 2014 parliamentary election was 814.5
million. The Internet user base in the country stood at 190 million at the end of June, 2013 (PTI, 2014b). Of the estimated 243 million Indian Internet users, about 168 million were said to be using online social networks (Statista, 2014). Note that the circulation of print publications in India was around 405 million.
7 March 31, 2014, that its Indian user base had just crossed the 100-million milestone (Singh, 2014). Facebook’s phenomenal rise in India was mostly powered by smartphones. Company figures stated that
84 million of its 100 million users in India accessed the social networking site from their mobile devices. The online social media, along with the traditional print media, changed the face of the 2014 general elections. Facebook and Twitter emerged as major players in the elections, with political parties and
candidates competing with each other in breaking the news, spreading their message through these outlets in addition to those via the traditional media (PTI, 2014). On April 30-the day that 89 of India’s 543
constituencies went to the polls-696,000 election-related tweets were sent (Thane, 2014). After the 7th round of polling, there were 49 million Indian elections-related conversations on Twitter, more than
double the 20 million Indian elections-related conversations on Twitter for all of 2013. In 2009, Shashi Tharoor was the lone Indian politician to be on Twitter with 6,000 followers. This time around, there was
hardly any major political leader who does not have an account on Twitter. As of June 25, 2014, Tharoor had 2.24 million followers, the second most popular Indian politician on Twitter after Narendra Modi,
who had 4.98 million. Similarly, Modi is the second most popular politician on Facebook with over 18 million fans, with US president Barack Obama leading with over 41 million. It was observed that online
social media played a game changer in the 2014 general elections (Pansare, 2014) and impacted its outcome (Swamy, 2014). The popularity of social media was on the rise, as was the level of interaction
between traditional and new media. As the social media assumes a significant place in the political communication sphere, there is a need to build a political communication model with the social media included in it.
Alternative media or not?
Loader and Mercea (2011) asserted that early conceptions of digital democracy as a virtual public sphere or civic commons have been replaced by a new technological optimism for democratic renewal based
upon the open and collaborative networking characteristics of social media. Drawing upon evidence-based research and analysis, the researchers suggested a more cautious approach for the potential of social
media to facilitate more participative democracy while acknowledging its disruptive value for challenging traditional interests and modes of communicative power. Unwin (2012) noted that there is a strong will to
believe that the online social media are indeed making political processes more democratic, and yet the evidence was not always there to support such assertions. Unwin (2012) observed that at one extreme,
there were popular activists who sought to propagate the view that major political changes, such as those in the Middle East since 2010, was a direct result of the use of social media, and were a veritable ‘Facebook Revolution’ (Huffington Post, 2011). Critical views state that governments and large private
sector corporations use social media and the Internet as a means of surveillance and maintaining
8 information source Twitter can be simply regarded as faster news feed that covers mostly the same information as traditional news media. They compared the content of Twitter with a traditional news
medium using unsupervised topic modelling. The researchers concluded that Twitter can be a good source of certain topics that have low coverage in traditional news media, and also that Twitter users actively help spread news of important events. However, as we expect traditional mass media to have a positive
effect on the masses, we also expect a majority of the opinions that they post on online social networks to be in line with traditional mass media views instead of being an alternative media. When the mass media
has a negative effect on the masses, we can expect alternative views on social media. Social media should presumably strengthen the democratic system and values, if it turns out to be an alternative to traditional
media, creating a balance. Online social media could lend a voice to the oppressed and provide a platform to vent opinions suppressed by the mass media. At the same time, since technology is open to all, it could
also be used to reinforce dominant opinions and as a result minority views could again get suppressed. Social media could thus promote the views exhibited and highlighted by the traditional mass media
outlets. The so-called people’s media could also be manipulated by the power players to suit their purposes. It all depends on who uses it for what and with what effect. The present study, hence, intends to
estimate the relationship between traditional mass media and the online social media and their combined effect on the masses. Twitter is chosen to represent the social media bloc. Authors apply a Multiple
Indicators Multiple Causes (MIMIC) approach to investigate the reciprocal effect of media bias (English newspapers) and social media slant (Twitter) on a two-factor model of mass voting preference consisting of vote share and Facebook ‘likes’. The present one is a field study conducted in natural settings and
investigates natural phenomena using variables that naturally occur. To create variations in these variables, the top three national political parties contesting the election-Bharatiya Janata Party (BJP), the
Indian National Congress (INC or Congress) and the Aam Aadmi Party (AAP)-were chosen. Media bias, in the present study, is defined as the number of positive news items minus the count of negative news
items published on a party in the chosen four English newspapers. Social media slant is defined as the number of positive tweets minus the number of negative tweets posted on a party on Twitter. For the
newspapers, however, the visibility factor was considered. That is, based on which pages of the newspapers the news items were published weightings were allotted to them. Mass voting preference was
extracted from the popular vote share of the parties and the number of ‘likes’ recorded on the official Facebook fan pages of the chosen parties or their leaders employing factor analysis. Data was collected
on a daily-basis from January 26, 2014, till May 12, 2014, when the elections ended. Each day is considered as an individual case in this comparative study. An integrated model is developed using these
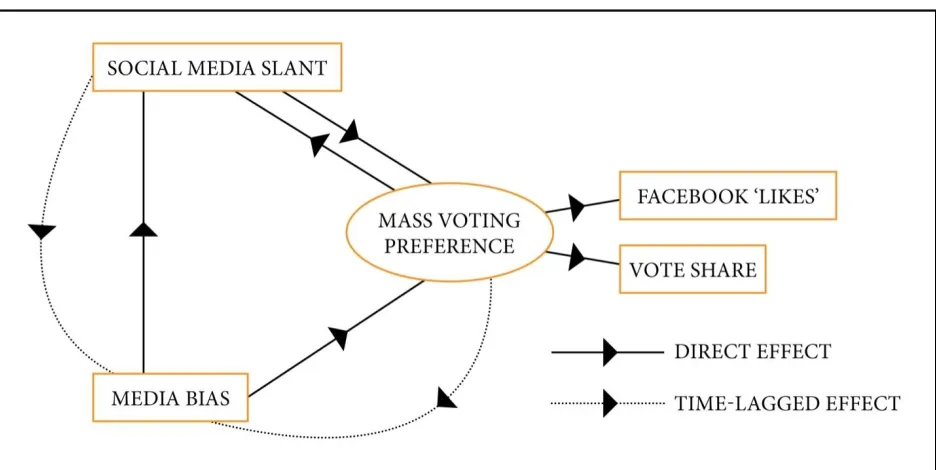
9 Figure 1: An integrated model of media interaction
In the model, the effects of the masses and social media on mass media are marked as time-lagged as the data was collected on a daily-basis and the chosen newspapers are also published on a daily-basis. Hence,
any effect that these exert on the newspapers as feedback should take at least a day. The interaction between social media and their users are assumed to be reciprocal as the creators of their content are also consumers. Hence, in an integrated media environment, the communication mediums are assumed to
directly and indirectly affect each other augmenting their effect on the masses. Based on this integrated model of media interaction, the following theoretical hypotheses are proposed:
1) Media bias, mass voting preference and social media slant are positively associated. 2) Media bias has a direct effect on mass voting preference.
3) Media bias has a direct effect on social media slant.
4) Mass voting preference mediates the positive effect of media bias
on social media slant.
5) Social media slant mediates the positive effect of media bias on mass voting preference,
augmenting the effect of media bias on voting preference of the people.
6) Mass voting preference and social media slant reciprocally affect each other.
7) Social media slant and voting preference have a
time-lagged positive effect on media bias.
10 newspapers were used. Similarly, tweets published on the parties were used to estimate the political slant of the social media. Hence, from the above-proposed theoretical hypotheses, the following research and
(corresponding) statistical hypotheses (SHs) are deduced:
1) Press Bias, Voting Preference and Twitter Slant are positively associated or (SH) more number of strategically-positioned positive news items and comparatively lesser number of strategically-positioned
negative news items on a party in the newspapers implies more votes for that party in the election, more ‘likes’ for that party on its official Facebook fan page and more positive tweets and comparatively lesser
number of negative tweets for that party on Twitter.
2) Press Bias has a direct effect on Voting Preference.
3) Press Bias has a direct effect on Twitter Slant.
4) Voting Preference mediates the positive effect of Press Bias on Twitter Slant.
5) Twitter Slant mediates the positive effect of Press Bias on Voting Preference, augmenting the effect of Press Bias on Voting Preference.
6) Voting Preference and Twitter Slant reciprocally affect each other.
7) Twitter Slant, Voting Preference have a time-lagged positive effect on Media Bias.
Research Design
In the present study, the content of newspapers and online social media are analysed using similar methods for the ease of comparison. However, there are certain differences with regard to sampling and
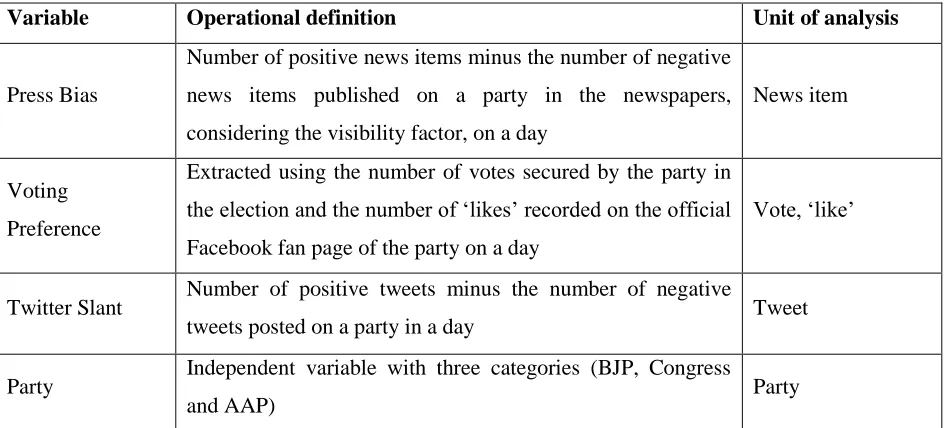
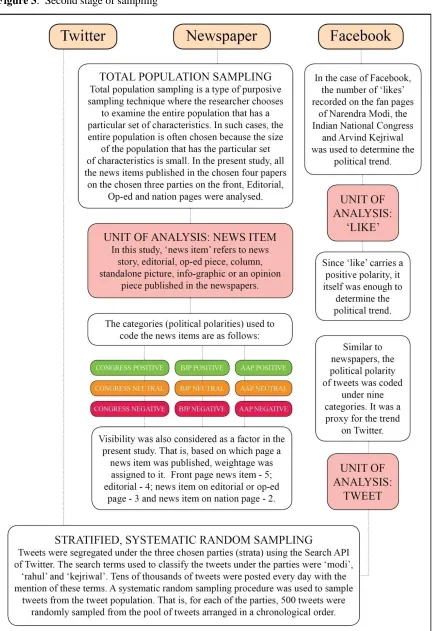
coding procedures. Table 1 explains the variables, while Figure 2 and Figure 3 explain the multi-stage sampling procedures employed in the present study.
Table 1: Details of the variables
Variable Operational definition Unit of analysis
Press Bias
Number of positive news items minus the number of negative
news items published on a party in the newspapers, considering the visibility factor, on a day
News item
Voting
Preference
Extracted using the number of votes secured by the party in the election and the number of ‘likes’ recorded on the official
Facebook fan page of the party on a day
Vote, ‘like’
Twitter Slant Number of positive tweets minus the number of negative
tweets posted on a party in a day Tweet
Party Independent variable with three categories (BJP, Congress
and AAP) Party
13
Newspapers
For the content analysis of newspapers, the top four English newspapers published from India, readership
wise, were chosen. Each of the four newspapers selected for this comparative study has multiple editions published from different states and cities. But in the case of each of the newspapers, news content was shared among its editions. One edition per newspaper was chosen to represent four capital cities located
in the four geographical parts of the country:
North India - Hindustan Times, published from New Delhi
South India - The Hindu, published from Chennai
East India - The Telegraph, published from Kolkata
West India - The Times of India, published from Mumbai
Political news items published in the chosen four newspapers were collected on a daily-basis from
January 26 till May 12, 2014- the period of study. The study period represented part of the election campaign period. It was long enough comprising 107 days and a crucial time to study the political orientation of the newspapers. In this study, ‘news item’ refers to a news story, editorial, op-ed piece,
column, standalone picture, info-graphic or an opinion piece published in the newspapers. The unit of
analysis is a news item. Of the news items published, the ones that were related to the chosen parties-the Congress, BJP and AAP-and which exhibited a political polarity were segregated. A total population
sampling procedure was applied, that is, all the news items published on the three national parties were considered for analysis. Each of the items was analysed and classified as positive, neutral or negative for a party based on its content. A common formula was applied to each of the news item in this comparative
study to mitigate any inherent bias in the data analysis. Several automated systems for sentiment analysis were considered for this content analysis, but they presented practical difficulties as most of the news
items had the mention of more than one party and presented multiple- and sometimes contradictory-views. As this study is an analysis of latent content, the researcher chose the manual approach to rate the
content and the scoring guidelines that were employed to rate the content are explained in detail in the following paragraphs.
Scoring guidelines for polarity- Nine categories were chosen for categorisation of political polarity-Congress positive, polarity-Congress negative and polarity-Congress neutral; BJP positive, BJP negative and BJP neutral;
AAP positive, AAP negative and AAP neutral. While reporting an issue or controversy, if a news item presented the view or statement of a party or the views that favour that party, then the news item was
14 In the case of multiple views, the dominant view was considered.
If a news item had the mention of a party and was found to be damaging the image of that party, it was
rated as negative. If a news item was based on the political campaign of a party, then it was classified as
positive for that party. Positive and negative statements were tracked in news reports to decide their polarity. If a news item mentions more than one party, then the party that is dominantly discussed in the
news report is considered. Though in a news item multiple parties are mentioned, only one of them is chosen to avoid duplications in calculations. In rare cases, when more than one party is dominantly
discussed and it is difficult to choose among them, polarities are attributed to all those parties. A news item that did not exhibit a perceivable political polarity was categorised as neutral. Only the news items
that exhibited a political polarity-that is, either positive or negative-were considered for further analysis of political orientation of the newspapers. From most of the news items analysed, one political polarity was
obtained. In least possible cases, neutrality was observed, and multiple polarities were attributed.
Scoring guidelines for position (visibility) - Based on the position of the news item in the paper-that is on which page it appeared- weightage was assigned to it. Front page news item - 5; editorial - 4; news item on editorial or op-ed page - 3 and news item on nation page - 2. A scale of 1-4 was not used because it
accords least importance to the nation page news items. The 2-5 scale employed in this study gives balanced weightings to the news items. The same rule was applied to all the news reports. Political items
published on the city pages of the newspapers and news items on state politics were ignored as this study focuses on the national perspective. The readership scores in million of the chosen four newspapers are The Times of India - 7.253; Hindustan Times - 4.335; The Hindu - 1.473 and The Telegraph - 0.937.
Validity and reliability- An ‘a priori’ coding scheme describing all the measures was created and the scoring guidelines were served to the coders, who were trained with samples before the study period.
Since a human coding method was employed, the meaning and content of the news items were better analysed to estimate the political bias of the chosen four newspapers. Inter-coder reliability was tested. Cohen’s κ was run to determine if there was agreement between two coders using a sample of 50 news items and the guidelines proposed. There was almost perfect agreement between the coders’ judgments, κ
= .856 (Std. error .055), p < .0005.
For the content analysis of Twitter, tweets that had the mention of the terms ‘rahul’, ‘modi’ and ‘kejriwal’
were collected on a daily-basis for 107 days from January 26 till May 12, 2014— the period of study for
Twitter. The unit of analysis is a tweet. Each of these terms was chosen to represent one of the three parties considered for this study. A stratified, systematic random sampling procedure was applied to
15 random time periods during a day. For each of the three terms, 500 tweets were collected and a sentiment analysis was performed on them to classify them as positive, negative or neutral. During the study period,
tweets with the mention of the top political candidates were posted in multiples of thousand on a daily-basis, sometimes the number of valid tweets even crossing the one-lakh mark. Since gathering and analysing the multitude of political tweets generated during the election period would require massive
storage capacity and sophisticated software leading to a steep hike in research cost, the researcher decided to rely on secondary data collected from Topsy. It provides the number of “valid” tweets generated on
specific search terms for a limited period. Using this application, the volume of tweets posted on the three terms were found out. Then using the sentiment analysis performed, the number of positive and negative
tweets posted on each of the three terms was calculated.
A common formula was applied to each of the tweets mined and analysed in this comparative study to
mitigate any inherent bias in the data analysis.
Scoring guidelines for polarity- For tweets with the mention of each of the three terms, three categories were chosen for categorisation-positive, negative and neutral. Being an analysis of latent content, the
polarity of a tweet was determined using the judgment of the expert coders, who looked for adjectives and smileys among other indicators. Human coding is both the most preferred and tricky. On the brighter side,
the coder would recognise sarcasm and context that a computer program may not. While dealing with an issue or controversy, if a tweet presented the view or statement of the candidate or the views that favour his party or the candidate, then the tweet was classified as positive for that candidate. In the case of
multiple views, the dominant view was considered. If a tweet was found to be damaging the image of that candidate, it was rated as negative. If a tweet was based on his political campaign, then it was classified
as positive for him. Positive and negative statements were tracked to decide the polarity. Even if a tweet mentions more than one candidate, it was taken under the term under which it was sourced. A tweet that
did not exhibit a perceivable political polarity was categorised as neutral. Independent variables for Twitter are the terms which represent the parties and ‘time’, while the dependent variable is the political
polarity of the tweets, which were measured in ratio points. Political trend of Twitter was tracked based on the number of positive and negative tweets posted under each of the search terms. Calculation was
done daily to track the trend over time. For the independent variable time, the unit of measurement was one day. Political trend of Twitter was calculated for the whole study period to conclude which party was
popular on Twitter and to what extent. Political trend was determined using the positivity scores that is the difference between the number of positive and negative tweets on a single term. The data were
16
Validity and reliability- To ensure internal validity, the operational measures were set to match the concepts. To measure the political trend that prevails on Twitter, that is which party was favoured on Twitter and to what extent, the unit of analysis chosen was a tweet. Both qualitative and quantitative approaches were employed to analyse latent content. The categories chosen to analyse and rate the tweet were mutually exclusive. An ‘a priori’ coding scheme describing all the measures was created and the
scoring guidelines were served to the coders, who were trained with samples before the study period.
Since a human coding method was employed, the meaning and content of the news items were better analysed to estimate the political trend. Cohen’s κ was run to determine if there was agreement between two coders using a sample of 50 tweets. There was almost perfect agreement between the two coders, κ =
.832 (Std. error .059), p < .0005. To improve inter subjectivity, the two most popular online social media platforms were chosen. Further, an ‘a priori’ design was used to boost objectivity. All decisions on
variables, their measurement, and coding rules were made before the observation began, because an
inductive approach which measures variables after they have been observed leads to major biases and invalidity. The coding principles were already set and exploratory work was done before the final coding
scheme was established for the content analysis. Besides, the coding principles were evenly applied to all the chosen three terms and the tweets sourced under them.
Scope and limitations
For the content analysis of Twitter, political tweets with the mention of the terms ‘rahul’, ‘modi’ and ‘kejriwal’ were segregated and subjected to analysis. Each of these terms represents each one of three
chosen parties. Before the actual study commenced and observations were made, a trial study was conducted to choose the terms. Various terms were tried for each of the parties like ‘congress’, ‘bjp’, ‘gandhi’, ‘narendra’, ‘arvind’ ‘advani’, ‘manmohan’ so on an so forth. The idea was to find a term for
each of the three parties chosen with the maximum number of hits. The more the number of mentions the more accurate the study will be. That way, the three terms were chosen. Other terms related to a party
could also have been taken into consideration. But since the study stretches across months, it was unviable. However, through Google Search trends, too, it was observed that the party leaders were more
popular that the parties and the chosen terms represented the parties better than others. The study period, January 26 to May 12, 2014, only represented part of the election campaign period. But it was long
enough comprising 107 days and a crucial time to study the political trend on Twitter.
17 For the content analysis of Facebook, the official verified fan pages of Narendra Modi and Arvind Kejriwal were chosen to represent their respective parties. Rahul Gandhi did not have a verified fan page
on Facebook. However, during the middle of the study, through promotional campaigns and adverts, the Indian National Congress party publicised its website and official Facebook fan page. After that, the Indian National Congress official fan page was chosen to represent the Congress party on Facebook. The number of ‘likes’ recorded on these fan pages were recorded on a daily-basis during the study
period-January 24 to May 12, 2014-109 days. The unit of analysis is a ‘like’. The number of ‘likes’ for a day was
randomly recorded at different times during the day. But the number of ‘likes’ on each of the fan pages was recorded at the same time during a day to mitigate bias and inter-subjectivity. Since a ‘like’ carries a
positive character and there was not a negative equivalent to it on Facebook, the number of ‘likes’ was only used to understand the political trend on Facebook. Independent variables are party and ‘time’, while the dependent variable is ‘like’, which were measured in ratio points. Political trend that prevailed on Facebook was deduced using the counts of ‘likes’ that were recorded on each of the chosen fan pages. It
was recorded daily to track the trend over time. For the independent variable time, the unit of measurement was one day. Political trends were calculated for the whole study period to conclude which
party was favoured and to what extent on Facebook. The political trend of Facebook was determined using the number of actual ‘likes’ and the number of new ‘likes’ recorded on the fan pages. The data were
collected and analysed using Microsoft Excel spreadsheet and a portable version of the SPSS statistics software. For the time-series analyses, linear and quadratic regression models and SPSS Expert Modeler were employed.
Validity and reliability- To ensure internal validity, the operational measures were set to match the concepts. To measure the political trend on Facebook, the unit of analysis chosen was a ‘like’. An ‘a priori’ design was used to estimate the political trend on Facebook. It is a comparative study and same
methods and guidelines are employed for all the parties chosen.
Scope and limitations
For the content analytical of Facebook, the messages posted on those fan pages could have been analysed. However, unlike tweets and news reports, the ‘like’ itself expresses a positive sentiment. Hence, analysis
of messages posted on the fan pages was not needed. The study period, January 24 to May 12, 2014, only represented part of the election campaign period. But it was long enough comprising 109 days and a crucial time to study the shift in political orientation of the newspapers during India’s longest general election. Traditionally, studies analyse Facebook posts but this study focussed on only ‘likes’ that can be
18 and unavailability of data. While for the newspapers, scoring guidelines were framed for polarity and position (visibility), only polarity guidelines were frame for Twitter, because all the tweets carry equal
weightings and the visibility factor does not play a role here. Meanwhile, for Facebook, such guidelines are not prescribed as the number of ‘likes’ recorded on the fan pages was used as a proxy to estimate the shifting political popularity of the parties on Facebook. As this data is readily available, ‘likes’ carry a
positive polarity and visibility does not play a role, the scoring guidelines for polarity and position are not framed for the social network.
Findings and Discussion
To estimate Press Bias, political news items published in the four chosen newspapers. The Times of India, Hindustan Times, The Hindu and The Telegraph-were reviewed on a daily-basis and the positive and
negative news items were segregated. Based on the news item’s position in the paper-that is, on which page it was published-each news item was assigned a weightage. For each day, the total negative score
was subtracted from the total positive score to estimate Press Bias. Further, the readership figures (in millions) were used to add weights to the chosen four English newspapers and the daily scores are plotted
in (Figure 4).
Similarly, to estimate Twitter Slant, sentiment analysis was performed on the tweets sourced using the
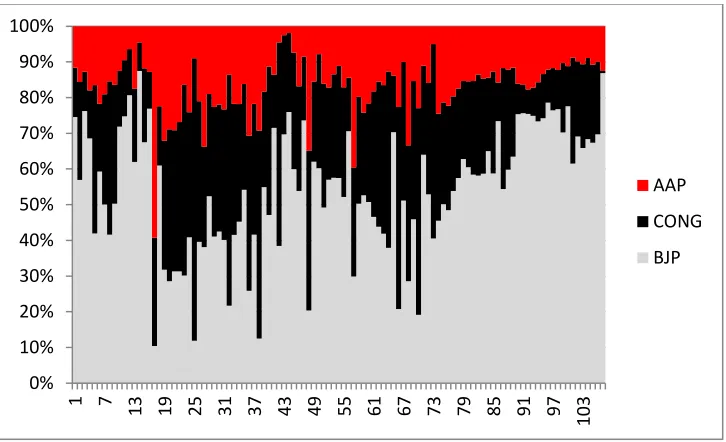
search terms chosen for the parties. The number of negative tweets posted on a day on a party was subtracted from the number of positive tweets posted on that party and the daily scores of Twitter Slant is plotted in Figure 5. For Facebook, the number of new ‘likes’ recorded on a day was deduced by subtracting the ‘likes’ count on the chosen three fan pages with the previous day’s count. The daily number of ‘likes’ recorded is plotted in Figure 6.
19 Figure 5: Daily Twitter Slant scores
Figure 6: Daily scores of Facebook ‘likes’ 0%
10% 20% 30% 40% 50% 60% 70% 80% 90% 100%
1 7 13 19 25 31 37 43 49 55 61 67 73 79 85 91 97
10
3
AAP
CONG
BJP
-80% -60% -40% -20% 0% 20% 40% 60% 80% 100%
1 7 13 19 25 31 37 43 49 55 61 67 73 79 85 91 97
10
3
AAP
CONG
20 The relation between the variables Party, Press Bias, Twitter Slant and Facebook ‘Likes’ is shown in Table 2. The mean scores are shown for the three groups of Parties.
Table 2 : Relation between the variables (mean scores)
PARTY PRESS BIAS TWITTER SLANT FB LIKES VOTES
BJP 89,758,425.2150 20,173.1021 49,316.48 171,637,684
CONGRESS 47,635,450.7168 -2,303.3775 21,720.19 106,935,311
AAP 27,116,632.0420 -5,979.7407 13,319.31 11,325,635
TOTAL 54836835.9912 3963.3279 28118.66 289,898,630
Reviewing the means table, it can be deduced that the overall Press Bias was in favour of the BJP party,
while the AAP earned the least amount of favour from the chosen four English newspapers. The same political trend was observed in the social media as well during the study period, with the BJP recording the largest average number of new ‘likes’ recorded on a day. While the average scores are positive for the
newspapers, it is mostly negative for Twitter, which means that the amount of negative tweets exceeded that of positive tweets posted on the parties on Twitter. The party that secured the most number of votes
in the 2014 general election was the BJP (171,637,684). It is also the party that secured the highest daily average number of new ‘likes’ during the study period (49,316.48). The party that had secured the least
number of votes in the election (11325635), the Aam Aadmi Party also secured the least average number 0%
10% 20% 30% 40% 50% 60% 70% 80% 90% 100%
1 7 13 19 25 31 37 43 49 55 61 67 73 79 85 91 97
10
3
AAP
CONG
21 of new ‘likes’ (13,319.31) recorded on its fan page. Note that these fan pages were of Narendra Modi and
Arvind Kejriwal used to represent their respective parties. The Indian National Congress, which had
recorded an average of 21,720.19 likes a day during the study period, went on to secure 106935311 votes in the Lok Sabha elections.
Hypothesis Testing: More number of strategically-positioned positive news items and comparatively lesser number of strategically-positioned negative news items on a party in the newspapers implies more votes for that party in the election, more ‘likes’ for that party on its official Facebook fan page and more
positive tweets and comparatively lesser number of negative tweets for that party on Twitter. To test this
hypothesis, the number of new ‘likes’ recorded over the period-January 26 to May 12, 2014-on the chosen three Facebook fan pages, the daily Press Bias scores, the popular vote share of the parties and the daily
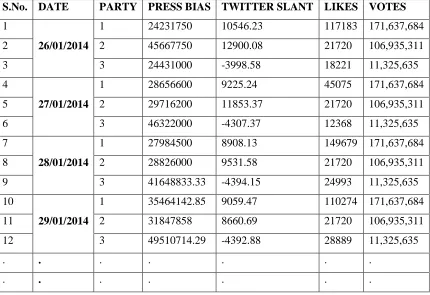
Twitter scores were used. The daily Press Bias, Twitter Slant and Likes scores that each of the parties secured are matched with their respective Vote share for the correlation analysis and presented in Table 3.
As there are just three values for votes, they are repeated for each day of data collection during the study period and correlated.
Table 3: Variables used for correlation
S.No. DATE PARTY PRESS BIAS TWITTER SLANT LIKES VOTES
1
26/01/2014
1 24231750 10546.23 117183 171,637,684
2 2 45667750 12900.08 21720 106,935,311
3 3 24431000 -3998.58 18221 11,325,635
4
27/01/2014
1 28656600 9225.24 45075 171,637,684
5 2 29716200 11853.37 21720 106,935,311
6 3 46322000 -4307.37 12368 11,325,635
7
28/01/2014
1 27984500 8908.13 149679 171,637,684
8 2 28826000 9531.58 21720 106,935,311
9 3 41648833.33 -4394.15 24993 11,325,635
10
29/01/2014
1 35464142.85 9059.47 110274 171,637,684
11 2 31847858 8660.69 21720 106,935,311
12 3 49510714.29 -4392.88 28889 11,325,635
. . . . . . .
22
. . . . . . .
316
11/05/2014
1 197895600 37284.78 40223 171,637,684
317 2 29094200 -12544.76 11766 106,935,311
318 3 13767200 -3355.53 5718 11,325,635
319
12/05/2014
1 184440000 32004.77 33440 171,637,684
320 2 19360000 -12052.38 232 106,935,311
321 3 7787500 -2933.25 4838 11,325,635
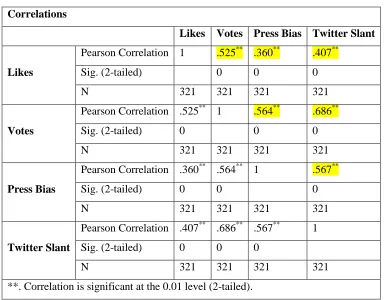
A Pearson product-moment correlation was run to determine the relationship between the variables Press
Bias, Twitter Slant, Likes and Votes and the results are presented in Table 4.
Table 4: Correlation between the variables
Correlations
Likes Votes Press Bias Twitter Slant
Likes
Pearson Correlation 1 .525** .360** .407**
Sig. (2-tailed) 0 0 0
N 321 321 321 321
Votes
Pearson Correlation .525** 1 .564** .686**
Sig. (2-tailed) 0 0 0
N 321 321 321 321
Press Bias
Pearson Correlation .360** .564** 1 .567**
Sig. (2-tailed) 0 0 0
N 321 321 321 321
Twitter Slant
Pearson Correlation .407** .686** .567** 1
Sig. (2-tailed) 0 0 0
N 321 321 321 321
**. Correlation is significant at the 0.01 level (2-tailed).
The data showed no violation of normality, linearity or homoscedasticity. There was a strong, positive
and statistically significant correlation between the Facebook Likes and Votes (r = .525, n = 321, p < .01); between Facebook Likes and Press Bias (r = .36, n = 321, p < .01); between Facebook Likes and Twitter
23 Votes and Twitter Slant (r = .686, n = 321, p < .01) and between Press Bias and Twitter Slant (r = .567, n = 321, p < .01).
Hence, the alternative hypothesis that more number of strategically-positioned positive news items and comparatively lesser number of strategically-positioned negative news items on a party in the newspapers implies more votes for that party in the election, more ‘likes’ for that party on its official Facebook fan
page and more positive tweets and comparatively lesser number of negative tweets for that party on Twitter is accepted.
Model Testing (Cross-Sectional Data Analysis)
Before moving on to panel data analysis for the identification of a model that includes reciprocal effects between Political Preference of the people and Twitter Slant, preliminary investigation is conducted with
models built using cross-sectional data. Based on the original model proposed at the beginning of this study, three models (Fig 7, 8 & 9) are constructed and tested.
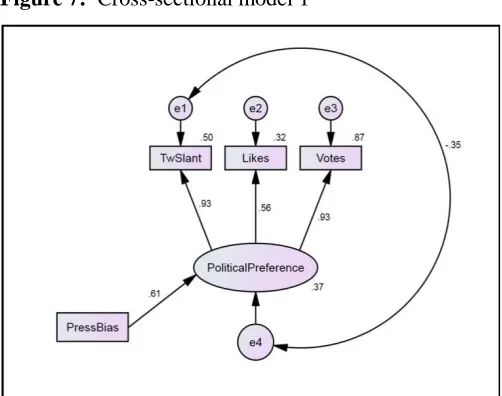
Figure 7: Cross-sectional model 1
Table 5: SEM analysis results (Default model)
Minimum was achieved Chi-square = .385
24 MODEL FIT SUMMARY
GFI AGFI PGFI TLI RMSEA
0.999 0.994 0.1 1.008 .000
COVARIANCES: (GROUP NUMBER 1 - DEFAULT MODEL)
Estimate S.E. C.R. P Label
e1 <--> e4 -176534880147.014 80732210341.599 -2.187 .029 par_3
The model was identified with an excellent fit (refer Table 5). When the variable Twitter Slant is regressed on the latent variable Political Preference, their error terms have a statistically significant
correlation. This observation indicates that these two variables affect each other reciprocally, though it is not a confirmation. To further verify the existence of a reciprocal relationship, two more models were
built and tested.
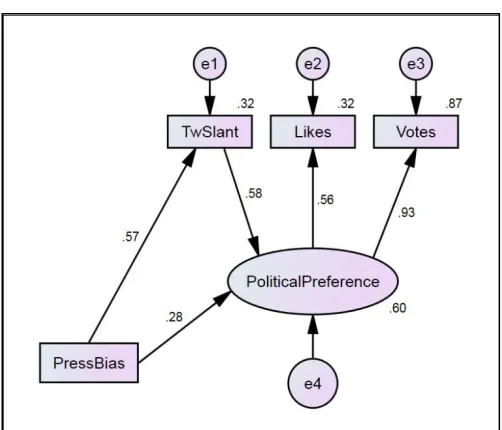
Figure 8 : Cross-sectional model 2
Table 6 : SEM analysis results (Default model) Minimum was achieved
Chi-square = .385 Degrees of freedom = 1
25 Model Fit Summary
GFI AGFI PGFI TLI RMSEA
0.999 0.994 0.1 1.008 .000
Regression Weights: (Group number 1 - Default model)
Estimate S.E. C.R. P Label
PoliticalPreference <--- PressBias .846 .069 12.314 *** par_2
Likes <--- PoliticalPreference .000 .000 9.111 *** par_1
Votes <--- PoliticalPreference 1.000
TwSlant <--- PoliticalPreference .000 .000 7.011 *** par_3
TwSlant <--- PressBias .000 .000 2.875 .004 par_4
Standardized Total Effects (Group number 1 - Default model)
PressBias PoliticalPreference
PoliticalPreference .608 .000
Votes .566 .930
Likes .343 .564
TwSlant .567 .622
Standardized Direct Effects (Group number 1 - Default model)
PressBias PoliticalPreference
PoliticalPreference .608 .000
Votes .000 .930
Likes .000 .564
TwSlant .189 .622
Standardized Indirect Effects (Group number 1 - Default model)
PressBias PoliticalPreference
PoliticalPreference .000 .000
Votes .566 .000
Likes .343 .000
TwSlant .378 .000
26 Table 6). Political Preference was observed to have a statistically significant direct effect on Twitter Slant in the model, which meant that the newspapers had a positive effect on the masses and that effect was
transferred to the micro-blogging website through the people. Considering this model, the hypothesis that Political Preference of the masses has a direct effect on Twitter Slant cannot be ruled out. Further, identification of this model supports the hypotheses that Press Bias has a direct effect on the Political
Preference of the people and on Twitter Slant. It also provides evidence to the hypothesis that Political Preference mediates the positive effect of Press Bias on Twitter Slant.
Figure 9: Cross-sectional model 3
Table 7: SEM analysis results (Default model)
Minimum was achieved Chi-square = .385
Degrees of freedom = 1
Probability level = .535
MODEL FIT SUMMARY
GFI AGFI PGFI TLI RMSEA
0.999 0.994 0.1 1.008 .000
Regression Weights: (Group number 1 - Default model)
Estimate S.E. C.R. P Label
TwSlant <--- PressBias .000 .000 12.311 *** par_3
27 Estimate S.E. C.R. P Label
PoliticalPreference <--- TwSlant 2396.749 209.554 11.437 *** par_4
Likes <--- PoliticalPreference .000 .000 9.111 *** par_1
Votes <--- PoliticalPreference 1.000
Standardized Total Effects (Group number 1 - Default model)
PressBias TwSlant PoliticalPreference
TwSlant .567 .000 .000
PoliticalPreference .608 .577 .000
Votes .566 .537 .930
Likes .343 .325 .564
Standardized Direct Effects (Group number 1 - Default model)
PressBias TwSlant PoliticalPreference
TwSlant .567 .000 .000
PoliticalPreference .281 .577 .000
Votes .000 .000 .930
Likes .000 .000 .564
Standardized Indirect Effects (Group number 1 - Default model)
PressBias TwSlant PoliticalPreference
TwSlant .000 .000 .000
PoliticalPreference .327 .000 .000
Votes .566 .537 .000
Likes .343 .325 .000
When the latent variable Political Preference is regressed on the variable Twitter Slant and Press Bias,
and Twitter Slant is regressed on Press Bias, the model was identified with an excellent fit (refer Table 7). Twitter Slant was observed to have a statistically significant direct effect on Political Preference in the
model, which meant that the newspapers had a positive effect on Twitter and that effect was transferred to the people through the micro-blogging website. Considering this model, the hypothesis that Twitter Slant
28 the people and on Twitter Slant. It also provides evidence to the hypothesis that Twitter Slant mediates the positive effect of Press Bias on the Political Preference of the people.
Model Testing (Panel Data Analysis)
To examine time-lagged effects and provide evidence for a reciprocal relationship between the Twitter
Slant and Political Preference of the people, the latter needs to be extracted.
Extraction of Mass Political Preference: A factor analysis was conducted to extract the latent variable Political Preference of the masses from the observed variables Likes and Votes and the results are
presented in Table 5. An examination of the Kaiser-Meyer-Olkin measure of sampling adequacy suggested that the sample was just factorable (KMO=.500) and Bartlett’s test of sphericity was significant (χ2 = 102.616, p < .0005).
Table 8 : Factor analysis results
Total Variance Explained
Component Initial Eigenvalues Extraction Sums of Squared Loadings Total % of Variance Cumulative % Total % of Variance Cumulative %
1 1.525 76.241 76.241 1.525 76.241 76.241
2 .475 23.759 100.000
Extraction Method: Principal Component Analysis.
The default Principal Components method without rotation was employed to extract the common factor
from Likes and Votes. Results of the factor analysis showed that a single factor contributed to 76.241% of the total variance in the two variables (refer Table 5). It had an Eigenvalue of 1.525, while the second factor had an Eigenvalue of 0.475. It shows that a single common factor had a highly significant effect on
the variables Likes and Votes. The regression values of the latent variable were saved for further analysis. Since the values of Press Bias, Twitter Slant and Political Preference are time-series, these values can be
moved up and down to form time-lagged variables. Using these time-lagged variables, models are built to test the reciprocal effect between Political Preference and Twitter Slant.
In the first model, the variables Press Bias(PBias), Political Preference (PPref) and Twitter Slant (TSlant) are regressed on the same variables with a lag period of one day (PBias1, PPref1 and TSlant1), as these
29 use of the cross-lagged correlation, Press Bias is regressed on Twitter Slant and Political Preference with a time lag of one day (PPref1 and TSlant1). Further, as per the initial model, both Political Preference of
the people (PPref) and Twitter Slant are regressed on Press Bias. Finally, a reciprocal relationship is introduced between Political Preference (PPref) and Twitter Slant (TSlant) and the model is tested. As the regression equations between PPref1 and PBias; and PBias and TSlant were found to be statistically
insignificant, they were removed to refine the model.
The test results of this model are presented in (Figure 10) and (Table 9).
Figure10: Panel model 1
Table 9: SEM analysis results (Default model) Minimum was achieved
Chi-square = 1.669 Degrees of freedom = 2 Probability level = .434
MODEL FIT SUMMARY
GFI AGFI PGFI TLI RMSEA
0.998 0.981 0.095 1.001 .000
Regression Weights: (Group number 1 - Default model)
Estimate S.E. C.R. P Label
30 Estimate S.E. C.R. P Label
PBias <--- TSlant1 208.230 63.026 3.304 *** par_11
PPref <--- PPref1 .649 .042 15.563 *** par_2
TSlant <--- TSlant1 .945 .021 45.152 *** par_3
PPref <--- PBias .000 .000 2.504 .012 par_13
TSlant <--- PPref 759.094 378.764 2.004 .045 par_7
PPref <--- TSlant .000 .000 3.470 *** par_8
Standardized Total Effects (Group number 1 - Default model)
TSlant1 PBias1 PPref1 PBias TSlant PPref
PBias .069 .911 .000 .000 .000 .000
TSlant .947 .005 .033 .005 .008 .050
PPref .159 .099 .665 .108 .161 .008
Standardized Direct Effects (Group number 1 - Default model)
TSlant1 PBias1 PPref1 PBias TSlant PPref
PBias .069 .911 .000 .000 .000 .000
TSlant .939 .000 .000 .000 .000 .050
PPref .000 .000 .659 .108 .160 .000
Standardized Indirect Effects (Group number 1 - Default model)
TSlant1 PBias1 PPref1 PBias TSlant PPref
PBias .000 .000 .000 .000 .000 .000
TSlant .008 .005 .033 .005 .008 .000
PPref .159 .099 .005 .001 .001 .008
The model was identified with an excellent fit (refer Table 9). TSlant1 was observed to have a statistically
significant direct effect on PBias in the model, which meant that Twitter trends have a time-lagged effect on the newspapers. Further, identification of this model also supports the hypotheses that Political
Preference and Twitter Slant reciprocally affect each other. The same model is tested with the same variables but with a time lag of three days (PBias3, PPref3 and TSlant3) and the test results are presented
31 Figure 11: Panel model 2
Table 10: SEM analysis results (Default model)
Minimum was achieved Chi-square = .584
Degrees of freedom = 1 Probability level = .445
MODEL FIT SUMMARY
GFI AGFI PGFI TLI RMSEA
0.999 0.987 0.048 1.004 .000
Regression Weights: (Group number 1 - Default model)
Estimate S.E. C.R. P Label
PBias <--- PBias3 .765 .036 21.209 *** par_1
PBias <--- TSlant3 399.293 115.348 3.462 *** par_11
PBias <--- PPref3 4800813.715 1656238.315 2.899 .004 par_13
PPref <--- PPref3 .652 .043 15.232 *** par_2
TSlant <--- TSlant3 .777 .041 18.762 *** par_3
TSlant <--- PBias .000 .000 2.516 .012 par_14
TSlant <--- PPref 1811.067 780.457 2.321 .020 par_7
32 Standardized Total Effects (Group number 1 - Default model)
TSlant3 PPref3 PBias3 PBias TSlant PPref
PBias .130 .108 .727 .000 .000 .000
TSlant .791 .093 .079 .108 .030 .123
PPref .194 .690 .019 .027 .253 .030
Standardized Direct Effects (Group number 1 - Default model)
TSlant3 PPref3 PBias3 PBias TSlant PPref
PBias .130 .108 .727 .000 .000 .000
TSlant .754 .000 .000 .105 .000 .119
PPref .000 .667 .000 .000 .245 .000
Standardized Indirect Effects (Group number 1 - Default model)
TSlant3 PPref3 PBias3 PBias TSlant PPref
PBias .000 .000 .000 .000 .000 .000
TSlant .037 .093 .079 .003 .030 .004
PPref .194 .023 .019 .027 .007 .030
This model was also identified with an excellent fit (refer Table 10). TSlant3 and PPref3 were observed to
have a statistically significant direct effect on PBias in the model, which meant that Twitter trends and Political Preference of the people have a time-lagged effect on the newspapers. Further, identification of
this model also supports the hypotheses that Political Preference and Twitter Slant reciprocally affect each other.
Discussion
Statistical analyses have shown that the three variables Press Bias, Political Preference and Twitter Slant share a positive relationship. Further, path analyses have provided crucial understanding about the causal
structures among these variables. As per the test results, Press Bias—that is the number of favourable minus unfavourable news items published on a party taking into account the visibility and readership factors-is found to have a positive effect on the Political Preference of the masses as predicted by Kuypers
[2002]; DellaVigna and Kaplan [2006]; Gerber, Karlan and Bergan [2006]; Chiang and Knight [2011] and Endersby [2011]. Press Bias was also found to have a positive effect on Twitter Slant-that is the
33 between news organisations and Twitter. Time-lagged analysis showed that both the changing Political Preference of the people and Twitter Slant have a time-lagged effect on the newspapers, completing the
feedback loop.
As far as the relationship between Political Preference and Twitter Slant is concerned, analysis points to the existence of a reciprocal effect. That is, the Political Preference of the people affects Twitter
Slant, which in turn affects the Political Preference of the people leading to a cyclic phenomenon. This also shows that the positive effect of the newspapers on Twitter is mediated through the people and the
press effect on the people is mediated through the micro-blogging website. As proposed earlier, such a political communication process creates an integrated media environment, augmenting the effect of the
newspapers on the people and social media. In the absence of the online social media platform, reduced amounts of effects could be observed between the press and the people. Such findings have significant
implications. These findings show that the online social media has risen to become a crucial tool of political communication affecting the political opinion of the people and mediating the effect of the press
on the people. The observed positive effect of the Political Preference of the people on Twitter shows that the latter could be used as a research tool to gain insights into public mood state, as proposed by Bollen,
et al., (2011) and Thelwall, et al., (2011). Tweets can be used to inexpensively model collective emotive trends and make predictions in India, as observed by Yu and Kak (2012). Social media was also found to
exert significant positive effects on the people. Several studies reviewed have also observed diverse long-term effects of Twitter messages on the consumers (Burns and Eltham, 2009; Baran, 2011; Johnson, 2011; and Junco, et al., 2011).Strong correlations observed between social media trends and Political
Preference of the people indicates that the former could be used to accurately predict the future political behaviour of the people such as voting (Asur and Huberman, 2010; Tumasjan, et al., 2010; Bollen, et al.,
2011; Zhang, et al., 2011: Bandari, et al., 2012; Yu and Kak, 2012). Press Bias, Political Preference of the people and Twitter Slant were found to have a positive relationship between each other. This finding
indicates that the social media was not an alternative to the traditional mass media in the Indian setting during the 2014 Parliamentary elections. It had augmented the effect of the mass media instead of
challenging it in the process of political communication. But where did it all start? Did the press go in favour of the BJP in its reportage because the people were disgruntled with the incumbent Congress
government and preferred the BJP the most? Or did the people start preferring the BJP because the Press Bias was highly in favour of the BJP? In a reciprocal model with closed loops, it is almost impossible to
understand where it all started. However, the models constructed and tested throw some light on the political communication processes underlying the variables chosen for the study.It is observed that the