R E V I E W
Open Access
foo.castr: visualising the future AI
workforce
Julio Amador Diaz Lopez
1,2, Miguel Molina-Solana
1*and Mark T. Kennedy
1,2*Correspondence: [email protected]
1Data Science Institute, Imperial College London, London, UK Full list of author information is available at the end of the article
Abstract
Organization of companies and their HR departments are becoming hugely affected by recent advancements in computational power and Artificial Intelligence, with this trend likely to dramatically rise in the next few years. This work presentsfoo.castr, a tool we are developing to visualise, communicate and facilitate the understanding of the impact of these advancements in the future of workforce. It builds upon the idea that particular tasks within job descriptions will be progressively taken by computers, forcing the shaping of human jobs. In its current version,foo.castrpresents three different scenarios to help HR departments planning potential changes and disruptions brought by the adoption of Artificial Intelligence.
Keywords: Workforce, Data visualisation, Data analytics
Background
In their widely cited paper on how susceptible jobs are to computerisation, Frey and Osborne [1] used data from the US Department of Labor’s O*NET database to predict that 47% of jobs will be at high risk of automation as technologies for computerising work continue to develop as expected (though others dramatically reduce such an impact [2]). With astute timing, World Economic Forum founder Klaus Schwab [3] argued that such computerisation would come especially from applications of artificial intelligence (AI) to cognitive work, and that they would bring social and economic change on a scale wor-thy of comparison to the industrial revolution. In short order, the social and economic impact of AI has become a frequent topic of books offering hopeful to dystopian views as seen in Life 3.0: Being Human in the Age of Artificial Intelligence[4] andWeapons of Math Destruction: How Big Data Increases Inequality and Threatens Democracy[5], respectively.
In Economics, we observe several developments that combine themselves to bring rigour and consensus to anticipating how AI will affect the relationship between capi-tal and labour. For instance, Autor et al. [6] observed a polarisation of labour markets featuring growth in lower skilled service jobs and growth in wages for highly educated and skilled workers doing so-called cognitive tasks generally requiring some tertiary education or equivalent training.
Beaudry et al. [7], more recently, observed a decline in demand for cognitive tasks that began in 2001 and intensified after the Great Recession of 2008; notably, this finding
reverses a long history of increasing demand for cognitive tasks and a positive relationship between new technologies and both average wages and productivity [8]. As a side point, Beaudry et al. [7] also observed increased inequality, a trend they link to polarised labour markets and declining demand for cognitive tasks; similarly, Acemoglu and Restropo [9] suggest the rapid spread of physical robots for manufacturing could lead to increased inequality.
In fact, both scholarly and practitioner analyses of automation’s effects on demand for labour are shifting in level of analysis from jobs to the set of tasks that make up jobs. For example, Acemoglu and Autor [9] focused on tasks and task replacing technologies rather than skills associated with low or high skilled jobs, effectively shifting focus from the familiar robots-for-jobs substitution scenario to a tools-for-tasks substitution in which tasks become targets for tool development. Similarly, in operations consulting, we find a call for focusing on “activities that can be automated rather than entire occupations” [10]. Following such an approach, consultants atAlphaBetapredicted that AI’s impact on jobs will be far gentler than the Frey and Osborne projection.
Following this shift to analyse tools-for-tasks substitution instead of robots-for-jobs, this manuscript presents an approach to forecasting AI’s impact on labour that pro-ceeds from organisational data rather than from a national survey asking jobholders what they do —as is the case with the O*NET data from the US Department of Labor. Whereas a national survey lends itself to gross predictions of future employment, our view is that such predictions will benefit from analytical case studies of different kinds of organisations. Therefore, our approach uses a comprehensive HR data set for a subset of employees of a large bank (more than 50k employees in total).
As we will explain below, the dataset includes the structure of the organisation, head-count by job, and the tasks associated with jobs as detailed in job descriptions. We argue that working from organisation data offers two significant benefits compared to using data from a national survey of jobholders. First, for the focal organisation, future demand for labour is forecast not from what is typical for all companies, but from the organisa-tion’s own data about how tasks map to jobs. Second, focusing on a subset of a single organisation allows us to validate our mapping of tasks to jobs with company staff who know the jobs and tasks well.
To present our approach, we briefly review the literature and developments that inform our tools-for-tasks approach to forecasting the likely impact of AI on cognitive work. Next, we explain the build-up of our model from data collection to pre-processing and to modelling. Finally, we describe foo.castrand show some generated visualisations to convey model results and engage stakeholders seeking to anticipate the likely impact of AI on cognitive work.
Innovation and the future of organisations
automation is incremental to the extent that it reproduces existing routines, but it is rad-ical to the extent that it cuts the demand for human labour to levels that eventually force organisational restructuring.
The incremental and radical aspects of AI-based automation underlie the tools-for-tasks and robots-for-jobs versus approaches, as mentioned above, to forecasting the future size and shape of organisations. Although we take the tools-for-tasks approach because it provides direct and rigorous guidance to specific organisations seeking to fore-cast the size and shape of their future workforces, we believe the economic effects of AI-based automation will eventually be radical as software-based robots with declin-ing marginal costs [12] and increasdeclin-ing returns to investment in developdeclin-ing AI-based alternatives to human labour [13].
For an example that briefly explains what we mean by tools-for-tasks versus robots-for-jobs, consider the co-evolution of personal computers, office automation software, and reductions in demand for administrative and middle management work. The spread of word processors, email and networked calendars have cut and changed the work of administrative assistants (formerly mostly called secretaries), and spreadsheets and databases cut and changed the work of reporting and analy-sis done by office workers formerly referred to as middle managers. As these tech-nologies developed to create opportunities for business process outsourcing, they changed organisations radically, but not so much by introducing robots that eliminated whole jobs.
To explain how this logic underlies our model, we briefly describe the tools and tasks of our tools-for-tasks approach to modelling and visualising the likely effects of AI on an organisation’s workforce.
Tools
In recent years, research breakthroughs have unleashed a cascade of complementary tech-nologies now propelling commercialisation of new techtech-nologies in three broad areas: (1) so-called “big data” technologies enabled by larger storage, faster networks, and new database architectures capable of organising and accessing both structured and unstruc-tured data; (2) so-called “business analytics” capable of automating real-time operational decisions in areas such as advertising planning, pricing, and supply chain management; and (3) “decision making”, meaning AI for replicating human decisions on classification tasks or for helping humans cutting high-dimensional problem spaces down to patterns they can interpret and use in decisions.
To map these technologies to features of tasks, we use the following four categories as a simplifying framework of these technologies:
• Data Wrangling (DW):Technologies for curating, collecting, cleaning, storing, and serving data for reporting and analysis. Examples include developing a dataset useful for understanding customers, modelling a supply chain, or supporting the
management of a complex process.
• Supervised Learning (SL):Technologies that apply machine learning and deep learning techniques to replicate or support decisions featuring classification tasks. Examples of classification include ‘decisions’ such as whether to approve a loan, whether a biopsied tissue is benign or malignant, how to translate natural language, or what to reply in a conversation.
• Unsupervised Learning (USL):Technologies that assist humans in creative or adductive inferences that reduce data to patterns that are interpretable and actionable for purposes such as opportunity identification or risk mitigation. Examples include segmenting customers to aid risk mitigation or opportunity identification; spotting patterns associated with risks such as financial crimes; and suggesting product designs based on feature sets that customers are already combining in relatively inconvenient ways.
Tasks
To forecast how these technologies will affect the future size and shape of an organisa-tion’s workforce, we need task-level data on the work performed in different jobs. Ideally, the tools-for-task approach calls for data that is generally available from organisations so we can aggregate forecasts to build more general estimates of economic impact. In practice, this means seeking data that offers not only comprehensive coverage of all an organisation’s jobs, but also fine-grained detail about the tasks associated with each job.
After considering various approaches to managing the trade-offs between comprehen-sive coverage of jobs and intencomprehen-sive task detail for each job, we chose to base our analyses on a data set comprising HR data on jobs and employees and the text of job descriptions; we call thisHRJD(Human Resources Job Description) data. Although job descriptions vary in the extent to which they provide up-to-date and detailed information on key tasks, attrition and the practical demands of hiring combine to keepHRJDdata comprehensive and up to date.
Additionally, substantially all medium- and large-sized organisations keep HR databases and job descriptions; hence, usingHRJDholds the promise of collecting a library of organ-isational datasets that could be used, in time, to develop estimates of economy-wide wide effects of automation that are based on fine-grained data and analysis.
Modelling impact of automation in workforce
In our current study, we feed our model with data from a real global bank. This section then begins by describing our data source. Then, we turn to out-line the steps taken to produce the initial state matrix needed to feed the model. Finally, we describe the algorithm used to produce displacement of jobs due to automation through time and the technologies used to visualise such changes.
Data collection
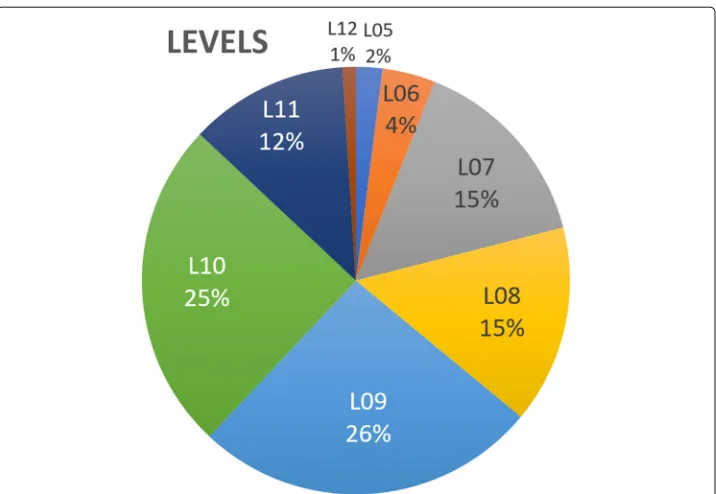
For our research, we used data from a global banking firm kindly made available by our industrial partners atImperial Business Analytics. The data, in CSV format and stored at Imperial Business Analytics data warehouse, contained information about 17,205 jobs for 55,482 employees within the bank. From the data we could obtain several other pieces of information: job title associated to a textual description of tasks and the hours that the employee should dedicate to them, the position and hierarchical level of such a job within the organisation, and the department that job belongs to (e.g. Human Resources or Capital Markets). In total, we identified 348 different jobs within 10 departments and 8 different positions or levels. The following graphs (Figs.1and2) illustrate the proportion of jobs at each department within the organisation and the number of people in each level of the organisation.
Data preprocessing
With the final goal of understanding and visualising the likely effect automation will have on a workforce, we mapped the four categories of tools described above to features of tasks. Even if neither exhaustive nor entirely precise, such a mapping allows us to use scenarios to calculate and visualise the fraction of human work, in person-hours, that these tools could take on as they are fully adopted. Specifically, we map the tools to tasks as follows:
• Repetitive tasks→{Data Wrangling, Optimisation}
• Research related tasks→{Dynamic Optimisation, Supervised Learning} • Standardized tasks→{Data Wrangling, Supervised Learning}
• Analysis related tasks→{Supervised Learning, Unsupervised Learning}
At the same time, each task was associated to a set of action keywords that enabled us to match responsibilities in job descriptions to a specific technology (seeAppendixfor the complete list of keywords). It is important to underscore that, even if at first glance tasks
Fig. 2Number of employees within a specific level (from our banking dataset)
do not uniquely match one technology, action keywords allowed us to uniquely match a task category to a technology category.
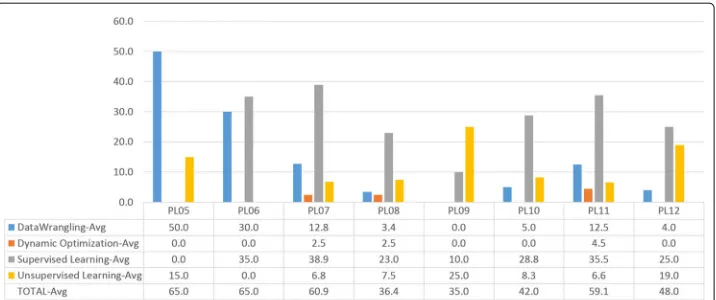
Having established a map between technologies and tasks, we manually checked the 348 job descriptions and the percentage indicating the proportion to which each task of a specific job could be done with one of the technologies described above. With this information, we calculated the percentage of replacement each technology will have on every department or level within the organisation. It is this percentages that we use as input for out model. The following charts (Figs.3and4respectively) show the percentage each department and level within the organisation is likely to be impacted by a particular technology.
Fig. 4Percentage of tasks to be carried out by AI-related technologies by level within the organisation; e.g., 50% of the tasks performed now by humans in the level P05 will be done by Data Wrangling-related technologies, and 15% with Unsupervised Learning technologies
Data modelling
Finally, we calculated the proportion of jobs that have the potential to be displaced by AI-related technologies. We performed this calculation by department and level within the organisation. The data that was obtained from the pre-processing stage was stored into matrixAI(a D×4 matrix, whereDstands for the number of departments within the organisation and 4 for the number of AI-related technologies).
The procedure we use to calculate changes associated to the workforce through time begins by assuming there are three main parameters that determine the feasibility of each of the technologies described above:
• Scientific availability (Sti):This parameter indicates whether the scientific foundations of technologyi exist at a given time t. We defineSit∈[ 0, 1]
• Commercial availability (Cti):This parameter indicates whether there are commercial vendors for technologyi at time t. We defineCit∈[ 0, 1]
• Willingness to adopt (Wti):This parameter indicates whether a given firm will be willing to adopt technologyi at time t. We defineWti∈[ 0, 1]
As before,i= {DW,O,SL,USL}andt= {1, 2, ...,T}. Notice we do not assume to know the exact values for each of the parameters above. These parameters will be introduced to the model by the user as parameters to produce visualisations.
Next, we define the adoption of any of the technologies described before at timetas follows:
adoptionit=Sit×Wti×Cti (1)
R=AI×ADOPT (2)
WhereRis aD×Tmatrix that we call the replacement matrix. Specifically, each row of Rstands for departmentdin the organisation, each of the columns ofRrepresent a time periodtand each entry(d,t)inRis the potential rate of replacement of tasks in a given department at a specific period of time. Notice that entry(d,t)inRis between zero and one. Therefore, we use the following to calculate the rate of persistence (i.e. the percentage of workers that potentially can remain in the organisation) of the workforce at timet:
Pd,t=1−Rd,t (3)
Having calculated the rate of persistence, we proceed to calculate the actual proportion of tasks within the organisation that will remain by department at each periodt. From our job description data, we know the proportion of workers performing certain tasks in each department within the organisation. This is given byinit, that is aD×1 vector. Therefore, the proportion of workers remaining in the organisation by department at every periodt will be given by:
W =initP (4)
Finally, the proportion of the work that potentially will be done by AI is given by:
AIW =initAI (5)
Whererepresents element-wise multiplication. The same procedure was used to calcu-late the proportional impact of AI-recalcu-lated technologies by level within the organisation.
Once described the modelling choices, we proceed to describe now the technologies behind foo.castr, the visualisation tool we have implemented to present the different results of the described model with different sets of parameters.
foo.castr: visualising the impact of AI automation on the workforce
The use of visualisation tools to convey information is ubiquitous in modern science. Humans are biologically and socially shaped to quickly decipher visual cues conveying a great amount of complex knowledge. In this context, visual tools provide a very valuable mechanism to 1) explore the data, and 2) communicate knowledge to others [14]. Visual data exploration can then be understood as an evolving hypothesis-generation process [15], in which hypotheses can be validated or rejected on a visual basis, and new ones can be introduced.
Large scale visualisation has recently arise as a promising area of development with the aim of providing not only a bigger display canvas, but a social space for collaborative and interactive data exploration. At Imperial College London, we are fortunate enough to have available one of such environments —the Data Observatory— in which visualisations for Bitcoin transactions [16] and large graphs [17] have been developed, to name a few.
With this rationale in mind, we have designed foo.castr as a visual tool that can be presented in a large visualisation studio such as the Data Observatory. It enables users to visualise the impact of AI automation on the workforce of an organization. In particular,foo.castrallows to:
2 Create scenarios by changing assumptions ofSit,CtiandWti.
3 Visualise rates of adoption of AI-related technologies in a given period of time, givenSit,CtiandWtitogether with a brief description of the scenario they might represent.
The tool was built in Python 2.7 and made use of web technologies such as HTML, CSS and Javascript to generate and display the visualisations. In order to load the data and serve the visualisation, we made use ofFlask. In our systems,foo.castris hosted in an Apacheserver on aLinux Ubuntuvirtual machine.
foo.castris currently a proprietary software from the authors of this manuscript and will be commercially available in the near future through consultancy agreements with interested parties.
In particular, the data was, first, preprocessed by manually mapping tasks into AI-related technologies (see “Data preprocessing” section); and, then, modelled using pandasandnumpy(see “Data modelling” section). Once we obtain matricesW and AIW, the latter were then re-formatted into JSON to represent a directed graph. To be specific, at every periodta node in graphg represents a department/leveldwithin the organisation or an AI-related technology i. The nodes were connected to other(s) at periodt+1. The strength of the edges indicate the proportion of nodei∈gin periodt that has gone to either nodei∈ gor another nodej∈gin periodt+1. Formatting the data in this way allowed us to make use ofd3.jsto produce the visualisation, and more concretely thesankeyimplementation ind3.js.
Within the framework, we defined three views. The first one (Fig.5) graphed adoption curves that represent scenarios by depicting the assumptions done in variablesSit,Ctiand Wti. The second one (Figs.6, and7for a detail) depicts potential flow of tasks by depart-ment/level to AI technology and vice-versa by period of time. The third one (Fig.8) shows changes in the proportion of department/levels and use of AI-technologies from periodt to periodt+1.
In the current version of foo.castr, we have also designed three different predefined scenarios (described below) that assume different adoption variablesSti,CitandWti; this values are all saved as JSON files for later reproducibility, and some of them are actually shown in Tables1,2,3,4,5and6.
To the best of our knowledge,foo.castris the first tool that aims at providing a detailed view on the impact of AI and Automation on the workforce. Several generalist tools
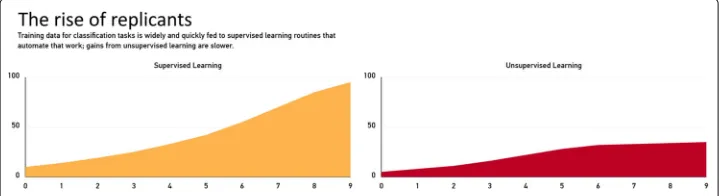
Fig. 5Panel I offoo.castr: It provides a brief description of the current scenario and a visual representation of howSi
tandCtihave been modelled in it. The figure shows the scenarioThe rise of replicants(successful
Fig. 6Panel II offoo.castr: flow of jobs by department to AI technology by period of time. Every rectangle in the leftmost coloured in shades of gray, blue and green represent a department within organisation. The length of the rectangle represent their proportional size within the organisation. Every rectangle in the leftmost coloured in shades of orange represent AI related technologies and their length their proportional use in the organisation. Strings flowing from the leftmost section to the next section to the right represent the proportion of tasks within a department in the organisation that get replaced with AI-related technologies. Subsequent strings flowing to the right represent tasks replaced with AI related technologies at different points in time. The used scenario isThe rise of replicants, and we can see how towards the end of the time the shifting towards AI-related technologies clearly grows
are available to create dashboards and to visualise data (e.g. Tableau, Excel, Spotfire, or PowerBI), but none is particularly aimed at understanding this impact.
Three illustrative scenarios for evaluating adoption of AI-related technologies
We designed three scenarios that represent different rates of success in the scientific development and commercial adoption of Supervised and Unsupervised Learning tech-nologies. These scenarios are aimed at representing three different rates of change for variablesSitandCtiin a period oft= 1, ..., 10 and their implications for the workforce of our industrial partner. For ease of exposition, we will assumeWti = 1 for allt, and that Data Wrangling and Dynamic Optimisation related technologies are now well developed scientifically and quickly adopted; i.e,Stj = Ctj = Wtj = 1 for alltandj = {DW,DO}.
Fig. 8Panel III offoo.castr: change in the proportion of departments and use of AI technologies by period of time. Every rectangle in the leftmost coloured in shades of gray, blue and green represent a department within organisation. The length of the rectangle represent their proportional size within the organisation. Every rectangle in the leftmost coloured in shades of orange represent AI related technologies and their length their proportional use in the organisation. Different from the last figure, the flows from strings from the left to the right represent the evolution in the share of tasks done either by a department of the organisation or by AI related technologies. The used scenario isThe rise of replicants, and we can see how towards the end of the time the proportion of tasks replaced by AI-related technologies grows
But Supervised and Unsupervised Learning related technologies lag in their scientific and commercial availability and, hence, willingness to adopt.
The three predefined scenarios are then:
“AI winter, again” This scenario assumes there are some scientific developments in AI related technologies at the moment, but they do not translate into commercial prod-ucts that will be adopted by the general public. Tables1and2respectively describe SitandCtifor supervised and unsupervised learning related technologies.
“The rise of replicants” In this scenario we assume there is a wealth of training data available to enable supervised learning related technologies, but scientific break-throughs in unsupervised learning have stalled commercial availability and, thus, adoption of unsupervised learning related technologies. Tables3and4respectively describeSitandCtifor supervised and unsupervised learning related technologies. “Symbiots spread” This scenario encodes that scientific breakthroughs in unsupervised
learning technologies enable an explosion on the adoption of all AI related technolo-gies. Tables5and6respectively describeStiandCitfor Supervised and Unsupervised Learning related technologies.
Discussion
foo.castrwas first presented to Imperial Business Analytics industrial partners at a work-shop on the Data Science Institute on November 2017. The aim of the workwork-shop was to provide an overview of how their workforce will change given the adoption of AI related technologies. This information was of particular interest to HR decision makers as they will have to cope with the hiring, layovers, retraining and, most important, reshuffling of their workforce.
Table 1Table presents the values for scientific availabilitySitfori=SL,USLandt=0,. . ., 9 under the“AI winter, again”scenario
t=0 t=1 t=2 t=3 t=4 t=5 t=6 t=7 t=8 t=9
SL 0.3 0.35 0.4 0.45 0.5 0.5 0.5 0.5 0.5 0.5
Table 2Table presents the values for commercial availabilityCtifori=SL,USLandt=0,. . ., 9 under the“AI winter, again”scenario
t=0 t=1 t=2 t=3 t=4 t=5 t=6 t=7 t=8 t=9
SL 0.1 0.12 0.16 0.22 0.29 0.34 0.37 0.39 0.4 0.4
USL 0.05 0.06 0.08 0.11 0.15 0.18 0.19 0.2 0.21 0.21
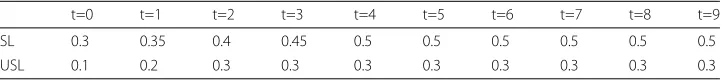
Table 3Table presents the values for scientific availabilitySitfori=SL,USLandt=0,. . ., 9 under the“Rise of replicants”scenario
t=0 t=1 t=2 t=3 t=4 t=5 t=6 t=7 t=8 t=9
SL 0.1 0.14 0.19 0.25 0.33 0.42 0.55 0.7 0.85 0.95
USL 0.05 0.08 0.11 0.16 0.22 0.28 0.32 0.33 0.34 0.35
Table 4Table presents the values for commercial availabilityCtifori=SL,USLandt=0,. . ., 9
under the rise of“Rise of replicants”
t=0 t=1 t=2 t=3 t=4 t=5 t=6 t=7 t=8 t=9
SL 0.1 0.14 0.19 0.25 0.33 0.42 0.55 0.7 0.85 0.95
USL 0.05 0.08 0.11 0.16 0.22 0.28 0.32 0.33 0.34 0.35
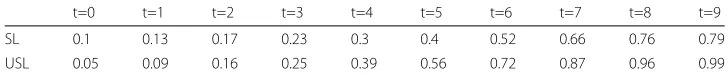
Table 5Table presents the values for scientific availabilitySi
tfori=SL,USLandt=0,. . ., 9 under
the“Symbiots spread”scenario
t=0 t=1 t=2 t=3 t=4 t=5 t=6 t=7 t=8 t=9
SL 0.1 0.13 0.17 0.23 0.3 0.4 0.52 0.66 0.76 0.79
USL 0.05 0.09 0.16 0.25 0.39 0.56 0.72 0.87 0.96 0.99
Table 6Table presents the values for commercial availabilityCtifori=SL,USLandt=0,. . ., 9 under the“Symbiots spread”scenario
t=0 t=1 t=2 t=3 t=4 t=5 t=6 t=7 t=8 t=9
SL 0.1 0.13 0.17 0.23 0.3 0.4 0.52 0.66 0.76 0.79
After several additional events, we have experienced the plausibility and usefulness of foo.castr’s predictions in interactive workshops with executives from large organisations operating in banking, business advisory services, legal services, retail, and telecommuni-cations. In addition, we have presented the model to executives from diverse companies visiting Imperial College’s Data Science Institute. In these workshops and presentations, we have seen evidence that employing predefined scenarios is effective for helping organ-isational decision-makers understand how workforce forecasts depend on the pace of adoption for the four categories of tools described above.
In particular, the scenarios allow participants to relate workforce forecasts to divergent estimates for the pace of technology adoption, and they stimulate conversation about how prepared a focal organisation is to keep pace with technology development and adoption. As important as the tools-to-tasks mapping are, our experience suggests decision makers see greater uncertainty in (1) the pace at which tools will be effective and available for performing tasks previously done by humans, and (2) organisational readiness to keep pace with availability of these tools.
Conclusions
This work has presentedfoo.castr, a tools-for-tasks framework for facilitating group inter-active modelling and visualising of the impact that AI and Automation are likely to have on the future size and shape of a workforce. Whether using scenarios or controls for varying key model parameters, our experiences usingfoo.castrin workshops suggest that scenario-based visualisation is a powerful approach to helping executive teams get to grips with the complex problem of understanding not only the future size and shape or their workforces, but also what they will have to do be keep pace with changes.
Based on our experience, our current research is focused on assessing whether dynamic visualisations of future workforce forecasts are made more or less understandable or con-vincing by enriching the scenario specification to include a larger set of parameters for relating the tools of AI and data science to the tasks performed by people in today’s organ-isations. Additionally, simplifying submission of new organisational datasets (HRJDdata) will ease the job of collecting a growing library of workforce forecasts, and as mentioned above, such a library is a firm foundation for bottom-up aggregation of organisational forecasts into a rigorous economy-wide estimate of AI’s impact on demand for labour.
Appendix
This section includes list of verbs related to four core competencies. Note that words within the lists are not exclusive and they do not intend to be exhaustive. These words, then, are attributed to one AI-related technology to proceed with the categorisation of jobs described above. Notice that competencies may be related to one or more AI-related technologies and that the disambiguation for the category that was going to be assigned to a particular job description was made by the coder.
• Competencies:
classified, charted, clarified, logged, assisted, advocated, executed, verified, collected, set-up, scheduled, expedited, answered, supported, ordered, processed, purchased, generated, systematized, reserved, demonstrated, facilitated, supplied, arranged, insured, obtained, updated, aided, generated, provided.
– Research: experimented, diagnosed, inspected, summarized, formulated, examined, modified, conducted, interpreted, solved, searched, invented, tested, located, calculated, determined, clarified, gathered, extracted,
compared, surveyed, measured, organized, researched, detected, investigated, computed, interviewed, collected, explored.
– Analysis: determined, estimated, appraised, developed, managed, resolved, spearheaded, utilized, transformed, reconciled, modelled, retrieved,
integrated, shaped, assessed, surpassed, solved, critique, balanced, corrected, measured, audited, restored, reduced, researched, projected, monitored, marketed, engineered, programmed, analysed, reduced, identified, planned, evaluated, forecast, conserved.
– Standardized: converted, installed, administered, calculated, facilitated, clarified, maintained, conserved, planned, adjusted, restored, scheduled, operated, tested, followed, rectified, overhauled, built, remodelled, fortified, simplified, regulated, displayed, replaced, repaired, upgraded, printed, assembled, specialized, specialized, studied, adapted, allocated, computed, debugged, constructed.
• Relationship between competencies and AI-related technologies
– Repetitive: Data Wrangling, Dynamic Optimization. – Research: Dynamic Optimization, Unsupervised Learning. – Standardised: Data Wrangling, Supervised Learning. – Analysis: Supervised Learning, Unsupervised Learning.
Acknowledgements
Authors would like to thank 1) the global banking firm who kindly share their HR data with theImperial Business Analytics Centre; 2) Imperial College Business School students Chu Wang and Prithviraaj Shetty who kindly performed the labelling of tasks; and 3) Imperial’sData Science Institutefor allowing us to use their infrastructure.
Funding
Miguel Molina-Solana is funded by the European Union’s Horizon 2020 research and innovation programme under the Marie Skłodowska-Curie grant agreement No 743623.
Availability of data and materials
Data is not available as they belong to a partner company who kindly shared it with us for this research.
Authors’ contributions
All authors have contributed equally to this work. All authors read and approved the final manuscript.
Ethics approval and consent to participate Not applicable.
Consent for publication Not applicable.
Competing interests
The authors declare that they have no competing interests.
Publisher’s Note
Springer Nature remains neutral with regard to jurisdictional claims in published maps and institutional affiliations.
Author details
Received: 10 May 2018 Accepted: 19 September 2018
References
1. Frey CB, Osborne MA. The future of employment: How susceptible are jobs to computerisation? Technol Forecast Soc Chang. 2017;114:254–80.https://doi.org/10.1016/j.techfore.2016.08.019.
2. Arntz M, Gregory T, Zierahn U. Revisiting the risk of automation. Econ Lett. 2017;159:157–60.https://doi.org/10. 1016/j.econlet.2017.07.001.
3. Schwab K. The Fourth Industrial Revolution. Foreign Aff. 2015.https://www.foreignaffairs.com/articles/2015-12-12/ fourth-industrial-revolution.
4. Tegmark M. LIFE 3.0: Being Human in the Age of Artificial Intelligence. Allen Lane; 2017.
5. O’Neil C. Weapons of Math Destruction : How Big Data Increases Inequality and Threatens Democracy. Penguin Random House USA: 2016. p. 259.
6. Autor DH, Katz LF, Kearney MS. The Polarization of the U.S. Labor Market. Am Econ Assoc Pap Proc. 2006;2:189–94. 7. Beaudry P, Green DA, Sand BM. The Great Reversal in the Demand for Skill and Cognitive Tasks. J Labor Econ.
2016;34(S1):199–247.https://doi.org/10.1086/682347.
8. Acemoglu D. Technical Change, Inequality, and the Labor Market. J Econ Lit. 2002;40(1):7–72.https://doi.org/10. 1257/0022051026976.
9. Acemoglu D, Restrepo P. The Race Between Machine and Man: Implications of Technology for Growth, Factor Shares and Employment. 2016.https://doi.org/10.3386/w22252.http://www.nber.org/papers/w22252.pdf. 10. Chui M, Manyika J, Miremadi M. How Many of Your Daily Tasks Could Be Automated? 2015.https://hbr.org/2015/
12/how-many-of-your-daily-tasks-could-be-automated.Accessed 16 Feb 2018.
11. Tushman ML, Anderson P. Technological Discontinuities and Organizational Environments. Adm Sci Q. 1986;31(3): 439–65.
12. Brynjolfsson E, McAfee A. The Second Machine Age: Work, Progress, and Prosperity in a Time of Brilliant Technologies. New York, London: WW Norton & Company; 2014.
13. Arthur WB. Increasing Returns and Path Dependence in the Economy. Ann Arbor: University of Michigan Press; 1994. 14. Fayyad U, Grinstein GG, Wierse A. Information Visualization in Data Mining and Knowledge Discovery. San
Francisco: Morgan Kaufmann Publishers Inc.; 2002.
15. Keim DA. Visual exploration of large data sets. Commun ACM. 2001;44(8):38–44.https://doi.org/10.1145/381641. 381656.
16. McGinn D, Birch D, Akroyd D, Molina-Solana M, Guo Y, Knottenbelt WJ. Visualizing Dynamic Bitcoin Transaction Patterns. Big Data. 2016;4(2):109–19.https://doi.org/10.1089/big.2015.0056.