R E S E A R C H
Open Access
A parametric method for cumulative incidence
modeling with a new four-parameter log-logistic
distribution
Zahra Shayan
†, Seyyed Mohammad Taghi Ayatollahi
*and Najaf Zare
†* Correspondence: [email protected]
Department of Biostatistics, Shiraz University of Medical Sciences, Shiraz, Iran
Abstract
Background:Competing risks, which are particularly encountered in medical studies, are an important topic of concern, and appropriate analyses must be used for these data. One feature of competing risks is the cumulative incidence function, which is modeled in most studies using non- or semi-parametric methods. However,
parametric models are required in some cases to ensure maximum efficiency, and to fit various shapes of hazard function.
Methods:We have used the stable distributions family of Hougaard to propose a new four-parameter distribution by extending a two-parameter log-logistic
distribution, and carried out a simulation study to compare the cumulative incidence estimated with this distribution with the estimates obtained using a non-parametric method. To test our approach in a practical application, the model was applied to a set of real data on fertility history.
Conclusions:The results of simulation studies showed that the estimated cumulative incidence function was more accurate than non-parametric estimates in some settings. Analyses of real data indicated that the proposed distribution showed a much better fit to the data than the other distributions tested. Therefore, the new distribution is recommended for practical applications to parameterize the cumulative incidence function in competing risk settings.
Background
In medical research with time-to-event data, there may be more than one final out-come of interest, and this circumstance can complicate the statistical analysis. In such cases, events other than the desired one(s) are considered as competing risks when their occurrence prevents the event of interest [1,2]. An important quantity in compet-ing risk settcompet-ings is the cumulative incidence function (CIF), which makes it possible to calculate the probability of a particular event. In contrast, the cause-specific hazard function (CSHF) calculates the instantaneous rate of the event. For example, in fertility studies in women, researchers are interested in calculating the cumulative live birth rate in the presence of competing risks over time. Competing events, such as the prob-ability of stillborn fetuses or abortions, can be calculated.
Most competing risk analyses of CIF are estimated non- or semi-parametrically [3,4]. However, the parametric model is another available approach for modeling CIF. The
advantage of parametric methods compared to non- and semi-parametric ones is that if a parametric model is selected correctly, it can predict the probability of the occur-rence of events in the long term and provide additional insights about the time to fail-ure and hazard functions [5]. Also, when the survival pattern follows a particular parametric model, the estimates from true model fit are usually more accurate than the non-parametric estimates.
The best known distributions for modeling CIF are the Weibull and Gompertz distri-butions. However, these are suitable only for hazard functions that increase or decrease monotonically; they are inadequate when the hazard function shape is unimodal. In such cases, simple distributions such as the two-parameter log-logistic or log-normal distributions are likely to be better choices. One approach to the construction of flex-ible parametric models is to add a shape parameter to provide a wide range of hazard shapes and improve the models in survival data. In 1996, Mudholkar et al. proposed a generalized Weibull family with a range of hazard shapes [6] and Foucher et al. in 2005 applied this distribution in semi-Markov models [7]. In 2006, Sparling et al. pre-sented a three-parameter family of survival distributions that included the Weibull, negative binomial, and log-logistic distributions as special cases [8]. These distributions can fit U-shapes or unimodal shapes for the hazard function, and therefore can be appropriate for survival data.
In light of the issues summarized above, a more efficient parametric distribution with various shapes of hazard patterns would appear to be useful for estimating CIF in com-peting risk situations. In recent years, various parametric distributions have been devel-oped specifically for analyzing competing risk data that offer more flexibility. For example, in 2006 Jeong introduced a new parametric distribution for modeling CIF [5]. In 2009, Wahed et al. developed Weibull’s distribution, resulting in a beta-Weibull four-parameter distribution for use in competing risks [9]. Here, we propose a new four-parameter log-logistic distribution by extension of a two-parameter log-logistic distribution that contains different kinds of hazard shapes in survival data and increases the efficiency of the CIF over the non-parametric approaches. Also, this is an improper distribution which enjoys more flexibility for modeling of CIF. Therefore, it would be suitable for competing risk models. We have performed a simulation study to compare CIF estimates obtained with the four-parameter distribution and a non-parametric method. After using simulated data to assess the method, we analyzed a real data set to examine the efficiency of our proposed distribution.
Methods
Introduction of the new distribution
The survival function according to a two-parameter log-logistic distribution is as fol-lows:
S(t) = 1
1 +λtτ (1)
Survival function of the four-parameter log-logistic distribution
The two-parameter log-logistic distribution is expanded on the basis of the family of Hougaard stable distributions, whose survival function is as follows:
S(t) =
exp{−υθα α [(
H
θ + 1)α−1]}
(2)
where H is the cumulative hazard function [11]. If a two-parameter log-logistic cumulative hazard function is used instead of H, we obtain a new distribution that is improper. In addition, to reduce the number of parameters, the substitutionυ=θ2-ais used [12]. The survival function of the new distribution is constructed as:
S(t;λ,τ,θ,α) =
exp{−θ
2
α[(
log(1 +λtτ)
θ + 1)α−1]}
(3)
where the parameter space is θ > 0,l> 0, τ> 0, -∞<a <∞. The survival function must be between zero and one, as shown in the Appendix. If a< 0, the survival func-tion is improper. This is an important characteristic of CIF modeling that differs from the two-parameter log-logistic distribution and other distributions.
Hazard function
The hazard function can be directly obtained from equation (3), as:
h(t;λ,τ,θ,α) =− d dtS(t) S(t) = θτλtτ−1
1 +λtτ [
log(1 +λtτ) θ + 1]α−1
(4)
Because of the complexity of this hazard function formula, there is no simple mathe-matical expression for different types of hazard function. The flexibility of the hazard function is shown in Figure 1. Compared to the two-parameter model, the four-para-meter log-logistic distribution has a flexible hazard function that can be monotonically decreasing or increasing, unimodal, or U-shaped.
Cumulative incidence function
Competing risks data are represented as a pair (T,δ) whereδis the indicator variable, defined asδ= 0 if the observation is censored, and asδ= 1,2,...,KwhereKis the num-ber of competing events. T is the time to first event or censoring. The two major quantities in the analysis of competing risks data are CSHF and CIF. The CSHF rate for event kis the instantaneous event rate for an individual who experiences event kat time tgiven that the subject experiences no other type of event up tot. The CIF for eventk, Fk(t) =P(T≤ t,δ =k), is the cumulative probability of observing event kby time t. The CIF for event kis defined as follows:
Fk(t) = t
0
where S(u) = P(T > u) and hk(u) is the hazard function for thekth cause-specific event. In the literature, parametric methods are proposed to estimate CIF with the CSHF method [5,9,13]. Here we have also used the CSHF method to model CIF.
To estimate the CIF non-parametrically, the overall survival function should be replaced with the Kaplan-Meier estimate and the cause-specific cumulative hazard function with the Nelson-Aalen estimate [3].
Estimation method
For convenience, we have assumed throughout this paper that there were two events: the desired event k = 1 and a competing eventk= 2; and that nis the sample size. Because the two event are mutually exclusive, the overall survival function factored into a product of two cause-specific survival functions, i.e. S(t, ψ) = S1(t,ψ1) S2(t, ψ2). Therefore, the likelihood function of the parametric inference is constructed as:
L(ψ1,ψ2) =
n
i=1
(f1(ti,ψ1)δ1if2(ti,ψ2)δ2i
S1(ti,ψ1)1−δ1iS2(ti,ψ2)1−δ2i)
(6)
whereψk = (lk,τk, θk,ak) is the parameter vector for event k, Sk(t,ψk) is the survival function for event k, andfk(t, ψk) is the density function of event kbased on a four-parameter log-logistic distribution.
If event k occurs, δki= 1; otherwise δki = 0 (k= 1,2, i = 1,2,...,n). The covariance matrix, I−1(ψˆ1,ψˆ2), is estimated by the inverse of the Fisher information matrix [14].
According to the invariant property of the maximum likelihood estimate (MLE), the
CIF is estimated by substituting ψˆ in expression (5), which yields
ˆ
Fk(t) = t
0
ˆ
S(u)hˆk(u)du..
Simulation study
A simulation study was used to compare the cumulative incidence estimate of the pro-posed distribution with a three-parameter distribution propro-posed by Sparling [8] and the non-parametric method at different times. As described by Beyersmann in 2009, we first simulated survival timesTwith all-cause hazardsh1(t) + h2(t)on the basis of a two-parameter log-logistic distribution, with l1= 0.3,τ1 = 2.97 for the event of interest and l2= 0.03,τ2= 1.1 for the competing event (based on fertility data). The event type was then determined by a binomial experiment with probability h1(t)/(h1(t) + h2(t))on event type 1 [15,16]. Additionally, we generated censoring times with a binomial experiment. The data sets were simulated with sizes n = 1000, and a 7% censoring level. Using the data thus produced, we applied the four-parameter log-logistic, Spar-ling distributions, and non-parametric method to these data. Accordingly, 1000 sam-ples were generated and the bias and empirical mean square error (MSE) of the CIF at time twere calculated as follows:
biast=
1000
j=1
(Fˆ1j(t)/1000)−F1(t)
MSEt=
1000
j=1
(F1(t)− ˆF1j(t))2/1000
whereF1(t)is the true value of CIF at timet[17].
To test the efficiency of the parametric distribution proposed here, we used another simulation study. Failure times were generated on the basis of a two-parameter Wei-bull distribution with k1= 1.4, p1 = 0.45 for the event of interest andk2 = 1.04,p2 = 0.03 for the competing event. We used the same method to fit the new distribution to these data.
The maximum likelihood estimates of the parameter vectors were calculated by PROC NLMIXED in SAS v. 9.1, and the non-parametric estimate of CIF was obtained with the “cuminc”R function from the “cmprsk” library. Because the determination of a suitable initial value to fit the models is an important problem in numerical studies, many initial values were examined to find a suitable convergence.
Results
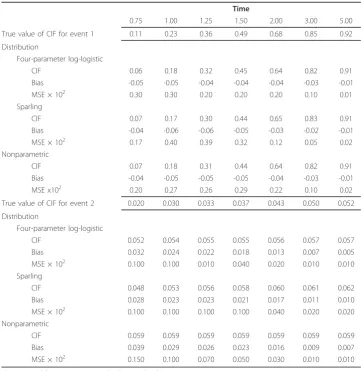
with n = 1000. The results showed that the bias and MSE of the CIF estimates obtained with the four-parameter method for the event of interest at t= 1.25 tot= 2 were smaller than with the Sparling distribution and the non-parametric method. For the competing event, the bias and MSE of the CIF estimates were lower than with the non-parametric method.
The results of the second simulation are summarized in Table 2. Up tot= 1.5, the bias and the MSE of the CIF estimates obtained with the non-parametric method for the event of interest were lower than with the four-parameter method, but aftert= 2, the bias and MSE of the CIF estimates for the competing event with the new distribu-tion were equivalent or slightly lower than with the non-parametric method. For the competing event, the bias and MSE of the CIF estimates were lower than with the non-parametric method at all times.
In summary, these two simulations indicate that the four-parameter modeling of CIF was as efficient as the non-parametric method and the Sparling distribution and some-times led to better estimates of CIF. Moreover, the four-parameter log-logistic model performed well under a Weibull distribution.
Table 1 The results of parametric and non-parametric estimates of CIF based on a four-parameter log-logistic and Sparling simulation for different times.
Time
0.75 1.00 1.25 1.50 2.00 3.00 5.00
True value of CIF for event 1 0.11 0.23 0.36 0.49 0.68 0.85 0.92
Distribution
Four-parameter log-logistic
CIF 0.06 0.18 0.32 0.45 0.64 0.82 0.91
Bias -0.05 -0.05 -0.04 -0.04 -0.04 -0.03 -0.01
MSE × 102 0.30 0.30 0.20 0.20 0.20 0.10 0.01
Sparling
CIF 0.07 0.17 0.30 0.44 0.65 0.83 0.91
Bias -0.04 -0.06 -0.06 -0.05 -0.03 -0.02 -0.01
MSE × 102 0.17 0.40 0.39 0.32 0.12 0.05 0.02
Nonparametric
CIF 0.07 0.18 0.31 0.44 0.64 0.82 0.91
Bias -0.04 -0.05 -0.05 -0.05 -0.04 -0.03 -0.01
MSE x102 0.20 0.27 0.26 0.29 0.22 0.10 0.02
True value of CIF for event 2 0.020 0.030 0.033 0.037 0.043 0.050 0.052
Distribution
Four-parameter log-logistic
CIF 0.052 0.054 0.055 0.055 0.056 0.057 0.057
Bias 0.032 0.024 0.022 0.018 0.013 0.007 0.005
MSE × 102 0.100 0.100 0.010 0.040 0.020 0.010 0.010
Sparling
CIF 0.048 0.053 0.056 0.058 0.060 0.061 0.062
Bias 0.028 0.023 0.023 0.021 0.017 0.011 0.010
MSE × 102 0.100 0.100 0.100 0.100 0.040 0.020 0.020
Nonparametric
CIF 0.059 0.059 0.059 0.059 0.059 0.059 0.059
Bias 0.039 0.029 0.026 0.023 0.016 0.009 0.007
MSE × 102 0.150 0.100 0.070 0.050 0.030 0.010 0.010
Example: women’s fertility history
We tested the proposed distribution on a set of real data. In a cross-sectional study, the fertility history of 858 women aged 15-49 years in rural areas of the Shiraz district (southwestern Iran) was reviewed (unpublished data). The women were selected by multistage random sampling from a list of villages in 2008. Only the first pregnancy of each woman was included in this study. A self-administered questionnaire regarding fertility history was used. After women with an undesired first pregnancy were excluded, the final sample consisted of 652 women. Live birth as a result of the first delivery was our desired event, and a stillborn fetus or abortion was the competing event. The event time was defined as the interval between marriage and a live birth, a competing event or censoring. Also, women who had not given birth on the date of interview (7% in this data set) were censored.
The estimated cumulative incidence of live births and abortions or stillborn fetuses based on the two- and four-parameter log-logistic, Weibull, Gompertz and Sparling distributions and the non-parametric estimates are shown in Figure 2. Up to time t= 3, the cumulative incidence of live births increased rapidly; thereafter, cumulative inci-dence tended to plateau. This means that the probability of live births during the first four years after marriage increased rapidly, and remained approximately constant thereafter. The curves also show that the four-parameter log-logistic distribution was closer to the non-parametric estimate than the other distributions at all times. For shorter intervals since marriage, the two-parameter log-logistic and Sparling distribu-tions were closer to the non-parametric estimates than to the Weibull and Gompertz distributions. After t= 5, all distributions were close to the observed data.
Table 2 The results of parametric and non-parametric estimates of CIF based on a four-parameter log-logistic simulation for different times.
Time
0.75 1.00 1.25 1.50 2.00 3.00 5.00
True value of CIF for event 1 0.19 0.27 0.35 0.43 0.56 0.75 0.91
Distribution
Four-parameter log-logistic
CIF 0.13 0.21 0.29 0.37 0.52 0.73 0.89
Bias -0.06 -0.06 -0.06 -0.06 -0.04 -0.02 -0.02
MSE × 102 0.42 0.49 0.47 0.45 0.22 0.06 0.04
Nonparametric
CIF 0.14 0.22 0.30 0.38 0.52 0.72 0.89
Bias -0.05 -0.05 -0.05 -0.05 -0.04 -0.03 -0.02
MSE × 102 0.26 0.25 0.26 0.29 0.23 0.14 0.05
True value of CIF for event 2 0.017 0.023 0.027 0.031 0.037 0.046 0.051
Distribution
Four-parameter log-logistic
CIF 0.021 0.027 0.032 0.036 0.043 0.052 0.058
Bias 0.004 0.004 0.005 0.005 0.006 0.006 0.007
MSE × 102 0.003 0.003 0.010 0.010 0.010 0.010 0.010
Nonparametric
CIF 0.014 0.014 0.036 0.036 0.049 0.055 0.058
Bias -0.003 -0.009 0.009 0.005 0.012 0.009 0.007
MSE × 102 0.002 0.010 0.010 0.010 0.020 0.010 0.010
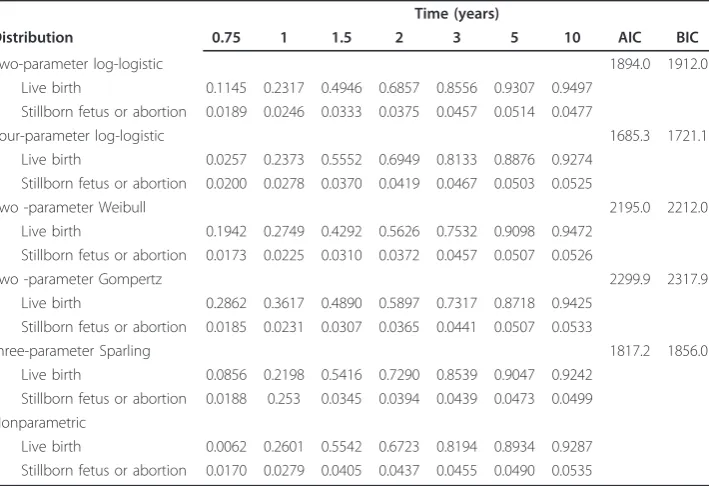
Table 3 shows the Akaike information criterion (AIC), Bayesian information criterion (BIC) and estimated cumulative incidence for two events in different times. Based on AIC and BIC criteria, the four-parameter log-logistic model with the lowest AIC and BIC showed a better fit to the data than the two-parameter log-logistic, Sparling, Wei-bull or Gompertz distributions. Because the two-parameter log-logistic distribution is nested within the Sparling and the four-parameter log-logistic distributions, we can compute likelihood-ratio chi-square statistics to test the fit of the nested models. The likelihood-ratio chi-square statistics and their corresponding p-values are:
Figure 2Cumulative incidence function estimates of live births (a) and abortions (b) with the non-parametric and two- and four-parameter log-logistic, Weibull, Gompertz and Sparling distributions in a fertility history study.
Table 3 The Akaike information criterion (AIC), Bayesian information criterion (BIC) and the estimates of the cumulative incidence function under competing risks based on different distributions with the non-parametric method.
Time (years)
Distribution 0.75 1 1.5 2 3 5 10 AIC BIC
Two-parameter log-logistic 1894.0 1912.0
Live birth 0.1145 0.2317 0.4946 0.6857 0.8556 0.9307 0.9497 Stillborn fetus or abortion 0.0189 0.0246 0.0333 0.0375 0.0457 0.0514 0.0477
Four-parameter log-logistic 1685.3 1721.1
Live birth 0.0257 0.2373 0.5552 0.6949 0.8133 0.8876 0.9274 Stillborn fetus or abortion 0.0200 0.0278 0.0370 0.0419 0.0467 0.0503 0.0525
Two -parameter Weibull 2195.0 2212.0
Live birth 0.1942 0.2749 0.4292 0.5626 0.7532 0.9098 0.9472 Stillborn fetus or abortion 0.0173 0.0225 0.0310 0.0372 0.0457 0.0507 0.0526
Two -parameter Gompertz 2299.9 2317.9
Live birth 0.2862 0.3617 0.4890 0.5897 0.7317 0.8718 0.9425 Stillborn fetus or abortion 0.0185 0.0231 0.0307 0.0365 0.0441 0.0507 0.0533
three-parameter Sparling 1817.2 1856.0
Live birth 0.0856 0.2198 0.5416 0.7290 0.8539 0.9047 0.9242 Stillborn fetus or abortion 0.0188 0.253 0.0345 0.0394 0.0439 0.0473 0.0499 Nonparametric
c2
= 69.2, df = 1, p < 0.001 for two-parameter log-logistic versus Sparling andc2 = 217.1, df = 2, p < 0.001 for two-parameter log-logistic versus four-parameter log-logis-tic. Likelihood-ratio test, AIC and BIC show the four-parameter log-logistic distribu-tion fits the data better than two-parameter log-logistic and Sparling distribudistribu-tions. These results confirm the findings in Figure 2, and again indicate that the proposed distribution shows a closer fit to the observed data than the other distributions to which it is compared.
Discussion
Although non-parametric methods such as the Kaplan-Meier approach are widely used in survival analysis and may show a very close fit to the data, they do not provide addi-tional information about the nature of the data. Therefore, in this study our ultimate aim was to develop a new parametric distribution by extension of the two-parameter log-logistic distribution. The addition of third and fourth parameters allows the model to capture U-shaped hazards.
Our simulation study showed that the parametric estimate of CIF with the new dis-tribution was slightly less biased and had a smaller MSE than the estimate obtained using non-parametric methods. Simulations with the two-parameter log-logistic and Weibull distributions showed that our proposed four-parameter distribution had appropriate efficiency. Also, analyses of real data indicated that the proposed distribu-tion showed a much better fit to the data than the other distribudistribu-tions tested. Our results are consistent with other studies in finding that an appropriate parametric model yields more precise estimates of cumulative incidence than non-parametric methods, and is thus a potentially suitable way to describe quantities of competing risks [9,18]. In contrast, if a parametric model is mis-specified, the quantities will be estimated incorrectly, which will clearly bias the inferences [12]. However, our pro-posed distribution captures various hazard shapes well, which extends its applicability to a variety of survival data.
In addition to this advantage, the proposed distribution is improper fora < 0. This property makes our proposed distribution superior to other distributions such as the Weibull, two-parameter log-logistic, three-parameter Sparling and generalized Weibull models [6,8]. This characteristic of our distribution also makes it possible to evaluate the direct effect of covariates on CIF, which is not possible in the CSHF model [19,20]. The potential applications of direct modeling of CIF and parametric regression models with the four-parameter log-logistic distribution will be examined in forthcoming papers.
Conclusions
Appendix
The survival function of the new distribution is as follows:
S(t;λ,τ,θ,α) =
exp{−θ
2
α[(
log(1 +λtτ)
θ + 1)α−1]}
The parameter space isθ> 0,τ> 0,l> 0, -∞<a<∞. The survival function must be between zero and one for all values in the parameter space. If (θ2[(log(1+ltτ)/θ+1]a/a-1) > 0, then the condition holds. First, ifa> 0, log(1+ltτ)/θ+ 1 must be positive, which implies that log(1+ltτ)/θ> 0 sincel> 0,τ> 0 andθ> 0, log(1+ltτ)/θis always positive. Thus, the condition holds fora> 0. The same result follows for the casea< 0.
List of abbreviations
CIF: cumulative incidence function; CSHF: cause-specific hazard function MSE: mean square error; MLE: maximum likelihood estimate; AIC: Akaike information criterion; BIC: Bayesian information criterion.
Acknowledgements
This work was supported by grant number 90-5604 from Shiraz University of Medical Sciences, Shiraz, Islamic Republic of Iran. The authors would like to thank K. Shashok (Author AID in the Eastern Mediterranean), N. Shokrpour at Emam Reza Polyclinic and the Center for Development of Clinical Research of Nemazee Hospital and Dr J. Millward-Sadler for their editing services.
Authors’contributions
ZS and NZ were responsible for the design, simulation, analysis and interpretation. SMTA supervised the study and interpreted the results. All authors read and approved the final manuscript.
Authors’information
Corresponding author: SMT Ayatollahi, Ph.D., FSS, C.Stat. Professor of Biostatistics, The Medical School, Shiraz University of Medical Sciences, Shiraz, Islamic Republic of Iran. P.O.Box 71345-1874.
Competing interests
The authors declare that they have no competing interests.
Received: 12 July 2011 Accepted: 11 November 2011 Published: 11 November 2011
References
1. Pintilie M:Competing Risks, A Practical Perspective.Chichester: John Wiley & Sons; 2006.
2. Putter H, Fiocco M, Geskus RB:Tutorial in biostatistics, Competing risks and multi-state models.Statistics in Medicine 2007,26:2389-2430.
3. Gray RJ:A class of K-sample tests for comparing the cumulative incidence of a competing risk.Annals of Statistics 1988,16:1141-54.
4. Fine JP, Gray RJ:A proportional hazards model for the subdistribution of a competing risk.Journal of the American Statistical Association1999,94:496-509.
5. Jeong JH:A new parametric family for modelling cumulative incidence functions: application to breast cancer data.Journal of the Royal Statistical Society, Series A2006,169(2):289-303.
6. Mudholkar GS, Srivastava DK, Kollia GD:A Generalization of the Weibull Distribution with Application to the Analysis of Survival Data.Journal of the American Statistical Association1996,91(436):1575-1583.
7. Foucher Y, Mathieu E, Philippe Saint-Pierre P, Durand JF, Daures JP:A Semi-Markov Model Based on Generalized Weibull Distribution with an Illustration for HIV Disease.Biometrical2005,47(6):1-9.
8. Sparling YH, Younes N, Lachin JM:Parametric survival models for interval-censored data with time-dependent covariates.Biostatistics2006,7(4):599-614.
9. Wahed AS, Loung M, Jeong JH:A new generalization of Weibull distribution with application to a breast cancer data set.Statistics in Medicine2009,28:2077-2094.
10. Klein JP, Moeschberger ML:Survival Analysis Techniques for Censored and Truncated Data.New York: Springer; 2003.
11. Hougaard P:Survival models for heterogeneous populations derived from stable distributions.Biometrika1986, 73:387-396.
12. Haile SR:Inference on competing risks in breast cancer data.PhD Thesis, University of Pittsburgh, Biostatistics
Department2008.
13. Benichou J, Gail MH:Estimates of absolute cause-specific risk in cohort studies.Biometrics1990,46:813-826. 14. Jeong JH, Fine JP:Direct parametric inference for the cumulative incidence function.Applied Statistics2006,
55:187-200.
16. Bender R, Augustin T, Blettner M:Generating survival times to simulate Cox proportional hazards models.Statistics in Medicine2005,24:1713-1723.
17. Burton A, Altman DG, Royston P, Holder RL:The design of simulation studies in medical statistics.Statistics in Medicine2006,25:4279-4292.
18. Cheng Y:Modeling cumulative incidences of dementia and dementia-free death using a novel three-parameter logistic function.International Journal of Biostatistics2009,5(1), Art (29).
19. Fine JP:Regression modeling of competing crude failure probabilities.Biostatistics2001,2(1):85-97. 20. Jeong JH, Fine JP:Parametric regression on cumulative incidence function.Biostatistics2007,8:184-196.
doi:10.1186/1742-4682-8-43
Cite this article as:Shayanet al.:A parametric method for cumulative incidence modeling with a new four-parameter log-logistic distribution.Theoretical Biology and Medical Modelling20118:43.
Submit your next manuscript to BioMed Central and take full advantage of:
• Convenient online submission
• Thorough peer review
• No space constraints or color figure charges
• Immediate publication on acceptance
• Inclusion in PubMed, CAS, Scopus and Google Scholar
• Research which is freely available for redistribution