RESEARCH
Deep learning accurately predicts white
shark locomotor activity from depth data
Zac Yung‑Chun Liu
1*†, Jerry H. Moxley
1*†, Paul Kanive
1,2, Adrian C. Gleiss
3, Thom Maughan
4, Larry Bird
4,
Oliver J. D. Jewell
1,3, Taylor K. Chapple
5, Tyler Gagne
1, Connor F. White
1and Salvador J. Jorgensen
1Abstract
Background: The study of bioenergetics, kinematics, and behavior in free‑ranging animals has been transformed through the increasing use of biologging devices that sample motion intensively with high‑resolution sensors. Overall dynamic body acceleration (ODBA) derived from biologging tags has been validated as a proxy of locomotor energy expenditure has been calibrated in a range of terrestrial and aquatic taxa. The increased temporal resolution required to discern fine‑scale processes and infer energetic expenditure, however, is associated with increased power and memory requirements, as well as the logistical challenges of recovering data from archival instruments. This limits the duration and spatial extent of studies, potentially excluding relevant ecological processes that occur over larger scales. Method: Here, we present a procedure that uses deep learning to estimate locomotor activity solely from vertical movement patterns. We trained artificial neural networks (ANNs) to predict ODBA from univariate depth (pressure) data from two free‑swimming white sharks (Carcharodon carcharias).
Results: Following 1 h of training data from an individual shark, ANN enabled robust predictions of ODBA from 1 Hz pressure sensor data at multiple temporal scales. These predictions consistently out‑performed a null central‑ten‑ dency model and generalized predictions more accurately than other machine learning techniques tested. The ANN prediction accuracy of ODBA integrated overtime periods ≥ 10 min was consistently high (~ 90% accuracy, > 10% improvement over null) for the same shark and equivalently generalizable across individuals (> 75% accuracy). Instan‑ taneous ODBA estimates were more variable (R2= 0.54 for shark 1, 0.24 for shark 2). Prediction accuracy was insensi‑ tive to the volume of training data, no observable gains were achieved in predicting 6 h of test data beyond 1–3 h of training.
Conclusions: Augmenting simple depth metrics with energetic and kinematic information from comparatively short‑lived, high‑resolution datasets greatly expands the potential inference that can be drawn from more common and widely deployed time‑depth recorder (TDR) datasets. Future research efforts will focus on building a broadly generalized model that leverages archives of full motion sensor biologging data sets with the greatest number of individuals encompassing diverse habitats, behaviors, and attachment methods.
Keywords: White shark, Biologging, Machine learning, Locomotion, Dynamic body acceleration, Data augmentation, Neural networks
© The Author(s) 2019. This article is distributed under the terms of the Creative Commons Attribution 4.0 International License (http://creat iveco mmons .org/licen ses/by/4.0/), which permits unrestricted use, distribution, and reproduction in any medium, provided you give appropriate credit to the original author(s) and the source, provide a link to the Creative Commons license, and indicate if changes were made. The Creative Commons Public Domain Dedication waiver (http://creativecommons.org/ publicdomain/zero/1.0/) applies to the data made available in this article, unless otherwise stated.
Open Access
*Correspondence: [email protected]; [email protected]
†Zac Yung‑Chun Liu and Jerry H. Moxley share co‑first authorship 1 Monterey Bay Aquarium, 886 Cannery Row, Monterey, CA 93940, USA
Introduction
Biologging tag technologies capable of recording tri-axial motion at increasingly fine resolutions have transformed quantitative studies of biomechanics, energy expendi-ture, and behavior in free-ranging animals [1–4]. Ensuing datasets are highly detailed, but can be limited in scope by their expense, short deployment durations and chal-lenging data retrieval [5, 6]. Unlike many other tagging technologies, high resolution (> 5 Hz) motion-sensitive biologgers are currently exclusively archival. These tags need to be recovered to access the memory, which can prove difficult in wide-ranging species [6, 7]. Widely used time-depth recorders (TDRs) [8–10], are less affected by these constraints due to lower required sampling fre-quencies, facilitating data transmissions to satellites [11–
13]. However, without motion-sensitive logging, they have lacked the ability to elucidate fine-scale behavior, locomotor-kinematics and bioenergetics [14].
The rates at which wild animals expend and acquire energy ultimately determine vital rates that are influential on survival and fitness [1, 15, 16]. Measuring patterns of energy expenditure at an individual scale, thus, informs life history [17], foraging [18], biogeography [19], behav-ioral strategies [20, 21], and ultimately conservation [14]. Prior to the advent and expanding use of animal-borne biologging sensors [22, 23], energy use and metabolic rates were approximated in the laboratory using direct and indirect calorimetry, in the field using doubly labeled water [24], or heart rate monitoring [25]. In the last dec-ade, motion-sensing biologging tags have emerged as an effective tool for approximating metabolic rate, with overall dynamic body acceleration (ODBA) emerging as a common proxy of locomotory energy expenditure that has been calibrated in numerous taxa [26–30]. Recent work has shown ODBA is particularly well suited to esti-mating energy expenditure in fishes [31–33].
Sampling dynamic body motion, for ODBA calculation, requires infra-second sampling rates and storing these data consumes disproportionate amounts of on-board power reserves [6]. Large volumes of high-resolution data are difficult to relay via satellite or acoustic telem-etry due to bandwidth restrictions, and the power draw of transmissions [6]. As such, standard practice man-dates device retrieval for full data acquisition, especially for many marine animals that surface infrequently and/ or travel beyond land-based transmission infrastructure [34]. For species that do not reliably return to locations where they can be recaptured, marine scientists primar-ily use remote release mechanisms (e.g., corrodible wires, suction release, etc.) to ensure device retrieval within an accessible area [34]. While remote release methods are fruitful especially when combined with a localizing VHF or satellite beacon [7, 34–36], this approach leads to
abbreviated tag deployments and largely limits data col-lection to areas close to the site of capture.
Biologging studies often require tags to condense or simplify the data collected in a process called data abstraction, which is designed to best represent the origi-nal data in the fewest number of data points. However, a secondary approach, which is often used during post processing is data augmentation, when one dataset is used to impute a separately, not directly measured vari-able. These techniques are a fruitful way to circumvent constraints on data richness [37]. Machine learning (ML) methodologies may be particularly useful in data aug-mentation. ML techniques are capable of a wide variety of linear and nonlinear approximation and offer advan-tages in modeling correlative relationships with com-plex and interactive behavior, with minimal underlying assumption [38]. ML techniques have been applied in movement ecology [39–41] and accelerometry studies [42–45], primarily for behavioral state or classification tasks [46, 47]. Leveraging biologging’s data richness, ML could be applied to augment new and existing economi-cally sampled data streams.
Locomotor activity in swimming animals has been shown to vary with the rate of change of depth and this relationship is evident in the dive patterns of diverse taxa including pinnipeds, sharks [48], and teleosts that do not rely on gas-bladders for buoyancy [49]. There are a number of mechanisms that likely contribute to this rela-tionship. First, for organisms with negative buoyancy, increased work will be associated with moving against gravity during ascent relative to descent at a given rate [50, 51]. For organisms with net-positive buoyancy [52], this relationship will be reversed as work is now against the buoyant force. Second, acceleration associated with changes in vertical direction and velocity incur locomo-tor cost, and this should be reflected in ODBA. Thirdly, hydrodynamic resistance is a squared function of speed, and changes in depth reflect the vertical component of the animal’s swimming speed.
into an unobserved 3rd dimension, volume. From these secondary signals, a better picture of the unobserved dimensions, and their integrated metric, ODBA, might be inferred.
Here, we sought to use ANNs and other machine learn-ing methods to estimate the energetics of free-swimmlearn-ing sharks from time-depth measurements of vertical move-ments alone. Our approach used archival biologging tags sampling tri-axial acceleration and depth data from white sharks (Carcharodon carcharias). We aimed for sim-ple model designs that minimized data consumed and required minimal model tuning. Our goal was simply to (a) test whether artificial neural networks (ANN), in comparison to other approaches, could provide an accu-rate locomotor energy expenditure estimate with a rea-sonable ration of training data to test data from a single individual, and (b) determine whether resulting models and performance were robust to generalization when deployed on data from other individuals without addi-tional training data. This proof-of-concept could offer a pathway for overcoming constraints that limit activity-tracking at extended scales (e.g., over a season or year, or the full migratory range of an animal’s movement), and for enriching large volumes of historical TDR data with novel insights into animal activity rates.
Methods
Biologging data collection
Accelometry and vertical movement data were extracted from fin-mounted biologging tags deployed on two indi-vidual white sharks referred to here as shark 1 and shark
2 deployments. After attracting sharks to a research boat using a seal decoy, tags were attached to the dorsal fins of two free-swimming white sharks (shark 1–4 m male; shark 2–3.4 m female) using a pole-mounted spring-loaded clamp [35, 36] with a programmable release mechanism. Data were collected from deployments in November 2015 (shark 1) and November 2016 (shark 2) at Tomales Point in central California. Tags were deployed for 27 and 29 h, respectively. For this study, depth and tri-axial accelerations were truncated to a standard 24-h continuous record. Raw acceleration and depth were sampled at 40 and 20 Hz, respectively. Static acceleration was calculated by using a 5-s running mean of the raw acceleration data, and dynamic acceleration was calculated by subtracting the static acceleration from the raw acceleration. ODBA was calculated as the sum of the absolute value of smoothed tri-axial dynamic accel-erations [53]. Both depth and ODBA were down-sampled to 1 Hz for model input.
Feed‑forward artificial neural networks (ANNs)
Feed forward artificial neural networks consist of inter-connected computational units referred to as neurons. Simply represented, input data is passed through an input layer and subsequently propagated through a defined number of hidden layers whereby the sum of the prod-ucts of the connection weights from each layer approxi-mate a function to estiapproxi-mate the observed output values [54]. Under repeated iteration and adjustment of the con-nection weights, a function between input (depth) and output (ODBA) is as closely estimated as possible given
a
b
the parameter space available in the network (ODBA in this case) [55–57]. This ability to approximate a wide variety of continuous functions when given appropriate parameter space is called the Universal Approximation Theorem [38]. Detailed development of model architec-ture lies in the selection of node functions (i.e. activation functions), layer sizes (number of hidden layers and num-bers of nodes in each layer), learning rate, regularization parameters, and parameter dropout.
The workflow for tuning ANNs consisted of two stages: (1) training and validation, and (2) testing. As described above, the neural network used the input parameters as the first layer of neurons, and the last layer of neu-rons represents the predicted output values. During the training and validation phase, the cost (or loss) function, in this case the mean squared error (MSE), was used to evaluate the performance of the ANNs by comparing the instantaneous ODBA data to the output values pre-dicted by the ANNs. Stochastic gradient descent, a com-mon optimization method for ANNs, was then used to iteratively adjust the weights and biases for each neuron to allow the ANNs to best approximate the training data output. At each iteration, a backpropagation algorithm estimated the partial derivatives of the cost function with respect to incremental changes of all the weights and biases, to determine the gradient descent directions for the next iteration. Note that in our model, the neurons of each hidden layer were composed of Rectified Linear Units (i.e., a ReLU activation function), to avoid the van-ishing gradients and to improve the training speed [58]. Validation data were not used in the optimization or backpropagation algorithms. Instead, the cost function was evaluated over the validation data served as an inde-pendent tuning metric of the performance of the ANN; if the cost function of validation data was increasing with each iteration, it would suggest that the neural net is overfitting the training data.
We used Python toolkit Keras library, which provides a high-level application programming interface to access Google’s TensorFlow deep learning library. For the exam-ples chosen here, we used an adaptive moment estima-tion (Adam) optimizaestima-tion method, a stochastic gradient descent algorithm that computes adaptive learning rates [59].
ANNs model development
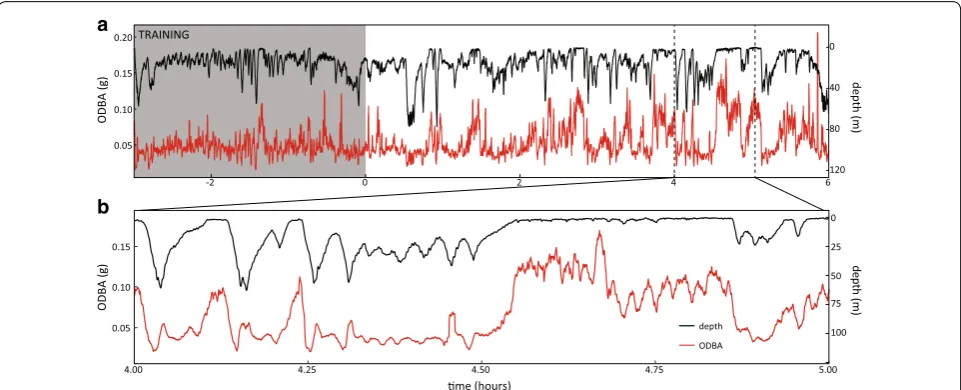
ANNs were tuned across a range of training data vol-ume, while tested on a standardized 6-h set of 1 Hz depth data (n= 21,600 data points) withheld from tuning and training procedures (Fig. 1). Initially, ANNs were trained exhaustively with all 18 h of data remaining following the train-test split (i.e., all data independent of the standard 6-h test set) while optimal ANN architectures were tuned
and evaluated. Following an initial evaluation, train-ing datasets consisted of 1-h increments of 1 Hz meas-urements of depth and ODBA, with 20% withheld from training for a hold-out cross-validation/development set (Fig. 1).
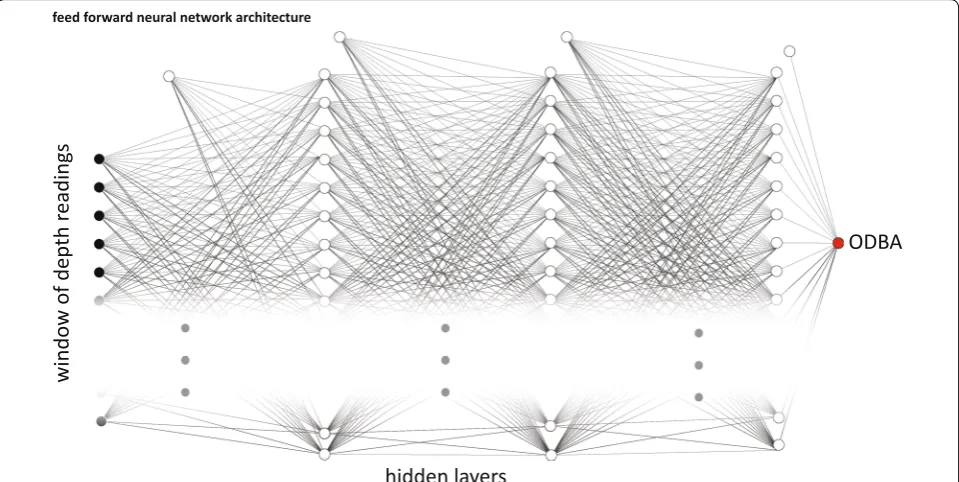
Tuning ANN input features and structures involved varying and evaluating a range of model architectures. Input features are passed to the neural net within mov-ing windows that consist of depth data from t= 1: n
(n= 5:60 input data points) to predict ODBA output at
t= 1 (Fig. 2). Similarly, we tested a range from “shallow” to “deep” structures, varying the interconnected neurons per hidden layer and number of hidden layers (Addi-tional file 1: Table S1). Following initial exploration of model architecture, architectures with good performance were fine-tuned individually to improve results on each deployment’s test set. We used k-fold cross-validation (k= 10) to ensure consistent predictive performance in the test set and prevent overfitting. Artificial Neural Network tuning proceeded to identify minimally trained model structures that produced acceptable R2 values in
the test set and was the basis for selecting moving win-dow size of 30 inputs of depth measurement, and three layers of 40 hidden nodes as a standard architecture for this proof-of-concept study. We then investigated the sensitivity of model results to the volume of training data, tailoring development towards leaner approaches (mini-mal training) that continue to maintain comparable pre-dictive performance on the standard test set. Common techniques were used to minimize overfitting, such as early-stopping [60, 61] and dropout [62].
ANN benchmarking
Additionally, we benchmarked ANN formulations against other common modeling approaches, includ-ing tree-based algorithms, such as random forests [63], and gradient boosting [64], as well as support vector machines [65], and linear regression. Here we applied the same workflow to predict ODBA and compared the performance with the ANN approach. Brief descriptions of each method and its implementation are described below, as well as in similar applications in ecological lit-erature [66–68].
Gradient boosting is another tree-based method that uses a forward stage-wise additive model [64] to iteratively develop predictions from previous “shal-lower” trees. At each boosting stage (n= 100, learning rate = 0.1), subsequent trees are fit to the negative gra-dients of the loss function to improve prediction and optimize parameters [69]. Again no maximum was set for tree depth, number of estimators or number of fea-tures to encourage maximal prediction.
Support vector machines (SVM) are supervised dis-criminative classifiers defined by a separating hyper-plane [65]. Given labeled training, the algorithm categorizes new examples according to optimal hyper-planes that maximize the distance separating the near-est training data of any class. This method has been used in regression problems (‘support vector regres-sion’, [70]) and, as with other methods, was allowed to operate as freely as possible to maximize prediction (degree of polynomial kernel = 5).
Linear regression (LR) is a common method that estimates a predictive relationship between variables by fitting a linear equation. Ordinary least squares were used to estimate parameters defining a linear relationship between the explanatory and response variable.
Evaluation metrics
Model performance in the context of real-world use cases depends on the selection of an appropriate evaluation metric. A range of options exist, and the selection relies on one that is consistent with the estimation needs. Two evaluation metrics were used to understand model per-formance in the test set, a point estimation, and an accu-mulative, or “time-integrated,” measure. The coefficient of determination (R2) was used as a straightforward
eval-uation metric to measure pointwise fitting performance of predicted ODBA with the corresponding observed ODBA at each 1 Hz time step. While point estimate per-formance is valuable for assessing model reliability in predicting instantaneous kinematics and short bursts of activity, we also sought to evaluate the models on broader time scales more relevant to understanding energetic expenditure over ecological temporal and spatial scales. Therefore, we also developed a metric to measure the performance of time-integrated accumulation of pre-dicted and observed ODBA. For intervals with increasing widths (5–10,000 s at 5 s increments), we calculated the area under the curve (AUC) by summing 1 Hz measure-ments of predicted and observed ODBA. Resampling was used to evaluate overall performance throughout the test set, with 2000 randomly placed replicates of each interval
width. For each replicate, we calculated AUC of predicted and observed ODBA; then computed the percentage error. The model accuracy of time-integrated ODBA at a given interval is then defined as:
We also used this metric to test the generalizability of ANNs trained on one individual to predict ODBA from the depth only data of a second individual. Finally, we compared these results to a null model comprising the median computed ODBA value over the same integrated time-scale.
Results
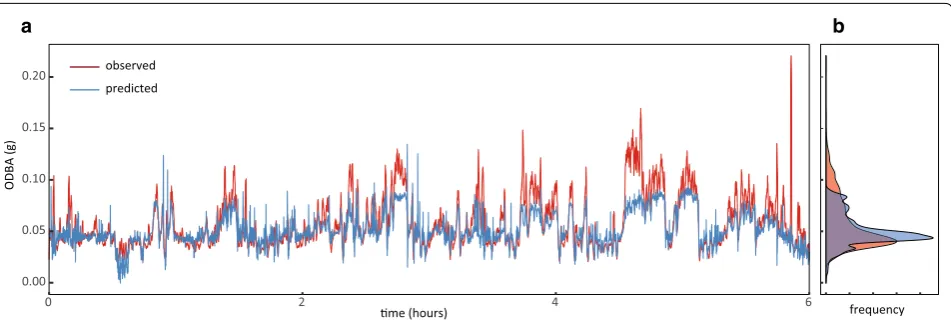
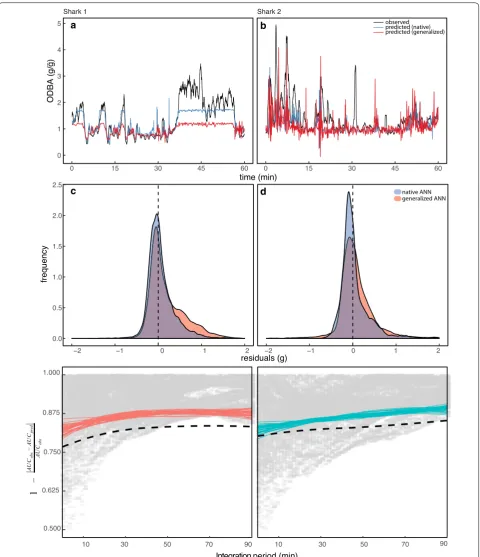
Pointwise estimates of ODBA provided an initial metric for model accuracy at an instantaneous timescale. Fol-lowing 1 h of training the standard ANN model resulted in an R2 of 0.54 for shark 1 and 0.25 for shark 2 (Fig. 3).
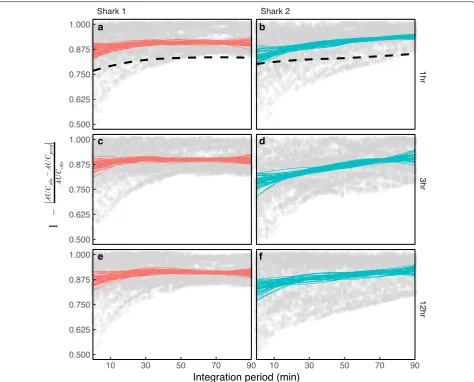
For the time-integrated ODBA predictions, accuracy increased as a function of increasing observation win-dow. In this case test accuracy approached 90% and the range of errors narrowed in both datasets with ODBA binned between 15 and 30 min (Fig. 4). At finer resolu-tions (e.g., intervals between < 1 and 15 min), model accuracy exceeded 85% and 70%, respectively, in both datasets. Asymptotic performance was evident in both datasets after binning ODBA over 90 min but occurred earlier in shark 1 (Fig. 4 and Additional file 1: Figure S1). Model accuracy was relatively insensitive to training duration over 1 h (Fig. 4; and see Additional file 1: Fig-ure S1 for full suite of model accuracy plots from ANNs trained with 1–17 h of data). In a test of generalizabil-ity, the model trained on each shark and used to predict
Accuracy=1−
observed AUC −predicted AUC
observed AUC
ODBA in the other, produced similar time-integrated results with model accuracy ranging from 80% to 85% between < 1 and 30 min bins, respectively (Fig. 5). Moreo-ver, the 10-fold cross-validation tests show consistent predictive performance and appear to have no overfitting issues in our model (Additional file 1: Tables S1 and S2).
At all timescales the ANN model outperformed the null median ODBA model for both the native and gen-eralized model predictions. In comparison to other common ML algorithms, final ANN models performed similarly in native applications (Additional file 1: Figure S2) or exceptionally better in generalized (Additional file 1: Figure S3) cases, respectively. Instaneous perfor-mance of the ANN in the test set (R2= 0.54) was similar
to random forest (R2= 0.57) and gradient boosting
tech-niques (R2= 0.55; Additional file 1: Table S3). Each of
these methods demonstrated greater than 85% accuracy across temporal scales as well (Additional file 1: Figure S2). Unlike ANN’s robust performance in a generalized case (Additional file 1: Figure S3, R2= 0.22), these
meth-ods failed when deployed on data wholly independent of its training (Additional file 1: Figure S3; R2
RF= 0.001,
R2
XGB= 0.001, R2SVM= 0.004, R2LR= 0.002), confirming
other findings that tree-based methods are less generaliz-able [71]. Linear regression failed to produce acceptable results in both native and generalized cases (Additional file 1: Table S3, Additional file 1: Figure S3).
Discussion
Our results demonstrate the ability of supervised machine learning techniques to extract reliable predic-tions of ODBA from vertical movement data (Figs. 3,
4). ODBA is a valuable proxy of energetics derived from accelerometry data that is generally more challenging to
a b
collect, in comparison to vertical movement data. Our approach was particularly suited for predicting ODBA aggregated over timescales of minutes (Fig. 4). At these integrated time scales accuracy neared 90% after 1 h of training data on a single individual and modest model tuning.
The predictive power of deep learning techniques gen-erally improves with the increasing diversity of data [72], leaving further room for increasing predictive accuracy and more broadly generalizing across individuals and perhaps taxa as training sets accumulate. Gains in pre-dicative power through more systematic model architec-ture selection, tuning, and model ensembles could also improve performance. Here we consider the implications
of this ANN-enabled data augmentation procedure for broader amplification of biologging data from sharks and other taxa swimming or flying in 3-dimensional environments.
Vertical movement and the temporal scale of ODBA
We demonstrate deep learning in the ANN can be ade-quately trained to predict locomotor activity in sharks from vertical displacement and may be generalizable to other swimming or flying organisms. Animals mov-ing in fluid environments (i.e., swimmmov-ing, flymov-ing) share a common set of energetic tradeoffs [73] and exhibit convergent properties in gait and locomotion related to optimal energetic efficiency [48, 49]. The strength of the
a b
c d
e f
a b
c d
physics of flying/swimming [74], directional acceleration, and pattern recognition [75]. Therefore, this approach may be accordingly applicable and could be transfer-able cross-taxonomically with further development. For flying/swimming, the constant buoyancy of sharks is responsible for the strong link between locomotor activ-ity and the kinematics of vertical movements [52, 73, 74]. This link should also apply to other swimming organ-isms that have limited or no buoyancy compensation (i.e. gas bladder), for example, ram-ventilating teleosts [49]. Applicability to organisms with compressible volume (e.g. breath-holding organisms) should also be feasible [48], since in this case volume (and therefore buoyancy) will be a predictable function of pressure (vertical posi-tion). However, since these animals can alter gas volume between breath-holds, it may be necessary to train data across a broader set of conditions.
The increasing accuracy of our prediction as a func-tion of ODBA time-aggregafunc-tion (Fig. 4) suggests that this approach is optimally suited for questions and processes on these corresponding time-scales. For example, the locomotor activity of prey acquisition and handling in white sharks can be visualized when ODBA is integrated over minutes [76], and sustained unidirectional migra-tion is reflected in distinctive dive patterns on the scale of weeks to months [77, 78]. On the other hand, studies that require resolution of ODBA on scales of seconds may be less suited for this approach. For example, resolv-ing peak bursts of locomotor activity or individual tail-beat strokes [76] requires sub-second resolution. Indeed, in our results, the areas of mismatch in prediction were largely attributed to short bursts and peaks in ODBA (Fig. 3). Such fine-scale dynamics, however, often can be addressed with short-term studies, where there are few limitations for using the full suite of available biologging tools.
Our preliminary assessment of generalizability sug-gests this approach is capable of ODBA predictions for individuals wholly independent of the ANN’s train-ing set. Our simple exploration swapped ANNs trained from one individual’s training set on the testing set of the other individual (Fig. 5). Distributions of the residuals were unbiased relative to the native instance and time-integrated performance comparable (Fig. 5 and Addi-tional file 1: Figure S1). As a proof of concept, this initial generalizability evaluation demonstrates the feasibility and importantly distinguishes the ANN approach from ML alternatives (Additional file 1: Figure S2, Additional file 1: Figure S3). Though less interpretable comparably, the ANN’s unmatched performance in predicting on data wholly independent of the training source (Addi-tional file 1: Figure S3) demonstrates its broader utility
these methods will be limited by the comprehensiveness (diversity) of their training datasets and further develop-ment should focus on expanding the individuals, behav-iors, and habitats accounted for during training.
Data augmentation through artificial intelligence
The advent of diminutive motion-sensing loggers has rev-olutionized activity tracking in wild animals and greatly advanced ecological understanding in natural settings. However, given the current state of technology, there remain power, memory, and device placement and size constraints limiting the temporal and spatial scale as well as the size of subjects in current studies. As a result, the advances that these sensors promise have yet to be broadly realized at landscape-level scales (e.g. across the full migratory range of a subject, or for a full year). Data augmentation procedures can operate powerfully in tan-dem with animal-borne instrumentation to bridge these constraints extending their use in future studies and potentially leverage novel information from large vol-umes of historical TDR data.
Our results suggest that ANN models could enable effi-cient duty cycling of motion-sensing loggers’ sensors that reduce informational loss regarding bioenergetic proxies. We show that between duty cycles, ODBA can be rea-sonably predicted with an inexpensive (power and data) pressure transducer continually logging at ≥ 1 s intervals. Full motion-sensor data cycles could then be minimized to provide adequate amounts of training data. For esti-mating ODBA we found ANNs to be relatively insensi-tive to the volume of training data above the 1 h and were robust even when augmenting 6 times as much data as it was trained with (Fig. 4 and Additional file 1: Figure S1). Such lean augmentation procedures provide promis-ing duty cyclpromis-ing approaches that make efficient use of tag resources with minimal overt information loss. We antic-ipate that the cumulative addition of more and diverse training data sets over time will vastly increase this ratio while improving prediction accuracy.
existing TDR datasets once cross-generalization has been thoroughly validated. An entire biologging database with deep ANN structures [79, 80] implementing trans-fer learning [81] thus holds great promise as a power-ful approach for augmenting biologging data relevant to larger ecological and spatiotemporal scales. This broadly generalizable approach would be much in the same spirit of well-known image recognition models trained the on web database of over 14 million labeled images or the word vector models trained on large volumes of text scraped from vast breadths of the internet [82, 83].
Future directions
We leveraged machine learning to augment sparse ver-tical movement data informed by ecologically-valuable proxies measured by costly and sophisticated biologging technologies. By using these advanced post-processing techniques to bridge the complementary vertical move-ment and ODBA data, biologging studies can exploit strengths of various tagging technologies to extend and generate greater understanding of activity rate and underlying bioenergetics at broader scales. Energy land-scapes, for instance, which are mechanistic frameworks to connect animal movement, behavior, and energetic costs [84], have deepened the understanding of cost-effective movement, resource acquisition, and behavio-ral decisions (e.g., selection of tail-winds in soaring birds [85]), but require extending our ability to estimate loco-motor activity over increased spatio-temporal scales.
Following this proof-of-concept study, to gain the greatest leverage in prediction accuracy, augmentation ratio, and generalizability (including historical data), future work should focus on leveraging a maximum number of full-motion sensor biologging data sets with the greatest number of individuals encompassing diverse habitats, behaviors, and attachment methods. This, cou-pled with a systematic approach for optimal model tun-ing will maximize utility. A more in-depth validation of this technique should help determine optimal duty-cycle ratios for augmentation to guide future tag programming and experimental design. Determining the relationship between TDR sampling rate and ODBA predictive accu-racy will also help determine the minimal data resolution that can be used to estimate locomotor activity.
Alternate deep learning techniques and structures could improve the relatively simple formulation we implemented in this study. Future work can investigate applications of techniques specialized for time series data, such as recurrent neural networks (RNNs) or long short-term memory (LSTM). RNNs have been proved to be very efficient at exploring the dynamic temporal behavior for a time sequence. Similarly, LSTM main-tains a memory of values over arbitrary time intervals
[86] and can be implemented as a layer within an RNN. Such approaches have found success when applied to tasks in speech recognition, handwriting recogni-tion, and polyphonic music modeling as well as finan-cial forecasting problems [87–89]. Other convolutional and recurrent network structures are finding increased traction in ecological and behavioral studies [45, 90]. Despite the inherent time-series nature of our data, we find its simple network structure an ideal first step in applying these techniques in biologging data augmenta-tion schemes.
Conclusion
Here, we have presented a deep learning approach to predicting ODBA from vertical movement data alone and applied resulting neural networks to approximate energetic expenditures of tagged white sharks. For each individual, resulting neural networks proved highly capa-ble at recognizing and learning patterns in vertical move-ment data that were predictive of ODBA measuremove-ments calculated from tri-axial accelerometry data. Testing these trained networks against withheld data demon-strated the neural network’s performance estimating energy expenditure, particularly over broader temporal intervals. Performance was also robust to generalization across individuals. Along with other pioneering eco-logical studies capitalizing on artificially intelligent data processing [45, 90, 91], these approaches can take full advantage of the power of machine learning to push and enhance ecological inference from animal-borne instru-mentation to new scales.
Additional files
Additional file 1: Figure S1. Effect of training data volume on model performance. Consistent response curves and marginal performance gains with increasing training data volume supported minimizing training datasets, and maximizing prediction periods. Figure S2. Native model performance compared between the manuscript’s ANN (a) and alternate methods (b‑d) that produced similar levels of accuracy over longer time‑integrated intervals. In particular, tree‑based models (c‑d) produced equivalent results to the ANN when predicting data within a native case (i.e., the same individual provided the training and testing data). Figure S3. Generalized model performance compared the manuscript’s ANN approaches (b) outperform other methods when trained on data wholly independent (i.e., generalized) from the data used in training. ANN predic‑ tions (a) from a native use (i.e., same individual’s data used in training and testing) were slightly more accurate than testing on data from an entirely different deployment (b). No other method (c‑e) produced similar results, in spite of strong performance in the native case (Supplement Figure 2).
Table S1. Preliminary results from ANN’s sensitivity to volume of training data show marginal improvements (and, in cases, loss) after 1 hour of training. Table S2. Metrics evaluating the effects of different ANN model design and tuning on the test set prediction through k‑fold validation.
We thank Francisco Chavez, George Matsumoto, Sue Lisin, Ben Becker, Jim Scholfield, Dale Graves, Jon Erickson, Farley Shane, Jose Rosal, Jim Mont‑ gomery, Erik Trauschke, Hans Thomas, Peter Kraft, and Nikolai Liebsch for their assistance. Field data collection was permitted by Point Reyes National Seashore and the California Department of Fish and Wildlife. Computational resources were based on Cyverse and its work supported by the National Science Foundation under Award Numbers DBI‑0735191 and DBI‑1265383. URL: http://www.cyver se.org. The code and data are available on our public Github repository: https ://githu b.com/MBayO tolit h/depth ‑to‑ODBA‑ANN.
Authors’ contributions
SJJ designed the study. PK, SJJ, JHM, TM, LB, SA developed field equipment and conducted field work. ZYCL, TG, CFW, and JHM analyzed the data and drafted the figures. JHM, ZYCL, SJJ, AG wrote the manuscript. All authors contributed data and edited the manuscript. All authors read and approved the final manuscript.
Funding
ACG is funded by the Australian Research Council DECRA fellowship (150100321). OJDJ’s collaboration with Monterey Bay Aquarium is supported by a Company of Biologist, Journal of Experimental Biology, Travelling Fellow‑ ship (JEBTF‑180517) and Veterinary and Life Science, Small Grant, Murdoch University. Further support was generously provided by the Monterey Bay Aquarium and the David and Lucile Packard Foundation.
Availability of data and materials
The datasets used and/or analyzed during the current study are available from the corresponding author on reasonable request.
Ethics approval and consent to participate
Not applicable.
Consent for publication
Not applicable.
Competing interests
The authors declare that they have no competing interests.
Author details
1 Monterey Bay Aquarium, 886 Cannery Row, Monterey, CA 93940, USA. 2 Fish and Wildlife Management, Montana State University, PO Box 173460,
Bozeman, MT 59717, USA. 3 Centre for Sustainable Aquatic Ecosystems, Harry
Butler Institute, Murdoch University, Perth, Western Australia 6150, Australia.
4 Monterey Bay Aquarium Research Institute, 7700 Sandholdt Rd, Moss Land‑
ing, CA 95039, USA. 5 Department of Biology, Stanford University, Pacific Grove,
CA 93950, USA.
Received: 31 August 2018 Accepted: 30 July 2019
References
1. Brown DD, Kays R, Wikelski M, Wilson R, Klimley AP. Observing the unwatchable through acceleration logging of animal behavior. Animal Biotelemetry. 2013;1(1):20.
2. Hussey NE, et al. Aquatic animal telemetry: a panoramic window into the underwater world. Science. 2015;348(6240):1255642.
3. Wilmers CC, Nickel B, Bryce CM, Smith JA, Wheat RE, Yovovich V. The golden age of bio‑logging: how animal‑borne sensors are advancing the frontiers of ecology. Ecology. 2015;96(7):1741–53.
4. Cooke SJ, et al. Remote bioenergetics measurements in wild fish: oppor‑ tunities and challenges. Comp Biochem Physiol A: Mol Integr Physiol. 2016;202:23–37.
5. Rutz C, Hays GC. “New frontiers in biologging science. London: The Royal Society; 2009.
6. Whitney NM, Papastamatiou YP, Gleiss AC. Integrative multi‑sensor tag‑ ging: emerging techniques to link elasmobranch behavior, physiology and ecology. Biol Sharks Relat. 2012;1:265–90.
age for recovering data‑loggers from wild sharks. J Exp Mar Biol Ecol. 2016;475:49–53.
8. Thums M, Bradshaw CJ, Hindell MA. A validated approach for super‑ vised dive classification in diving vertebrates. J Exp Mar Biol Ecol. 2008;363(1–2):75–83.
9. Musyl MK, et al. Postrelease survival, vertical and horizontal movements, and thermal habitats of five species of pelagic sharks in the central Pacific Ocean. Fish Bull. 2011;109(4):341–68.
10. Jepsen N, Thorstad EB, Havn T, Lucas MC. The use of external electronic tags on fish: an evaluation of tag retention and tagging effects. Anim Biotelem. 2015;3(1):49.
11. Arnold G, Dewar H. Electronic tags in marine fisheries research: a 30‑year perspective. In: Electronic tagging and tracking in marine fisheries. New York: Springer; 2001, p. 7–64.
12. Boustany AM, Marcinek DJ, Keen J, Dewar H, Block BA. Movements and temperature preferences of Atlantic bluefin tuna (Thunnus thynnus) off North Carolina: a comparison of acoustic, archival and pop‑up satellite tags. Electronic tagging and tracking in marine fisheries. New York: Springer; 2001. p. 89–108.
13. Block BA, et al. Toward a national animal telemetry network for aquatic observations in the United States. Anim Biotelem. 2016;4(1):6. 14. Wilson AD, Wikelski M, Wilson RP, Cooke SJ. Utility of biological sensor
tags in animal conservation. Conserv Biol. 2015;29(4):1065–75. 15. Brown JH, Gillooly JF, Allen AP, Savage VM, West GB. Toward a metabolic
theory of ecology. Ecology. 2004;85(7):1771–89.
16. Wilson RP, Shepard E, Liebsch N. Prying into the intimate details of animal lives: use of a daily diary on animals. Endanger Species Res. 2008;4(1–2):123–37.
17. Zera AJ, Harshman LG. The physiology of life history trade‑offs in animals. Annu Rev Ecol Syst. 2001;32(1):95–126.
18. Lowe CG. Bioenergetics of free‑ranging juvenile scalloped hammer‑ head sharks (Sphyrna lewini) in Kāne’ohe Bay, Ō’ahu, HI. J Exp Mar Biol Ecol. 2002;278(2):141–56.
19. McNab BK. Minimizing energy expenditure facilitates vertebrate persis‑ tence on oceanic islands. Ecol Lett. 2002;5(5):693–704.
20. Hinch SG, Rand PS. Swim speeds and energy use of upriver‑migrating sockeye salmon (Oncorhynchus nerka): role of local environment and fish characteristics. Can J Fish Aquat Sci. 1998;55(8):1821–31. 21. Costa DP. Reproductive and foraging energetics of pinnipeds: implica‑
tions for life history patterns. In: The behaviour of pinnipeds. New York: Springer; 1991. pp. 300–44.
22. Costa DP. Methods for studying the energetics of freely diving animals. Can J Zool. 1988;66(1):45–52.
23. Kooyman GL. Genesis and evolution of bio‑logging devices: 1963– 2002. 2004.
24. Speakman JR, Racey PA. The doubly‑labelled water technique for measurement of energy expenditure in free‑living animals. Sci Progr. 1988;1:227–37.
25. Butler P, Woakes A. Heart rate and aerobic metabolism in Humboldt penguins, Spheniscus humboldti, during voluntary dives. J Exp Biol. 1984;108(1):419–28.
26. Wilson RP, et al. Moving towards acceleration for estimates of activity‑ specific metabolic rate in free‑living animals: the case of the cormo‑ rant. J Anim Ecol. 2006;75(5):1081–90.
27. Wilson RP, et al. A spherical‑plot solution to linking acceleration metrics with animal performance, state, behaviour and lifestyle. Mov Ecol. 2016;4(1):22.
28. Gleiss AC, Wilson RP, Shepard EL. Making overall dynamic body acceleration work: on the theory of acceleration as a proxy for energy expenditure. Methods Ecol Evol. 2011;2(1):23–33.
29. Fahlman A, Wilson R, Svärd C, Rosen DA, Trites AW. Activity and diving metabolism correlate in Steller sea lion Eumetopias jubatus. Aquat Biol. 2008;2(1):75–84.
30. Halsey L, Shepard E, Quintana F, Laich AG, Green J, Wilson R. The relationship between oxygen consumption and body acceleration in a range of species. Comp Biochem Physiol A: Mol Integr Physiol. 2009;152(2):197–202.
32. Lear KO, Whitney NM, Brewster LR, Morris JJ, Hueter RE, Gleiss AC. Correlations of metabolic rate and body acceleration in three species of coastal sharks under contrasting temperature regimes. J Exp Biol. 2017;220(3):397–407.
33. Wright S, Metcalfe S, Hetherington S, Wilson R. Estimating activity‑spe‑ cific energy expenditure in a teleost fish, using accelerometer loggers. Mar Ecol Progr Ser. 2014;220(3):397–407.
34. Lear KO, Whitney NM. Bringing data to the surface: recovering data loggers for large sample sizes from marine vertebrates. Anim Biotelem. 2016;4(1):12.
35. Gleiss AC, Norman B, Liebsch N, Francis C, Wilson RP. A new prospect for tagging large free‑swimming sharks with motion‑sensitive data‑ loggers. Fish Res. 2009;97(1–2):11–6.
36. Chapple TK, Gleiss AC, Jewell OJ, Wikelski M, Block BA. Tracking sharks without teeth: a non‑invasive rigid tag attachment for large predatory sharks. Animal Biotelemetry. 2015;3(1):14.
37. Fedak M, Lovell P, McConnell B, Hunter C. Overcoming the constraints of long range radio telemetry from animals: getting more useful data from smaller packages. Integr Comp Biol. 2002;42(1):3–10.
38. Hornik K, Stinchcombe M, White H. Multilayer feedforward networks are universal approximators. Neural Netw. 1989;2(5):359–66.
39. Breed GA, Costa DP, Jonsen ID, Robinson PW, Mills‑Flemming J. State‑ space methods for more completely capturing behavioral dynamics from animal tracks. Ecol Model. 2012;235:49–58.
40. Langrock R, King R, Matthiopoulos J, Thomas L, Fortin D, Morales JM. Flexible and practical modeling of animal telemetry data: hidden Markov models and extensions. Ecology. 2012;93(11):2336–42.
41. Michelot T, Langrock R, Patterson TA. moveHMM: an R package for the statistical modelling of animal movement data using hidden Markov models. Methods Ecol Evol. 2016;7(11):1308–15.
42. Nathan R, Spiegel O, Fortmann‑Roe S, Harel R, Wikelski M, Getz WM. Using tri‑axial acceleration data to identify behavioral modes of free‑ranging animals: general concepts and tools illustrated for griffon vultures. J Exp Biol. 2012;215(6):986–96.
43. Carroll G, Slip D, Jonsen I, Harcourt R. Supervised accelerometry analysis can identify prey capture by penguins at sea. J Exp Biol. 2014;217:113076. 44. Ladds MA, Thompson AP, Kadar JP, Slip DJ. “Super machine learning:
improving accuracy and reducing variance of behaviour classification from accelerometry. Anim Biotelem. 2017;5(1):8.
45. Brewster LR, et al. Development and application of a machine learning algorithm for classification of elasmobranch behaviour from accelerom‑ etry data. Mar Biol. 2018;165(4):62.
46. Wilson RP, et al. Give the machine a hand: A Boolean time‑based decision‑tree template for rapidly finding animal behaviours in multisen‑ sor data. 2018.
47. Wang G. Machine learning for inferring animal behavior from location and movement data. Ecol Inform. 2019;49:69–76.
48. Gleiss AC, et al. Convergent evolution in locomotory patterns of flying and swimming animals. Nat Commun. 2011;2:352.
49. Noda T, Fujioka K, Fukuda H, Mitamura H, Ichikawa K, Arai N. The influence of body size on the intermittent locomotion of a pelagic schooling fish. Proc R Soc B: Biol Sci. 1832;2016(283):20153019.
50. Gleiss AC, Norman B, Wilson RP. Moved by that sinking feeling: variable diving geometry underlies movement strategies in whale sharks. Funct Ecol. 2011;25(3):595–607.
51. Iosilevskii G, Papastamatiou YP. Relations between morphology, buoyancy and energetics of requiem sharks. R Soc Open Sci. 2016;3(10):160406. 52. Nakamura I, Meyer CG, Sato K. Unexpected positive buoyancy in deep
sea sharks, Hexanchus griseus, and a Echinorhinus cookei. PLoS ONE. 2015;10(6):e0127667.
53. Qasem L, et al. Tri‑axial dynamic acceleration as a proxy for animal energy expenditure; should we be summing values or calculating the vector? PLoS ONE. 2012;7(2):e31187.
54. LeCun Y, Bengio Y, Hinton G. Deep learning. Nature. 2015;521(7553):436. 55. Rosenblatt F. Principles of neurodynamics. perceptrons and the theory of
brain mechanisms. Cornell Aeronautical Lab Inc Buffalo NY1961. 56. Nielsen MA. Neural networks and deep learning. San Francisco: Determi‑
nation press; 2015.
57. Goodfellow I, Bengio Y, Courville A. Deep learning. Cambridge: MIT press; 2016.
58. Nair V, Hinton GE. Rectified linear units improve restricted boltzmann machines. In: Proceedings of the 27th international conference on machine learning (ICML‑10), 2010, pp. 807–14.
59. Kingma DP, Ba J. Adam: a method for stochastic optimization. arXiv preprintarXiv :1412.6980, 2014.
60. Prechelt L. Automatic early stopping using cross validation: quantifying the criteria. Neural Netw. 1998;11(4):761–7.
61. Caruana R, Lawrence S, Giles CL. Overfitting in neural nets: backpropa‑ gation, conjugate gradient, and early stopping. In: Advances in neural information processing systems. 2001, pp. 402–08.
62. Srivastava N, Hinton G, Krizhevsky A, Sutskever I, Salakhutdinov R. Drop‑ out: a simple way to prevent neural networks from overfitting. J Mach Learn Res. 2014;15(1):1929–58.
63. Breiman L. Random forests. Mach Learn. 2001;45(1):5–32. 64. Friedman JH. Greedy function approximation: a gradient boosting
machine. Ann Stat. 2001;1:1189–232.
65. Suykens JA, Vandewalle J. Least squares support vector machine classi‑ fiers. Neural Process Lett. 1999;9(3):293–300.
66. Peters DP, Havstad KM, Cushing J, Tweedie C, Fuentes O, Villanueva‑ Rosales N. Harnessing the power of big data: infusing the scientific method with machine learning to transform ecology. Ecosphere. 2014;5(6):1–15.
67. Crisci C, Ghattas B, Perera G. A review of supervised machine learn‑ ing algorithms and their applications to ecological data. Ecol Model. 2012;240:113–22.
68. Cutler DR, et al. Random forests for classification in ecology. Ecology. 2007;88(11):2783–92.
69. Hastie T, Tibshirani R, Friedman J. The elements of statistical learning. New York: Springer; 2009.
70. Drucker H, Burges CJ, Kaufman L, Smola AJ, Vapnik V. Support vector regression machines. In: Advances in neural information processing systems. 1997, p. 155–61.
71. Tang C, Garreau D, von Luxburg U. When do random forests fail? In: Advances in neural information processing systems. 2018. p. 2987–97. 72. Najafabadi MM, Villanustre F, Khoshgoftaar TM, Seliya N, Wald R,
Muharemagic E. Deep learning applications and challenges in big data analytics. J Big Data. 2015;2(1):1.
73. Gleiss AC, Potvin J, Goldbogen JA. Physical trade‑offs shape the evolution of buoyancy control in sharks. Proc R Soc B: Biol Sci. 1866;2017(284):20171345.
74. Weihs D, Keyes RS, Stalls DM. Voluntary swimming speeds of two species of large carcharhinid sharks. Copeia. 1981;1981(1):219–22.
75. Bishop CM. Pattern recognition and machine learning.
76. Jorgensen SJ, et al. In the belly of the beast: resolving stomach tag data to link temperature, acceleration and feeding in white sharks ( Carcharo-don carcharias). Anim Biotelem. 2015;3(1):52.
77. Jorgensen SJ, et al. Eating or meeting? Cluster analysis reveals intricacies of white shark (Carcharodon carcharias) migration and offshore behavior. PLoS ONE. 2012;7(10):e47819.
78. Raye G, Jorgensen SJ, Krumhansl K, Ezcurra JM, Block BA. Travel‑ ling light: white sharks (Carcharodon carcharias) rely on body lipid stores to power ocean‑basin scale migration. Proc R Soc B: Biol Sci. 2013;280(1766):20130836.
79. Larochelle H, Erhan D, Courville A, Bergstra J, Bengio Y. An empirical evaluation of deep architectures on problems with many factors of vari‑ ation. In: Proceedings of the 24th international conference on Machine learning. ACM; 2007, p. 473–80.
80. Bergstra J, Bengio Y. Random search for hyper‑parameter optimization. J Mach Learn Res. 2012;13:281–305.
81. Yosinski J, Clune J, Bengio Y, Lipson H. How transferable are features in deep neural networks? In: Advances in neural information processing systems, 2014, p. 3320–8.
82. Oquab M, Bottou L, Laptev I, Sivic J. Learning and transferring mid‑level image representations using convolutional neural networks. In: Proceed‑ ings of the IEEE conference on computer vision and pattern recognition, 2014, p. 1717–24.
•fast, convenient online submission •
thorough peer review by experienced researchers in your field • rapid publication on acceptance
• support for research data, including large and complex data types •
gold Open Access which fosters wider collaboration and increased citations maximum visibility for your research: over 100M website views per year •
At BMC, research is always in progress.
Learn more biomedcentral.com/submissions
Ready to submit your research? Choose BMC and benefit from:
SB. Energy landscapes shape animal movement ecology. Am Nat. 2013;182(3):298–312.
85. Wilson RP, Quintana F, Hobson VJ. Construction of energy landscapes can clarify the movement and distribution of foraging animals. Proc R Soc B: Biol Sci. 2011;279(1730):975–80.
86. Hochreiter S, Schmidhuber J. LSTM can solve hard long time lag prob‑ lems. In: Advances in neural information processing systems. 1997. p. 473–9.
87. Zaremba W, Sutskever I, Vinyals O. Recurrent neural network regulariza‑ tion. arXiv preprintarXiv :1409.2329, 2014.
88. Luong MT, Pham H, Manning CD. Effective approaches to attention‑ based neural machine translation. arXiv preprintarXiv :1508.04025 , 2015. 89. Greff K, Srivastava RK, Koutník J, Steunebrink BR, Schmidhuber J.
LSTM: a search space odyssey. IEEE Trans Neural Netw Learn Syst. 2017;28(10):2222–32.
animal behaviour using deep learning: GPS data alone accurately predict diving in seabirds. Methods Ecol Evol. 2018;9(3):681–92.
91. Valletta JJ, Torney C, Kings M, Thornton A, Madden J. Applications of machine learning in animal behaviour studies. Anim Behav. 2017;124:203–20.
Publisher’s Note