Article
Accelerating a Technology Commercialization; with a
Discussion on the Relation between Technology
Transfer E
ffi
ciency and Open Innovation
Wahyudi Sutopo1,* , Rina Wiji Astuti2and Retno Tanding Suryandari3
1 Research Group of Industrial Engineering and Techno-Economic, Department of Industrial Engineering,
Universitas Sebelas Maret, Surakarta 57125, Indonesia
2 Teaching Factory of LFP Battery Universitas Sebelas Maret, Surakarta 57125, Indonesia; [email protected] 3 Department of Management, Universitas Sebelas Maret, Surakarta 57125, Indonesia;
* Correspondence: [email protected]
Received: 19 September 2019; Accepted: 19 November 2019; Published: 22 November 2019
Abstract:Commercialization strategy is an all-encompassing plan that organizes technology transfer office goals to commercialize a university’s technologies. Measurement strategy requires feasible variables that make up those goals. This strategy also ensures that all variables that are important in measuring contribute to the larger goals. A useful way to assess and explain the effectiveness of the technology transfer office (TTO) of universities is to model this within a production function/frontier framework. Such a production function is typically estimated econometrically. This study presents evidence on the relative efficiency of research commercialization in the university through the data envelopment analysis (DEA) model. The implication of the DEA efficiency result is to derive the efficiency level of the TTO’s strategy from the observed performance. It also helps in identifying the benchmarking of other TTOs, which would be valuable information for improving their new technology commercialization strategy. In detail, a benchmark is provided to improve the weakness of strategy and resource allocation of a poorly performing TTO. The proposed matrix of indicators is an exploit of how performance could be measured within the decision-making units that have been chosen. By introducing the measure to commercialization strategy framework the development of technology transfer offices policies are considered.
Keywords: data envelopment analysis (DEA); efficiency strategy; performance measurement; technology commercialization; technology transfer office (TTO)
1. Introduction
The shifting paradigm in university can be spotted from the difference between the goal achievement that should be taken then and now [1]. In the past, universities were aiming to achieve goals compiled in the Three Pillars of Higher Education, which are education and teaching, research and development, and public services. On the other hand, the university’s new paradigm is recently dynamically developing. In addition to obligating the Three Pillars of Higher Education, universities are also obligated to conduct some actions in autonomy status enhancement, economic development, and research output commercialization in order to improve the quality and competitiveness of a university in both national and international scope [2]. Every university has its vision, mission, and financial management in conducting an obligation to commercialize their research output. Universities are aiming to take a more active role in developing domestic economy power by participating in the development of science and technology-based business and industry to accelerate the commercialization of new technologies and promote economic development.
Technology commercialization is a means to exploit technology resulted from research in either production or consumption activity so that the researcher can gain profit from the activity [3,4]. In most cases, many technology products resulting from research happened to fail to be launched to the market due to the valley of death [5]. This obstacle usually occurs in the transition process between technology development and technology commercialization. Hence, critical action is needed to accelerate the technology commercialization in order to ensure the commercialization potency of research output does not fall into the valley of death. A university is expected to take part in this process in order to accelerate the transfer of new technology products to the market [6,7].
As a result of this legislation, almost all research universities in the world established technology transfer offices (TTOs) to manage new technology commercialization [8–14]. A technology transfer office (TTO) is a kind of organization to assist research organizations in managing their intellectual assets in ways that facilitate their transformation into a benefit for society [15]. The general roles of TTO include establishing relationship with firms and community actors, generating new funding support from sponsored research or consulting opportunities, providing assistance on all areas related to entrepreneurship and intellectual property (IP), facilitating the formation of university-connected companies utilizing university’s technology (start-up) and/or university resource (spin-off) to enhance prospect or further development and generating net royalties for the university’s technology and collaborating partner. Strategies for commercializing university technology are formulated by the technology transfer office (TTO). Strategies that can be done by the TTO in carrying out its role, among others, are to have the physical facilities to support technology commercialization, mentoring and coaching activities, marketing, and business networking, financial support, and internal university regulation itself. The efficiency of strategies that have been executed by the technology transfer office (TTO) in each university needs to be measured. As an attempt, a performance measurement method that can provide university efficiency information is required. The efficiency measurement result can be later used as a reference for other higher education institutions to formulate strategies regarding the commercialization strategy of research output.
Universitas Sebelas Maret (UNS) is one of the universities in Indonesia that has established a technology transfer office (TTO) to manage research products produced by academics from universities. One technology product that has been developed by the university is a lithium LiFePO4(LFP battery).
Some of the research that has been produced include References [16–18]. The university’s TTO has a business unit to produce and commercialize LFP batteries. The business unit has not been pioneered recently, therefore the TTO is still making continuous improvements to commercialize the product optimally so that it can compete in the market, and the technology product does not fall into the valley of death. In this study, we developed a framework to measure the efficiency of technology commercialization strategies from TTOs at four universities in Indonesia. The measurement results can be used as a benchmark to develop the best strategy for commercializing LFP batteries as a result of university research.
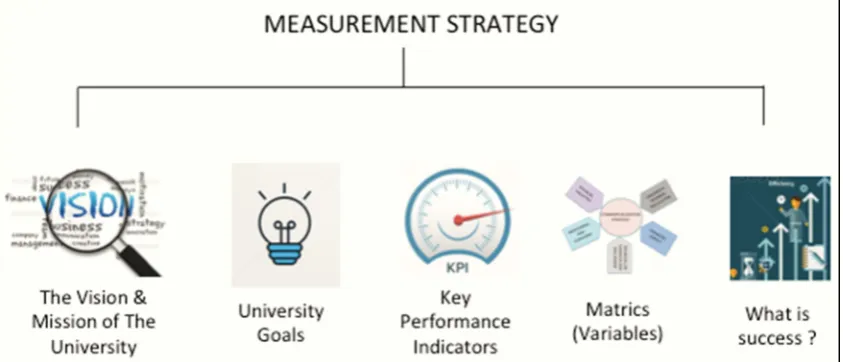
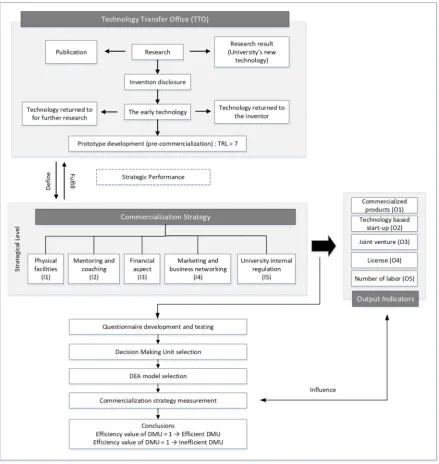
A measurement strategy is an all-encompassing plan that organizes technology transfer office goals to commercialize university’s technologies and how it will be measured (Figure1).
Measurement strategy requires feasible variables that make up those goals. This strategy also ensures that all-important variables in measuring contribute to the larger goals. A useful way to assess and explain the effectiveness of a TTO is to model this within a production function/frontier framework. Such a production function is typically estimated econometrically. Production frontiers are also estimated using nonparametric models, which offer some advantages, relative to the parametric approach. For instance, these methods obviate the need to specify a functional form for the production frontier and also enable us to identify “best practice” technology transfer offices. Nonparametric techniques can also handle multiple outputs.
office and is connected to the overall university strategy. The performance measurement system for the commercialization strategy begins with the university strategy input and the grouping of roles. The roles grouping is based on the goals that exist for a unit within the university. Based on the grouping and the requirements of stakeholders, two types of objectives can be distinguished, namely business objectives and objectives regarding the key performance drivers [20]. Objectives regarding the key performance drivers address how the university objectives are to be met in more detail. These objectives can also address changes in the value creation process or the overall technology transfer office set-up. Once the objectives are defined, the actual definition of performance measures and performance measurement itself can begin [21].
J. Open Innov. Technol. Mark. Complex. 2019, 5, x FOR PEER REVIEW 3 of 28
Figure 1. Measurement strategy.
Measurement strategy requires feasible variables that make up those goals. This strategy also ensures that all-important variables in measuring contribute to the larger goals. A useful way to assess and explain the effectiveness of a TTO is to model this within a production function/frontier framework. Such a production function is typically estimated econometrically. Production frontiers are also estimated using nonparametric models, which offer some advantages, relative to the parametric approach. For instance, these methods obviate the need to specify a functional form for the production frontier and also enable us to identify “best practice” technology transfer offices. Nonparametric techniques can also handle multiple outputs.
Performance measurement is a structured process through which a technology transfer office identifies, measures, and monitors essential programs, systems, and processes [19]. A commercialization strategy is the strategy revolving around the commercialization function of the technology transfer office and is connected to the overall university strategy. The performance measurement system for the commercialization strategy begins with the university strategy input and the grouping of roles. The roles grouping is based on the goals that exist for a unit within the university. Based on the grouping and the requirements of stakeholders, two types of objectives can be distinguished, namely business objectives and objectives regarding the key performance drivers [20]. Objectives regarding the key performance drivers address how the university objectives are to be met in more detail. These objectives can also address changes in the value creation process or the overall technology transfer office set-up. Once the objectives are defined, the actual definition of performance measures and performance measurement itself can begin [21].
Strategy, in general, is “a pattern in a stream of actions.” A strategy is understood as a statement and realization of pre-defined actions as well as involved consistencies in action [22]. A strategy needs to be deliberately implemented before it becomes a realized strategy. The research focus is the intended strategy and its translation is the realization. The development of performance measurement with its various sub-streams and aspects has grown to be increasingly complex. It will continue to grow in complexity as the scope of performance becomes increasingly diverse [23]. The result of performance measurement should be focused on learning and understanding rather than sole control and depends on an understanding of the own era of the university and its stakeholders [24]. Performance measurement gives recommendations about building blocks for commercialization strategy. They can be split up into recommendations for performance measures and recommendations for performance measurement framework and system design [25]. The development and implementation of measuring the efficiency of strategies for commercializing university technology have provided guidelines for efficiency judgment measurement; they are the commercialized product, technology-based start-up, joint venture, license, and increased employment.
Figure 1.Measurement strategy.
Strategy, in general, is “a pattern in a stream of actions”. A strategy is understood as a statement and realization of pre-defined actions as well as involved consistencies in action [22]. A strategy needs to be deliberately implemented before it becomes a realized strategy. The research focus is the intended strategy and its translation is the realization. The development of performance measurement with its various sub-streams and aspects has grown to be increasingly complex. It will continue to grow in complexity as the scope of performance becomes increasingly diverse [23]. The result of performance measurement should be focused on learning and understanding rather than sole control and depends on an understanding of the own era of the university and its stakeholders [24]. Performance measurement gives recommendations about building blocks for commercialization strategy. They can be split up into recommendations for performance measures and recommendations for performance measurement framework and system design [25]. The development and implementation of measuring the efficiency of strategies for commercializing university technology have provided guidelines for efficiency judgment measurement; they are the commercialized product, technology-based start-up, joint venture, license, and increased employment.
Regarding commercialization strategy, goals for efficiency and the entire commercialization process are derived from the overall strategy and the commercialization function environment. Therefore, the performance measurement of commercialization strategy is defined as the degree of fulfillment of the commercialization strategy set for the technology transfer office in the university while considering the influence of contextual output measurement.
(DMUs) based on multi-criteria (input and output). Decision-making units (DMUs) are a group of entities that will be analyzed. Due to the comparison principle, a DMU must have the same goal and target as well as universal input and output [28]. This method works by determining an efficient DMU according to input and output criteria, then calculating relative efficiency from a respective DMU towards an efficient DMU.
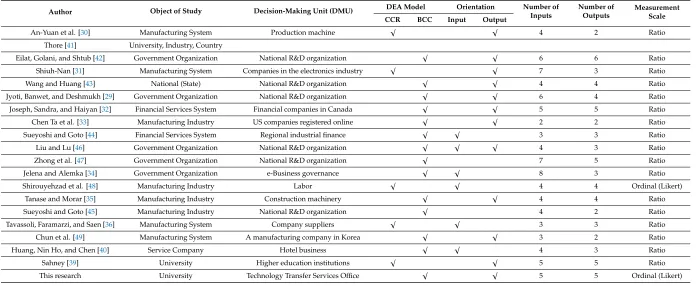
Several research models have been developed for performance measurement by using data envelopment analysis (DEA) as used by Jyoti, Banwet and Deshmukh [29] to measure relative efficiency from a public research organization. A similar study has been conducted by An-Yuan et al. [30] discussing the approach of production flexibility measurement. A study has been performed about the utilization of DEA in the electronic industry performance measurement in Taiwan [31]. The data envelopment analysis (DEA) method is also used in a study conducted by Joseph, Sandra, and Haiyan [32] related to bank merger efficiency in the national scope. While Chen-Ta et al. [33] conduct performance measurement research using DEA application to measure stock performance, Jelena and Alemka [34] have another study discussing government performance measurement in the Republic of Croatia by using data envelopment analysis.
Meanwhile, Tanase and Morar [35] use DEA to analyze performance in the machinery industry. A study regarding DEA utilization in efficiency and effectiveness measurement of supplier selection was also conducted by Tavassoli, Faramarzi and Saen [36]. Another study is efficiency measurement using time-series by Silva et al. [37]. Research by Jian and Dai [38] use the DEA method to measure the efficiency with output uncertainty. A comparison study was conducted by Sahney [39], which talks about the performance measurement of a university in India while Huang, Nin Ho, and Chen [40] measure the efficiency of marketing strategy in Taiwan. Thore [41] study the use of DEA analysis methods in the process of innovation and commercialization in the scope of industry, universities, and countries. Eilat, Golani and Shtub [42] propose and demonstrate an efficient, effective, and balanced methodology for the development and analysis of R&D projects. Wang and Huang [43] evaluated the relative efficiency of R&D activities in several countries. Sueyoshi and Goto [44] integrate DEA and discriminant analysis to test whether R&D expenditures affect industry financial performance, and years later, they assess the importance of R&D expenditures in the information technology industry in Japan [45]. Liu and Lu [46] introduce a network-based approach, which is a new method to increase discriminants in DEA. Zhong et al. [47] evaluate the relative efficiency of 30 regional R&D investments, and Shirouyehzad et al. [48] employ the DEA method to measure labor efficiency while Chun et al. [49] analyze the productivity of R&D and commercialization activities at the company level.
This paper presents a framework for measuring the efficiency of strategy for commercializing a university’s technology. We linked strategy to commercialize the university’s new technology and strategic conditions facing a university. The framework gives a contribution to how commercialization strategy in a university that is supported by the technology transfer office must be measured. Our analysis has suggested how to choose an efficient strategy for the technology transfer office to commercialize a university’s technology.
2. Literature Review
In Section1, we have discussed the background of this study and the factors that might affect commercializing research outputs in university. In Section2, we give a literature review. In Section3, we discuss an approach to develop, and then in Section4results and in Section5discussion. In the final section, we describe the Conclusions and Implications.
2.1. University Paradigm
university can be seen either elitist, royal, aristocrats, or bureaucrats [50]. In the 1890s, university took a role as a studying place for the public, then shifted in the 1930s, and eventually, after World War II became a research center [1]. In the 1990s–2000s universities added entrepreneurial value inside, and nowadays, higher education in Korea, India, and China call themselves agents of change [2].
The new university paradigm is seen from three roles of a university, which are education—teaching and learning activity which produce educated human resources, research, and public service-transfer of science and technology from university to community interest [51]. Meanwhile, the future paradigm in a university that is dynamically shifting possesses not only the Three Pillars of University but also autonomy status, economic development, and commercialization of research output in a university. By fulfilling those aspects, universities are expected to increase cooperation with industry, technology transfer as a university revenue source, and development of entrepreneurs, which is purposing to the downstream research output of the university.
2.2. Technology Commercialization
Nlemvo [52] stated that commercialization consists of design, development, manufacturing, startup marketing phase, and everything regarding product development. While Siegel and Marconi [53] argued that commercialization is an activity to transform and set technology to the beneficial or profitable point. Shane and Stuart [54] also define that commercialization involves identification of consumer need, product concept design, product design, and prototyping process until the manufacturing process in the end. Parker and Mainelli [55] mention two points where the technology may generate profit. The first commercialization encounter is when technology invented from scientific research succeeds in creating a license. The second phase happens when technology is transformed or applied in a particular product through product development activity in a company so that it can be used in advanced production or consumption activity.
2.3. How Does Research Output Commercialization Become So Urgent?
Commercialization of technology or research output can be described as an activity to bring new technology from the inventor’s institution to market (in product or service form). New technology commercialization is defined as “change the idea to money”. The transfer of new technology to market can be executed by the institution/company itself or other party or the inventor’s institution cooperating with another party. Money earned from technology commercialization is intended to ensure the sustainability of the product and service production, which exploit the technology. In other words, the utilization of a particular technology that is not beneficial will not be able to produce a sustainable product and service. As a result, various subsidy programs provided for a particular program or activity will not be sustainable.
2.4. Technology Transfer Office (TTO) Role in Commercialization
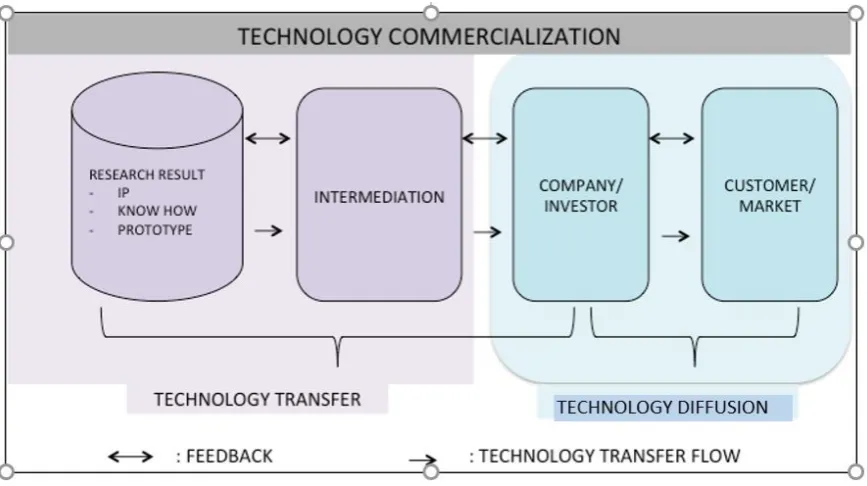
Understanding of technology commercialization route can be beneficial for an organization with the primary function of commercializing new technology, also known as a technology transfer office (TTO). For instance, that scheme can be a planned financial power source and human resource in the future strategy. The intellectual properties (IP) commercialization process of R&D institutions, as illustrated in Figure2, shows the presence of an institutionalized commercialization process or activity scheme. Through these TTOs, IP can be given a commercialization facility by receiving complete help from the institution. This commercialization process also necessitates researchers to reveal their potential research output so that its IP will be protected and will leverage the institution’s IP portfolio. The portfolio will be evaluated afterward by a team in a technology transfer or commercialization office in order to program the commercialization plan and required budget or investment allocation. The commercialization route indicates that the establishment of a new commercialized technology-based startup can be one of the commercialization targets itself besides the number of licenses.J. Open Innov. Technol. Mark. Complex. 2019, 5, x FOR PEER REVIEW 7 of 28
Figure 2. Science–technology transfer and innovation diffusion process.
2.5. Performance Measurement
Performance measurement is a quantifying process of efficiency and effectiveness of a particular action [62]. Effectiveness represents how much the targeted goals have been achieved. Meanwhile, efficiency refers to the speed of doing a task or how a budget can adequately cover the task. Poister [63] defines performance measurement as a process to define, monitor, and use an objective indicator of organization performance. Following the definition, the performance measurement process involves activity in determining, defining, and using indicators to monitor an organization’s performance. Monitoring is used to figure out how effective and efficient an organization is in achieving its goals.
Performance measurement is a medium to improve organization performance. An organization applying a performance measurement is likely to possess better performance rather than an organization which is not [64]. Due to performance measurement, organizations can monitor improvement and motivate themselves to obtain their goals. According to Moxham [65], performance measurement is seen as a tool to get improvement in the public service sector and an essential factor in the reformation of that sector.
2.6. Data Envelopment Analysis (DEA)
Data envelopment analysis (DEA) is a method of linear-based programming to evaluate the efficiency of organization unit performance, also known as decision-making units (DMUs) [66]. A DMU can be a group of firms, departments, divisions, or administrative units with a common goal and target as well as the input and output [28]. DEA aims to measures how efficient a DMU is using its resources in producing several outputs [67].
Data envelopment analysis (DEA) has two basic models, which are the Charnes, Cooper, and Rhodes (CCR) model and Banker, Charnes, and Cooper (BCC) model. By its name, the CCR model is developed by Charnes, Cooper, and Rhodes [67], while the BCC model is constructed by Banker, Charnes, and Cooper [68]. The two models differ in assumption. The CCR model assumes that increasing the input value will impact the output value proportionally, in other words: constant return to scale. Therefore, the output and input ratio will always be constant. Unlike the CCR model, the BCC model assumes that the increase of input value will impact in increasing an output value disproportionately or variably. Hence, increasing the input of “x” times does not always mean
Figure 2.Science–technology transfer and innovation diffusion process.
There is a need for intermediation between a technology owner and user or other parties that tend to produce a product and service from the technology, as seen in Figure2. The role of a TTO in the technology transfer process is very determining. The TTO must audit the new technology as an attempt to spot the commercial prospect. Whenever a technology requires proof of concept activity so that the product can be accepted in the market, the TTO provides accompaniment and mentoring suited to the TTO and experts specializing in the scope of its network.
2.5. Performance Measurement
Performance measurement is a medium to improve organization performance. An organization applying a performance measurement is likely to possess better performance rather than an organization which is not [64]. Due to performance measurement, organizations can monitor improvement and motivate themselves to obtain their goals. According to Moxham [65], performance measurement is seen as a tool to get improvement in the public service sector and an essential factor in the reformation of that sector.
2.6. Data Envelopment Analysis (DEA)
Data envelopment analysis (DEA) is a method of linear-based programming to evaluate the efficiency of organization unit performance, also known as decision-making units (DMUs) [66]. A DMU can be a group of firms, departments, divisions, or administrative units with a common goal and target as well as the input and output [28]. DEA aims to measures how efficient a DMU is using its resources in producing several outputs [67].
Data envelopment analysis (DEA) has two basic models, which are the Charnes, Cooper, and Rhodes (CCR) model and Banker, Charnes, and Cooper (BCC) model. By its name, the CCR model is developed by Charnes, Cooper, and Rhodes [67], while the BCC model is constructed by Banker, Charnes, and Cooper [68]. The two models differ in assumption. The CCR model assumes that increasing the input value will impact the output value proportionally, in other words: constant return to scale. Therefore, the output and input ratio will always be constant. Unlike the CCR model, the BCC model assumes that the increase of input value will impact in increasing an output value disproportionately or variably. Hence, increasing the input of “x” times does not always mean increasing output by the same amount but may be larger or smaller. This assumption called variable return to scale (VRS). Both the DEA model can be used for either input or output orientation.
Table1presents 20 studies that use the DEA method to measure relative efficiency. The study collation was carried out by author-based mapping. The object of the studies include manufacturing systems, manufacturing industries, government organizations, national (state), financial services systems, and universities. Then the mapping was based on the type of DMU used in the study, the DEA model and orientation used in the study, the number of inputs and outputs studied, and the type of data scale used in the study. Based on those studies, no research measured the efficiency of technology transfer service offices, and no research used ordinal data measurement scales in the form of a Likert scale. The Likert scale used in this study aimed to determine the perception of the efficiency of technology commercialization strategies in universities.
3. Approach to Develop Framework
Performance evaluation is a necessary part of management control. Not only can it be used as a reference in decision making but it also the basis of any improvement. Hence, how to measure performance becomes essential. Stakeholders and other researchers have tried to accurately measure the performance at the individual, organizational, and national levels for many decades. This paper illustrates how to use a data envelopment analysis (DEA) to give relative efficiency value for every commercialization strategy that was used by the university. These issues are discussed in this paper:
1. What is the framework of the university efficiency strategy measurement in new technology commercialization?
2. What is the relative strategic efficiency of new technology commercialization performance, and which technology transfer office has an improvement in strategic performance?
Table 1.State of the art of this research.
Author Object of Study Decision-Making Unit (DMU) DEA Model Orientation Number of
Inputs
Number of Outputs
Measurement Scale
CCR BCC Input Output
An-Yuan et al. [30] Manufacturing System Production machine √ √ 4 2 Ratio
Thore [41] University, Industry, Country
Eilat, Golani, and Shtub [42] Government Organization National R&D organization √ √ 6 6 Ratio
Shiuh-Nan [31] Manufacturing System Companies in the electronics industry √ √ 7 3 Ratio
Wang and Huang [43] National (State) National R&D organization √ √ 4 4 Ratio
Jyoti, Banwet, and Deshmukh [29] Government Organization National R&D organization √ √ 6 4 Ratio Joseph, Sandra, and Haiyan [32] Financial Services System Financial companies in Canada √ √ 5 5 Ratio
Chen Ta et al. [33] Manufacturing Industry US companies registered online √ √ 2 2 Ratio
Sueyoshi and Goto [44] Financial Services System Regional industrial finance √ √ 3 3 Ratio
Liu and Lu [46] Government Organization National R&D organization √ √ √ 4 3 Ratio
Zhong et al. [47] Government Organization National R&D organization √ 7 5 Ratio
Jelena and Alemka [34] Government Organization e-Business governance √ √ 8 3 Ratio
Shirouyehzad et al. [48] Manufacturing Industry Labor √ √ 4 4 Ordinal (Likert)
Tanase and Morar [35] Manufacturing Industry Construction machinery √ √ 4 4 Ratio
Sueyoshi and Goto [45] Manufacturing Industry National R&D organization √ 4 2 Ratio
Tavassoli, Faramarzi, and Saen [36] Manufacturing System Company suppliers √ √ 3 3 Ratio
Chun et al. [49] Manufacturing System A manufacturing company in Korea √ √ 3 2 Ratio
Huang, Nin Ho, and Chen [40] Service Company Hotel business √ √ 4 3 Ratio
Sahney [39] University Higher education institutions √ √ 5 5 Ratio
3.1. Defining the Structural Framework
Both previous findings as well as insights from the commercialization strategic efficiency variables, dimension, objectives, and target (output) are to be derived from strategy. Strategy measurement can be described as the degree to which a strategy has been fulfilled. Therefore, strategy measurement dimensions for commercialization strategy need to be derived from university strategy. The university strategy for commercialization strategy contains five main dimensions for input strategy and five main dimensions for output.
We developed the model using a questionnaire as a measurement instrument. The use of a Likert scale in the questionnaire could be applied using the DEA method in terms of the ability of DEA to calculate the value of relative efficiency. This questionnaire aimed to determine the relative efficiency value of a commercialization strategy of the results of the research carried out in each DMU and to test the correlation between variables used in this study. The preparation of the questionnaire in this study began with the operationalization of input variables, namely by identifying the strategies that influence the success of technology commercialization according to literature studies. Then, we proceeded with determining the indicators of each variable and translating the indicators into statement forms that were easy to understand respondent. It was vital to check statements form, language, and relevance, the order of statements, and the appearance of the questionnaire. Finally, we conducted a pre-test and made a final draft questionnaire.
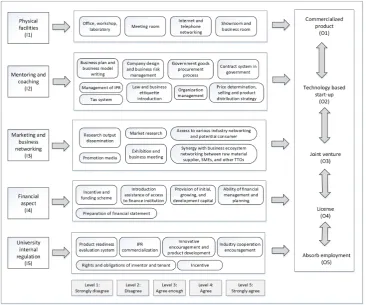
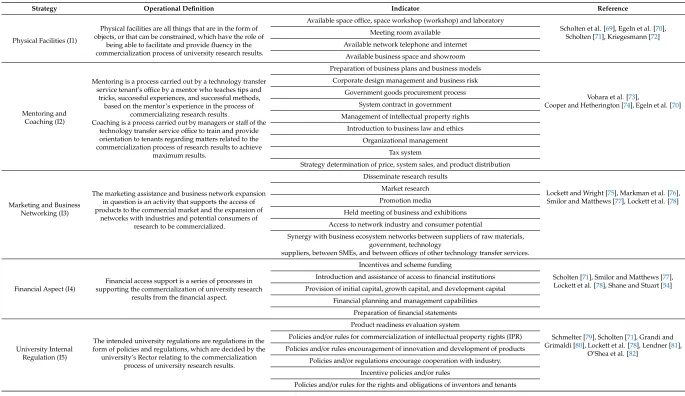
The statements in the questionnaire were based on the variables used in the study. Then the indicators that affected each variable were identified. Indicators are measures, which are things that represent the value of a variable. The indicators in this study were collected based on literature studies and field studies that were conducted to see the similarity of the required inputs and outputs produced by all DMUs, then compiled into statements that were asked to respondents. The identification of variables and indicators for each strategy can be seen in Table2for the input strategy and Table3for the output strategy, and the overall system picture is explained in Figure3.
J. Open Innov. Technol. Mark. Complex. 2019, 5, x FOR PEER REVIEW 12 of 28
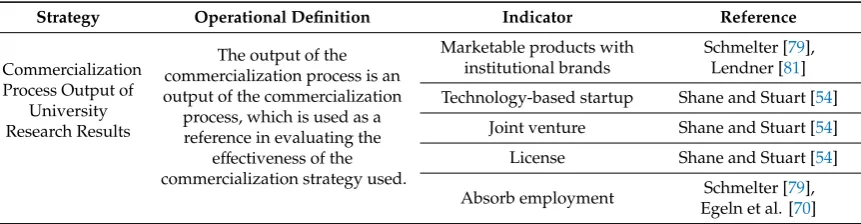
Table 3. Operationalization of output variables and identification of indicators.
Strategy Operational
Definition Indicator Reference
Commercialization Process Output of University Research
Results
The output of the commercialization process is an output
of the commercialization
process, which is used as a reference in
evaluating the effectiveness of the
commercialization strategy used.
Marketable products with institutional brands
Schmelter [79], Lendner [81]
Technology-based startup Shane and Stuart [54] Joint venture Shane and Stuart [54] License Shane and Stuart [54]
Absorb employment Schmelter [79], Egeln et al. [70]
Our research model is shown in Figure 3. Inputs included physical facilities, mentoring and coaching, marketing and business networking, financial aspect, and a university’s internal regulation. All these five inputs are vital components of technology commercialization activities. Although there are many possible indicators which can measure the technology commercialization, this study used license income as our primary indicator for evaluating technology commercialization according to the suggestion of Trune and Goslin [83], Jensen and Thursby [84], and Thursby and Thursby [85].
Figure 3. Commercialization strategy framework.
Table 2.Operationalization of input variables and identification of indicators.
Strategy Operational Definition Indicator Reference
Physical Facilities (I1)
Physical facilities are all things that are in the form of objects, or that can be constrained, which have the role of
being able to facilitate and provide fluency in the commercialization process of university research results.
Available space office, space workshop (workshop) and laboratory
Scholten et al. [69], Egeln et al. [70], Scholten [71], Kriegesmann [72] Meeting room available
Available network telephone and internet Available business space and showroom
Mentoring and Coaching (I2)
Mentoring is a process carried out by a technology transfer service tenant’s office by a mentor who teaches tips and
tricks, successful experiences, and successful methods, based on the mentor’s experience in the process of
commercializing research results.
Coaching is a process carried out by managers or staffof the technology transfer service office to train and provide orientation to tenants regarding matters related to the commercialization process of research results to achieve
maximum results.
Preparation of business plans and business models
Vohara et al. [73],
Cooper and Hetherington [74], Egeln et al. [70] Corporate design management and business risk
Government goods procurement process System contract in government Management of intellectual property rights
Introduction to business law and ethics Organizational management
Tax system
Strategy determination of price, system sales, and product distribution
Marketing and Business Networking (I3)
The marketing assistance and business network expansion in question is an activity that supports the access of products to the commercial market and the expansion of
networks with industries and potential consumers of research to be commercialized.
Disseminate research results
Lockett and Wright [75], Markman et al. [76], Smilor and Matthews [77], Lockett et al. [78] Market research
Promotion media
Held meeting of business and exhibitions Access to network industry and consumer potential
Synergy with business ecosystem networks between suppliers of raw materials, government, technology
suppliers, between SMEs, and between offices of other technology transfer services.
Financial Aspect (I4)
Financial access support is a series of processes in supporting the commercialization of university research
results from the financial aspect.
Incentives and scheme funding
Scholten [71], Smilor and Matthews [77], Lockett et al. [78], Shane and Stuart [54] Introduction and assistance of access to financial institutions
Provision of initial capital, growth capital, and development capital Financial planning and management capabilities
Preparation of financial statements
University Internal Regulation (I5)
The intended university regulations are regulations in the form of policies and regulations, which are decided by the university’s Rector relating to the commercialization
process of university research results.
Product readiness evaluation system
Schmelter [79], Scholten [71], Grandi and Grimaldi [80], Lockett et al. [78], Lendner [81],
O’Shea et al. [82] Policies and/or rules for commercialization of intellectual property rights (IPR)
Policies and/or rules encouragement of innovation and development of products Policies and/or regulations encourage cooperation with industry.
Incentive policies and/or rules
Table 3.Operationalization of output variables and identification of indicators.
Strategy Operational Definition Indicator Reference
Commercialization Process Output of
University Research Results
The output of the commercialization process is an output of the commercialization
process, which is used as a reference in evaluating the
effectiveness of the commercialization strategy used.
Marketable products with institutional brands
Schmelter [79], Lendner [81]
Technology-based startup Shane and Stuart [54]
Joint venture Shane and Stuart [54]
License Shane and Stuart [54]
Absorb employment Schmelter [79],
Egeln et al. [70]
Our research model is shown in Figure3. Inputs included physical facilities, mentoring and coaching, marketing and business networking, financial aspect, and a university’s internal regulation. All these five inputs are vital components of technology commercialization activities. Although there are many possible indicators which can measure the technology commercialization, this study used license income as our primary indicator for evaluating technology commercialization according to the suggestion of Trune and Goslin [83], Jensen and Thursby [84], and Thursby and Thursby [85].
Commercialization activity of university research output has return to scale, which is variable. It means that additional input in commercialization activity will impact in additional output disproportionately. For instance, if mentoring and coaching strategy is managed to become more routine, it does not mean more output will be gained. Therefore, the input and output variable in this research remained unclear or could be seen as a black-box circumstance. Due to this condition, the DEA model chosen in this study was the BCC model, which uses a variable return to scale assumption.
Meanwhile, the DEA model orientation was chosen by considering DMU control ability toward the input and output variable of research output commercialization activity. In the commercialization activity, DMU possesses a larger control of input than output. Hence, this paper used input orientation (input minimization) where efficiency was seen as the subtraction of input number to create the same amount of output.
3.2. Questionnaire Testing
A valid and reliable questionnaire is a necessary condition to obtain valid and reliable results. In this study, we conducted a reliability test and validity test to check the validity and reliability of the questionnaire. We tested the questionnaire with 30 respondents from which the population was the same class as the actual population by using a purposive sampling method.
Questionnaires are considered valid if they can present or measure what they want to measure (research variables). To measure the validity test the SPSS statistical application was used. A question item was considered valid if it had a critical R-value≥0.3 and was considered invalid if the critical R <0.3. All questions on this questionnaire had a critical R-value>0.3. Thus, the questionnaire was
declared valid.
Reliability involves the problem of the accuracy of the measuring instrument. An instrument is considered reliable if the instrument can be trusted as a measurement of research data. This reliability test also used SPSS software, where all question items were considered reliable if the value of the test results was≥0.6 and considered unreliable if the value was<0.6. The reliability value on each
questionnaire variable was>0.6, so the questionnaire was reliable.
3.3. Decision-Making Unit Selection
The DMU was the unit whose efficiency would be measured. With due regard to homogeneity requirements, it was determined that the DMU in this study was the work units of the legal entity university, which was responsible for carrying out the commercialization of research results, from now on, referred to as the technology transfer service office. The said legal entity university, which was at least three years, had the status of a legal entity so that it was expected to have identified the outcome of the commercialization process that had been carried out.
Each university did not necessarily only have one TTO unit. Based on field studies and literature studies, a list of total 25 technology transfer service offices have been obtained at some universities, from now on, referred to as the decision-making unit (DMU). Table4shows the list of technology transfer service offices in each university, which were coded as U1, U2, U3, and U4.
Table 4.List of technology transfer service offices.
No. University Technology Transfer Service Office
1 U1 Business Incubator and Entrepreneurship Development Centre (Incubie)
2 U2 Business Incubator
3 U3 Institute for Innovation and Entrepreneurship Development (LPIK)
4 U4 Directorate of Business Development and Incubation
PT. GKR
Input and output variable data were collected from 2012 to 2016. The selection of this period was based on the concept of incubation, which starts from the results of research that has a value of technology readiness level (TKT)≥7 to being commercially ready and takes 2–3 years to start scaling
up research [87].
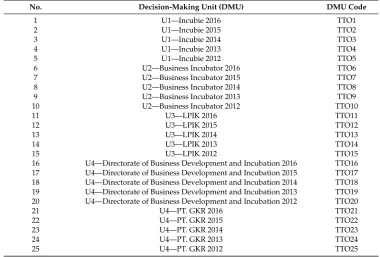
Input and output variable data were collected from questionnaires that had been designed for the managers of each technology transfer service office. The number of DMUs fulfilled the requirements of the number of DMUs submitted by Darrat et al. [88] and Avkiran [89], where the number of DMUs is at least equal to the multiplication of the number of inputs and outputs. In this study, using five inputs and five outputs so that the multiplication obtained gets a value of 25 DMUs. Table5presents the list of DMU codes of each technology transfer service office in each university in the respective period.
Table 5.List of DMU Codes.
No. Decision-Making Unit (DMU) DMU Code
1 U1—Incubie 2016 TTO1
2 U1—Incubie 2015 TTO2
3 U1—Incubie 2014 TTO3
4 U1—Incubie 2013 TTO4
5 U1—Incubie 2012 TTO5
6 U2—Business Incubator 2016 TTO6
7 U2—Business Incubator 2015 TTO7
8 U2—Business Incubator 2014 TTO8
9 U2—Business Incubator 2013 TTO9
10 U2—Business Incubator 2012 TTO10
11 U3—LPIK 2016 TTO11
12 U3—LPIK 2015 TTO12
13 U3—LPIK 2014 TTO13
14 U3—LPIK 2013 TTO14
15 U3—LPIK 2012 TTO15
16 U4—Directorate of Business Development and Incubation 2016 TTO16 17 U4—Directorate of Business Development and Incubation 2015 TTO17 18 U4—Directorate of Business Development and Incubation 2014 TTO18 19 U4—Directorate of Business Development and Incubation 2013 TTO19 20 U4—Directorate of Business Development and Incubation 2012 TTO20
21 U4—PT. GKR 2016 TTO21
22 U4—PT. GKR 2015 TTO22
23 U4—PT. GKR 2014 TTO23
24 U4—PT. GKR 2013 TTO24
3.4. DEA Model Selection
The DEA model selected in this study was a model of BCC, in which this model holds the assumption of variable returns to scale. The DEA model selected orientation concerning the control capabilities of DMU input and output variables of the commercialization of research activities. In this activity, the commercialization of research results, DMU has control over a more massive output. Therefore, this study used the output orientation (maximize input) where efficiency was seen as increasing the number of outputs while the user input number remained the same.
The BCC model also can be used to either maximize output or minimize input. The primal equation of the DEA BCC model to maximize output is shown by Formula (1).
Max Z =
i
X
j=1
vjm yjm + vm (1)
subject to:
PI
i=1uimxim=1
PJ
j=1vjmyjn−
PI
i=1uimxin+ vm≤0
vjm, uim ≥ ε, vm(independent)in f inite. Meanwhile, the primal DEA BCC model to minimize input is:
Min Z =
I
X
i=1
uimxim + um (2)
subject to:
PJ
j=1vjmyjm=1
PI
i=1uimxin−
PJ
j=1vjmyjn+ um≥0
vjm, uim ≥ ε, um(independent)in f inite.
The equation in dual form from the primal model to maximize output is shown by Formula (3).
Minθm (3)
subject to:
PN
n=1λn yjn≥yjm
PN
n=1λnxin ≤ θmxim
PN
n=1λn =1 λn≥0
θm(independent)in f inite.
Meanwhile, the dual equation from the primal model to minimize input is shown in Formula (4).
Maxφm (4)
subject to:
PN
n=1µnyjn≥φmyjm
PN
n=1µnxin≤ xim
PN
n=1µn =1
µn ≥0
φm(independent)in f inite. wheren: DMU,n=1, 2,. . .,N
j: Output,j=1, 2,. . .,J
yjn: output value ofjfrom DMU ofn
xin: output value ofifrom DMU ofn
vjm: input weightjfrom DMU ofn
yjn: input weightifrom DMU ofn ε: small positive number.
In a linear program, each equation (called primal) has a linear equation in binary form. Formulae (1,2) are examples of the primal equation. The number of constraint equations (subject to) in the primal equation depends on the DMU number. However, in the dual equation, the constraint equation (subject to) number depends on the variable number [49]. In the dual equation, variableθis a constraint equation (equality constraint), which is a result of normalization of the total weight from the input, while variableλ is a dual variable, which is an inequality constraint from the primal. The dual equation from the primal to maximize output is shown in Formula (3).
3.5. DEA with Likert Scale Data
The DEA basic model assumes that all input and output variables can be moved/changed freely. In the case of performance evaluation of new product launching as discussed here, all the input and output variables contained the survey data that used a scale of 1–5. This brought the consequence that the recommendation value of improvements both for input and output variables cannot exceed the range of values 1–5. If we wanted to evaluate the performance/efficiency data-limited scale of the questionnaire, the standard model of DEA above should have been transformed into an exclusive model with some differences in character compared to the general model. The mathematical expressions include the additional constraints of Formulae (2,4), which limits the scale value that may be acquired by a DMU. Hence, it will limit the movement of input and output as mathematical processing will be restricted from the smallest value of a certain number with the highest possible value.
The data used in this study was obtained through a questionnaire. Respondents were asked to assess the research results in the commercialization strategy where respondents worked. The maximum scale value of the questionnaire, which was five, was treated as the upper limit, and the minimum one, which was one, was be treated as a lower limit for the input variable (xij) and output variables (yrj) of each DMU. The DMU in this research was the units from the university who were responsible for implementing the commercialization of research results, from now on referred to as the technology transfer offices (TTO) at universities.
4. Results
4.1. Commercialization Strategy Measurement
After a framework was prepared, then an identification of the business process or workflow of the commercialization process in the university was carried out. Starting from the results of research that had the potential to be commercialized, then the technology transfer service office had a role in carrying out incubation to successfully commercialize research products.
Figure4illustrates the efficiency measurement framework of the strategy commercialization technology in higher education through the process after the characterization of the process of technology commercialization at each university was carried out by the unit transfer service technology. The advanced technology transfer office is a unit of the university which is responsible for the technology commercialization process at each college. The research results of universities are selected by the unit’s technology transfer office services to proceed to the stage of commercialization (Technology Readiness Level (TRL) and Demand Readiness Level (DRL)≥10). Each office of technology transfer services has
J. Open Innov. Technol. Mark. Complex.2019,5, 95 15 of 25
the relative efficiency of each technology transfer service unit to be able to determine an efficient strategy. An efficient TTO was the one which relative efficiency value was equal to one. The relative efficiency was calculated using a mathematical model based on the DEA variable returns to scale (VRS) output-oriented to properly evaluate the efficiency of the production scales of the unit’s best technology transfer services. The VRS primal was used to determine which technology transfer services unit was efficient (=1) and inefficient (<1) and to investigate the value of variable weights whereas the dual VRS was used to find the value scale efficiency (SE). SE grades indicated whether the technology transfer services unit operates optimally or not. It operated in optimal condition if the value of the VRS>SE and did not operate in optimal condition when the value of the VRS<SE.
sold in the market, the establishment of technology-based startup companies, joint ventures, licensing, and employment. Those dimensions were considered to be the input and output of the unit service technology transfer. Then, we calculated the relative efficiency of each technology transfer service unit to be able to determine an efficient strategy. An efficient TTO was the one which relative efficiency value was equal to one. The relative efficiency was calculated using a mathematical model based on the DEA variable returns to scale (VRS) output-oriented to properly evaluate the efficiency of the production scales of the unit’s best technology transfer services. The VRS primal was used to determine which technology transfer services unit was efficient (=1) and inefficient (<1) and to investigate the value of variable weights whereas the dual VRS was used to find the value scale efficiency (SE). SE grades indicated whether the technology transfer services unit operates optimally or not. It operated in optimal condition if the value of the VRS > SE and did not operate in optimal condition when the value of the VRS < SE.
Figure 4. Performance measurement framework of commercialization strategy.
4.2. Relative Efficiency Value
Figure 4.Performance measurement framework of commercialization strategy.
4.2. Relative Efficiency Value
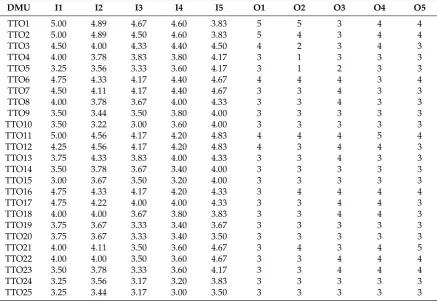
created first to arrange them with the format required by Max DEA. Table6presents the recapitulation result by finding the average value of every indicator data from the questionnaire.
Table 6.Strategy assessment data for respective variable.
DMU I1 I2 I3 I4 I5 O1 O2 O3 O4 O5
TTO1 5.00 4.89 4.67 4.60 3.83 5 5 3 4 4
TTO2 5.00 4.89 4.50 4.60 3.83 5 4 3 4 4
TTO3 4.50 4.00 4.33 4.40 4.50 4 2 3 4 3
TTO4 4.00 3.78 3.83 3.80 4.17 3 1 3 3 3
TTO5 3.25 3.56 3.33 3.60 4.17 3 1 2 3 3
TTO6 4.75 4.33 4.17 4.40 4.67 4 4 4 3 4
TTO7 4.50 4.11 4.17 4.40 4.67 3 3 4 3 3
TTO8 4.00 3.78 3.67 4.00 4.33 3 3 4 3 3
TTO9 3.50 3.44 3.50 3.80 4.00 3 3 3 3 3
TTO10 3.50 3.22 3.00 3.60 4.00 3 3 3 3 3
TTO11 5.00 4.56 4.17 4.20 4.83 4 4 4 5 4
TTO12 4.25 4.56 4.17 4.20 4.83 4 3 4 4 3
TTO13 3.75 4.33 3.83 4.00 4.33 3 3 4 3 3
TTO14 3.50 3.78 3.67 3.40 4.00 3 3 3 3 3
TTO15 3.00 3.67 3.50 3.20 4.00 3 3 3 3 3
TTO16 4.75 4.33 4.17 4.20 4.33 3 4 4 4 4
TTO17 4.75 4.22 4.00 4.00 4.33 3 3 4 4 3
TTO18 4.00 4.00 3.67 3.80 3.83 3 3 4 4 3
TTO19 3.75 3.67 3.33 3.40 3.67 3 3 3 3 3
TTO20 3.75 3.67 3.33 3.40 3.50 3 3 3 3 3
TTO21 4.00 4.11 3.50 3.60 4.67 3 4 3 4 5
TTO22 4.00 4.00 3.50 3.60 4.67 3 3 4 4 4
TTO23 3.50 3.78 3.33 3.60 4.17 3 3 4 4 4
TTO24 3.25 3.56 3.17 3.20 3.83 3 3 3 3 3
TTO25 3.25 3.44 3.17 3.00 3.50 3 3 3 3 3
The mathematical model below is an example of a mathematic model of BCC with input orientation (BCC-O) for DMU1. The model was constructed by using Formula (3) and data from Table6.
Maxθm
subject to:
5λ1+4.75λ2+5λ3+4.75λ4+4λ5≥5
4.89λ1+4.33λ2+4.56λ3+3.33λ4+3.11λ5≥4.89
4.67λ1+4.17λ2+4.17λ3+4.17λ4+3.5λ5≥4.67
4.6λ1+4.4λ2+4.2λ3+4.2λ4+3.6λ5≥4.6
3.83λ1+3.67λ2+4.83λ3+4.33λ4+4.67λ5≥3.83
5λ1+4λ2+4λ3+3λ4+3λ5≤5θ1
5λ1+4λ2+4λ3+4λ4+4λ5≤5θ2
3λ1+4λ2+4λ3+4λ4+3λ5≤3θ3
4λ1+3λ2+5λ3+4λ4+4λ5≤4θ4
4λ1+4λ2+4λ3+4λ4+5λ5≤4θ5
λ1+λ2+λ3+λ4+λ5=1
θm(independent) infinite.
Then, the model was solved with help from Max DEA to discover the DMU relative efficiency value. The other DMU relative efficiency values were calculated using a similar formula. Table7presents the results of DMU relative efficiency calculation in commercializing university research products. The score column represents DMU relative efficiency value, and the rank column shows DMU rank based on relative efficiency value. Meanwhile, the reference set (lambda) column provides information about efficient DMUs, which could be used as a benchmark reference for inefficient DMU along with the intensity.
Table 7.Decision-making units (DMU) relative efficiency value.
DMU Score Rank Reference Set Benchmark (Lambda)
TTO1 1 1 TTO1 1 TTO2 1 1 TTO2 1 TTO3 1 1 TTO3 1
TTO4 0.876436 6 TTO2 0.057896 TTO6 0.182529 TTO10 0.387987 TTO11 0.124633 TTO23 0.115791 TTO25 0.131164 TTO5 0.978437 2 TTO2 0.033058 TTO15 0.264463 TTO23 0.033058 TTO25 0.669421
TTO6 1 1 TTO6 1 TTO7 1 1 TTO7 1 TTO8 1 1 TTO8 1
TTO9 0.965544 3 TTO1 0.053528 TTO10 0.518248 TTO23 0.107056 TTO25 0.321168 TTO10 1 1 TTO10 1
TTO11 1 1 TTO11 1 TTO12 1 1 TTO12 1
TTO13 1 1 TTO17 0.200000 TTO23 0.800000
TTO14 0.92 5 TTO1 0.130435 TTO15 0.173913 TTO23 0.260870 TTO25 0.434783 TTO15 1 1 TTO15 1
TTO16 1 1 TTO16 1
TTO17 1 1 TTO12 0.242424 TTO23 0.757576 TTO18 1 1 TTO18 1
TTO19 0.942677 4 TTO1 0.091214 TTO10 0.035346 TTO23 0.182427 TTO25 0.691013 TTO20 1 1 TTO25 1
TTO21 1 1 TTO21 1 TTO22 1 1 TTO22 1 TTO23 1 1 TTO23 1 TTO24 1 1 TTO24 1 TTO25 1 1 TTO25 1
Data processing using Max DEA produced efficiency values that indicated the relative efficiency values of DMU. This value is relative, so if there was a change in a DMU, the efficiency score may have changed. Efficiency scores range from 0 to 1 (0 to 100%). DMU with an efficiency score equal to 1 was classified into an efficient DMU. This meant that there was no other DMU that could use input with a smaller amount than the DMU based on the same amount of output. An efficient DMU was a DMU that could optimize the strategies used in achieving technology commercialization output by predetermined targets.
The performance of DMUs was assessed in DEA using the concept of efficiency or productivity, which was the ratio of virtual outputs to virtual inputs. Therefore, all outcomes generated from the strategy, which were the profits from the results of DMU operations, were expressed as virtual outputs. In contrast, all resources used by DMU or conditions that affected DMU performance were expressed as virtual inputs. If the ratio value between virtual output and virtual input=1, the DMU was declared efficient. Conversely, if the ratio value was less than 1, the DMU was declared inefficient.
Based on Table7, we determined which DMUs were classified as efficient and inefficient. There were 20 DMUs that were classified as efficient, namely TTO1, TTO2, TTO3, TTO6, TTO7, TTO8, TTO10, TTO11, TTO12, TTO13, TTO15, TTO16, TTO17, TTO18, TTO20, TTO21, TTO22, TTO23, TTO24, and TTO25, whereas five DMUs, namely TTO4, TTO5, TTO9, TTO14, and TTO19, had efficiency values less than one, so they were classified as inefficient DMUs.
5. Discussion
5.1. Strategy Analysis for Improving Research Commercialization in University
J. Open Innov. Technol. Mark. Complex.2019,5, 95 18 of 25
of technology transfer offices could be identified, which produced the same level of output for less than either or both the inputs. Figure5represents the efficiency frontier of five TTOs consuming two inputs. TTO1 held an efficient practice for input I1, whereas TTO3 held the efficient practice input I2. The straight-line representing TTO2 represents the best achievable target performance (corresponding to point A), which was actually a linear combination of the best practice TTO1 and TTO3. TTO4 was an inefficient DMU. The value of input I1 on TTO4 was higher than the value of input I2. Thus, TTO4 referred to TTO1, which was the best practice in input I1. This is illustrated through a straight line that intersects TTO1 at point B. Therefore, to achieve an increase in commercialized output, TTO4 must be able to increase the input values of I1 and I2 by point B.
5. Discussion
5.1. Strategy Analysis for Improving Research Commercialization in University
We considered five technology transfer offices TTO1, TTO2, TTO3, TTO4, TTO5 that produce the same level of a single output O, from two inputs I1 and I2, shown in Figure 5. TTO1 and TTO3 were efficient. They represented the best practice. This implied that no other firm nor linear combination of technology transfer offices could be identified, which produced the same level of output for less than either or both the inputs. Figure 5 represents the efficiency frontier of five TTOs consuming two inputs. TTO1 held an efficient practice for input I1, whereas TTO3 held the efficient practice input I2. The straight-line representing TTO2 represents the best achievable target performance (corresponding to point A), which was actually a linear combination of the best practice TTO1 and TTO3. TTO4 was an inefficient DMU. The value of input I1 on TTO4 was higher than the value of input I2. Thus, TTO4 referred to TTO1, which was the best practice in input I1. This is illustrated through a straight line that intersects TTO1 at point B. Therefore, to achieve an increase in commercialized output, TTO4 must be able to increase the input values of I1 and I2 by point B.
Figure 5. Efficiency frontier of five technology transfer offices consuming two inputs.
The correlation test between variables for 20 efficient DMUs was conducted to see the value of the correlation between input variables and output variables, which would later be used to help determine the strategy formulation. Correlation test was done using SPSS software and using the Kendall Tau correlation test. Table 8 shows the correlation values between variables for 20 efficient DMUs from the Max DEA processing results. It could be derived from the table that all input variables to the output variable had a positive correlation. These results could later be used to design a commercialization strategy based on the output the technology transfer service office at the university focuses on achieving.
Figure 5.Efficiency frontier of five technology transfer offices consuming two inputs.
The correlation test between variables for 20 efficient DMUs was conducted to see the value of the correlation between input variables and output variables, which would later be used to help determine the strategy formulation. Correlation test was done using SPSS software and using the Kendall Tau correlation test. Table8shows the correlation values between variables for 20 efficient DMUs from the Max DEA processing results. It could be derived from the table that all input variables to the output variable had a positive correlation. These results could later be used to design a commercialization strategy based on the output the technology transfer service office at the university focuses on achieving.
Table 8.Correlation value between efficient DMU variables.
Strategy The Commercial
Product (O1)
PPBT (O2)
Joint Venture (O3)
License (O4)
Employment (O5)
Physical Facilities (I1) 0.609 0.480 0.251 0.523 0.260
Mentoring and Coaching (I2) 0.608 0.525 0.300 0.487 0.412
Marketing and Business Networking (I3) 0.680 0.360 0.198 0.399 0.347
Financial Aspect (I4) 0.606 0.354 0.237 0.335 0.255
For universities, this model could be used as a model to measure the efficiency of a strategy that has been carried out then determine the alternative improvement that must be chosen among the five input strategies that exist to achieve the target five outputs that have been determined. This model is also able to provide recommendations for technology transfer service offices in strengthening the strategies that must be taken.
Based on Table8, we could underline which input variables needed to be improved by the university to increase output, for example, if the university wants to focus on improving commercial products what needs to be done is to increase marketing assistance strategies and expand business networks including increasing research dissemination, conducting market research on products to be commercialized, adding to promotional media, holding business meetings and exhibitions, expanding access to various industrial networks and potential consumers, and strengthening synergies with the business ecosystem network. In addition to improving marketing strategies and business networks, it is also necessary to prepare internal college regulations, including regulations on product readiness evaluation systems, commercialization of intellectual property rights, policies, and rules regarding the encouragement of innovation and product development, policies, and or incentive rules. The strategy to increase physical facilities also needs to be improved, including the availability of office space, workshops, meeting rooms, telephone and internet networks as well as available business and showroom spaces.
Whereas if it is more focused on increasing joint ventures, it is necessary to improve the university’s internal regulatory strategy, mentoring and coaching including the preparation of business plans and business models, coaching on management of company design and business risk, contracting systems in government, management of intellectual property rights, introduction to law and business ethics, organizational management, tax systems and mentoring regarding pricing strategies, sales systems and product distribution, and improvement of physical facilities. Likewise, if they want to increase licenses, it is necessary to improve the physical facilities strategy, mentoring and coaching as well as marketing and business networking assistance. In order to increase employment, it is necessary to improve mentoring and coaching strategies, marketing assistance, and business networks as well as formulating internal regulations of the university.
This model is also able to be used for evaluating strategy feedback for the development of technology-based startup companies, including how to improve the university’s internal regulatory strategy which significantly affects the success of technology-based startups in the future, namely the need for support from universities in the formulation of policies on the commercialization of intellectual property rights. In full, the drive for innovation and intensive product development as well as the encouragement of industrial cooperation, then it also needs policy regarding the rules of incentives, as well as an evaluation system for product readiness to be commercialized. Mentoring and coaching strategies also need to be improved in the development of technology-based startup companies, including mentoring and coaching activities in the preparation of business plans and business models, management of company design and business risk, procurement processes, the introduction of legal and business ethics, and tax systems. The state of physical facilities is also very influential in the development of technology-based startup companies, at least available office space, workshops, laboratories, meeting rooms, telephone, and internet networks, as well as available business space and showrooms of research results to be commercialized.
5.2. The Relation between Technology Transfer Efficiency and Open Innovation
J. Open Innov. Technol. Mark. Complex.2019,5, 95 20 of 25
efficient DMUs in transferring technology to synthesize effective strategies. Thus, we could generate a variety of decisions that could be used for technological interventions in terms of physical facilities, mentoring and coaching, marketing and business networking, financial aspects, and university’s internal regulation. The more efficient DMUs, the more best practices we could implement in commercializing new technologies.
introduction of legal and business ethics, and tax systems. The state of physical facilities is also very influential in the development of technology-based startup companies, at least available office space, workshops, laboratories, meeting rooms, telephone, and internet networks, as well as available business space and showrooms of research results to be commercialized.
5.2. The Relation between Technology Transfer Efficiency and Open Innovation
The relationship between technology transfer efficiency and open innovation can be illustrated through the open innovation paradigm in Figure 6. Many new technologies resulted from university research. However, not all of these technology products can develop in the market. Therefore, technology insourcing is needed to accelerate the commercialization of technology, both through internal and external technology bases. In this case, the university plays a role as a technology spinoff, in which there is a TTO in charge of carrying out technology incubation. An efficient DMU will increase the probability of the success of a technology product. Therefore, in our model, we used the DEA model to find efficient DMUs in transferring technology to synthesize effective strategies. Thus, we could generate a variety of decisions that could be used for technological interventions in terms of physical facilities, mentoring and coaching, marketing and business networking, financial aspects, and university’s internal regulation. The more efficient DMUs, the more best practices we could implement in commercializing new technologies.
Figure 6. The open innovation paradigm (sources from Reference [90]).
6. Conclusions and Implications
This paper constructed a framework of university efficiency strategy measurement in new technology commercialization. This framework employed DEA analysis to assess and examine the efficiency of a direct and precise method for relative strategical efficiency of new technology commercialization performance. The efficiency evaluation technique employed in this paper could
Figure 6.The open innovation paradigm (sources from Reference [90]).
6. Conclusions and Implications
This paper constructed a framework of university efficiency strategy measurement in new technology commercialization. This framework employed DEA analysis to assess and examine the efficiency of a direct and precise method for relative strategical efficiency of new technology commercialization performance. The efficiency evaluation technique employed in this paper could provide another insight to analyze the performance of new technology commercialization in universities. The implication of the DEA efficiency result was to drive the efficiency level of the university’s strategy from the observed performance. It also helped to identify the benchmarking of other universities, which would be valuable information for improving their new technology commercialization strategy performance. In detail, a benchmark was provided to improve their weakness of strategy and resource allocation of poorly performing universities.