R E S E A R C H A R T I C L E
Open Access
Slow velocity of the center of pressure and
high heel pressures may increase the risk
of Sever
’
s disease: a case-control study
David Rodríguez-Sanz
1,2, Ricardo Becerro-de-Bengoa-Vallejo
2, Daniel López-López
3, Cesar Calvo-Lobo
4*,
Eva María Martínez-Jiménez
5, Eduardo Perez-Boal
5, Marta Elena Losa-Iglesias
5and Patricia Palomo-López
6Abstract
Background:This study determined if the body mass index, dynamic plantar-pressures, plantar surface contact-area, velocity of the centre of pressure (COP), gastrocnemius equinus, and gastrocnemius soleus equines are related to calcaneal apophysitis (Sever’s disease) in athletic children.
Methods:This case-control study examined 106 boys enrolled in a soccer academy, including 53 with Sever’s disease and 53 age-matched healthy controls. The dynamic average and maximum peak plantar-pressures, plantar surface contact-area, and velocity of the COP were evaluated with a digital pressure sensor platform. Goniometry was used to measure the ankle dorsiflexion range of motion and thereby identify gastrocnemius equinus and gastrocnemius soleus equinus.
Results:Participants with Sever’s condition had significantly higher BMI and peak plantar-pressures (maximum and average) at the heel (Cohen’s d > 3 for pressures) than the controls. Those with Sever’s disease also had significantly slower velocity of the COP (Cohen’s d > 3). Boys with Sever’s disease were also 8 times more likely to have bilateral gastrocnemius equinus than disease controls.
Conclusions:High heel plantar pressure and low velocity of COP are related to Sever’s condition in boys, although it is not clear whether these factors predispose individuals to the disease or are consequences of the disease. Gastrocnemius ankle equinus could be a predisposing factor for Sever’s condition.
Keywords:Velocity of the Centre of pressure, Apophysitis, Adolescent, Pressure, Equinus
Background
Calcaneal apophysitis is related to microtrauma at the bone-cartilage junction [1] resulting from overuse and repetitive movements during periods of rapid growth. Haglund first described calcaneal apophysitis. In 1912, Sever [2] described the condition, which was later given the name“Sever’s disease.”
Calcaneal apophysitis is a cartilaginous growth centred on the point where the Achilles tendon inserts into the heel [3–5]. The heel pain involved in Sever’s disease limits sports activities and may interfere with other dif-ferent activities of daily living. The disease is self limiting
because the calcaneal cartilage eventually decreases at the age of about 14 years in girls and 16 years in boys, when the calcaneus ossifies completely [6].
Calcaneal apophysitis or Sever’s disease has been de-fined as the most prevalent cause of heel pain in athletic children related to the activation of the triceps surae muscle [7, 8]. The etiological factors for Sever’s condi-tion are unclear and mostly speculative [9]. Researchers have hypothesized both intrinsic and extrinsic potential factors. Possible intrinsic factors include a limited range of ankle dorsiflexion motion [10,11] and high static [12] and dynamic plantar pressures [13] at the heel. Potential extrinsic factors include activities with high foot impact, footwear, and sports activities on hard surfaces [8, 14, 15]. However, the empirical evidence for most of the hy-pothesized contributing factors is limited or absent [16].
* Correspondence:[email protected]
4Nursing and Physical Therapy Department, Faculty of Health Sciences,
Universidad de León, Ponferrada, León, Spain
Full list of author information is available at the end of the article
To address this empirical gap, we conducted a matched case-control study on athletic children to examine factors that are evaluated by clinicians in the management of heel pain and their associations with Sever’s disease. Specifically, we investigated the body mass index (BMI), dynamic plantar-pressures, plantar surface contact-area, velocity of the centre of pressure (COP) during walking, gastrocnemius equinus, gastro-cnemius soleus equinus, and their relationships to Sever’s disease. The research question for this study was:
How are BMI, dynamic plantar-pressures, plantar sur-face contact-area, velocity of the COP, gastrocnemius equinus, and gastrocnemius soleus equinus related to calcaneal apophysitis (Sever’s disease) in children?
Methods
Subjects in this study were young athletes enrolled in a soccer academy who presented for a health screening at the end of the season. A total of 106 boys between the ages of 9 and 14 years were assessed for study eligibility. Participants were excluded if they had a neurological condition affecting either of the lower extremities or a recent history of foot and ankle trauma (including tendinitis, sprain, or any pathology other than Sever’s disease). All participants received the same amount of training hours and physical activity per week.
A total of 106 participants were enrolled in the study, including 53 boys with unilateral symptomatic Sever’s disease and 53 healthy children who never had heel pain and served as control participants. Clinical assessment for the diagnosis of Sever’s condition was carried out by the same podiatry doctor (RBBV). The main diagnostic criterion for calcaneal apophysitis was pain related to compression of the mediolateral calcaneus in the growth plate region [3]. The pain had to have a duration of at least 2 months, it had to be related to physical activity, and it had to be severe enough to stop normal physical activity [7].
The controls were selected from the pool of partici-pants with random-number software (Epidat 3.1, Pan American Health Organization, Washington D.C., USA). The controls were individually matched to the cases by age and the assessed foot. No differences were found be-tween or within the groups in terms of the time for sports participation and competition time, including after school sports activities and weekend training.
This case-control study conformed to the guidelines set forth in the Declaration of Helsinki and was approved by the research committee of Hospital La Princesa (Spain; code number 2828A). The parents of participating children gave informed written consent, and the participating children gave verbal assent prior to
data collection. The investigator (DRS) who collected the data and performed testing for all participants had extensive experience in conducting physical examina-tions of the foot and ankle (over 10 years). The same testing equipment and procedures were used to assess both groups.
We measured each participant’s height using a tallimeter (QUIRUMED, Valencia, Spain) with the participant barefoot and the arms hanging at rest. We also weighed each participant with a scale (QUIRUMED 627-MPS200K, Valencia, Spain). The Silfverskiold test [17, 18] was performed by measuring the ankle-dorsi-flexion range of motion using a clinical goniometer while the participant’s knee was alternately flexed and then extended.
For the flexed position, the participant laid on his back with the knee flexed at 90°. The amount of ankle dorsiflexion was defined as the angle between the plantar aspect of the heel (medially or laterally) and the tibia. Care was taken to maintain the subtalar joint in a neutral position to ensure that the ankle dorsiflexion was measured and not midfoot dorsiflexion (rocker bottom) or midfoot equinus (pseudoequinus) [18,19].
Dynamic plantar pressure was measured with a pressure-sensor platform (Win-pod, Medicapteurs, Balma, Fra) embedded in a flat 5-m walkway. Each participant walked barefoot in the walkway at a normal self-selected speed beginning 2 m in front of the platform and ending 1 m behind it. The participants were told to look forward and not to focus on any particular region of the walkway so as not to target the platform. The starting position of each participant’s walk was adjusted after several practice trials so that one foot would land on the pressure platform during a normal stride. The long path allowed measurements to be recorded during steady-state gait, which ensured that the effect of acceleration and deceleration at the start and end of each walk was minimized.
After familiarization with the testing procedures, a trial was considered as valid when the following criteria were met: (1) the presence of a heel and toe strike pattern, (2) prescribed normal speed looking forward, and (3) no visible adjustment in gait pattern when cross-ing the plate [20–22]. Trials that did not have these characteristics were excluded from the analysis. Obser-vations were made for the second step of a designated foot in a valid walking trial (the two-step method), and six measurements on each foot were collected from every participant [23, 24]. The subject did not know when a trial was acceptable and being registered.
manufacturer prior to the initiation of the study. We obtained a certificate of European approval (CE) for the platform to be used as a medical device. We calculated the BMI as the weight in kilograms divided by the square of the height in meters based on the Quetelet index equation.
The Winpod software produced pressure maps, which in-cluded measurements of the average peak pressure (g/cm2), maximum peak pressure (g/cm2), velocity (mm/s) of the COP, and plantar surface contact area (cm2) for each trial. The dynamic plantar-pressure outline for each participant was divided into four different sections: the heel, midfoot, forefoot, and toes. The heel, midfoot, and forefoot were marked as equal thirds of the plantar-pressures outline without the toes [23,25].
When recorded with a force platform, the COP is defined as the centroid of the vertical force distribution on the ground plane [26]. In young healthy feet, the velocity of the COP has three characteristic peaks during the stance phase of the gait [27, 28]. The first peak occurs in the rearfoot region between 0 and 20% of the stance phase corresponding to the“loading” response of the gait [27]. The second peak occurs at approximately 35% of the stance phase, when the COP moves from the midfoot to the forefoot. The final peak is at 92% of the stance phase, when the heel lifts off.
In our analyses, we focused on the average peak pres-sure, maximum peak prespres-sure, plantar surface contact area, and velocity of the COP at three points in the stance phase (20%, 35%, and 92%). The 20% and 35% measurements involved the heel, while the 92% mea-surements involved the forefoot. All meamea-surements were recorded as the means of a participant’s six valid trials for a given foot.
Gastrocnemius equinus is present when the gastrocne-mius muscle limits the ankle-dorsiflexion range of motion, and gastrocnemius soleus equines is present when the soleus muscle limits the ankle-dorsiflexion range of motion [19, 29]. Following prior investigators [24, 30], we defined gastrocnemius equinus as ankle dorsiflexion less than 10° in both knee-flexed and knee-extended positions. We defined gastrocnemius soleus equinus as the inability of the ankle to dorsiflex
beyond a neutral position (remaining < 0°) when the knee is flexed or extended.
We computed the means, standard deviations, and 95% confidence intervals for age, height, weight, and BMI for the participants overall and for the cases and controls separately. We also noted which heels were the focus of the analysis (Table 1). We calculated the intra-class correlation coefficients to assess the between-trial reliability for each plantar platform variable. Landis and Koch33 gave the following interpretation of coefficient values: 0.20–0.40 = fair, 0.40–0.60 = moderate, 0.60–0.80 = substantial, and 0.80–10.00 = almost perfect reliability.
We used cross-tabulations and chi-squared tests to compare the prevalence of each type of equinus in the cases and controls. The Kolmogorov-Smirnov statistical test was carried out to assess the normality of the plan-tar platform measures. We used Cohen’s d (standardized mean difference) and a student’s t-test to compare each of the plantar platform measures between the cases and controls. Cohen34 recommended the following interpre-tations of d: < 0.1 = trivial difference, 0.1–0.3 = small difference, 0.3–0.5 = moderate difference, and > 0.5 = large difference.
One-factor ACOVA (factor: Sever’s disease; covari-ables: height and weight) was carried to examine the influence of weight and height on the velocity of COP in both groups. For all analyses, we set the threshold for statistical significance as p< 0.01. All the statistical analyses were done using SPSS 19.0 (Chicago, IL, USA).
Results
The Kolmogorov-Smirnov test showed a normal distri-bution in all pressure platform variables. All coefficients were greater than 0.89, indicating very high between-trial reliability. Table2 shows the results of the pressure platform variables measured with the heel at 20% and 35% of the stance phase, respectively. The aver-age and maximum peak pressures participants were many times higher in those with Sever’s disease than the controls (p< 0.001). Despite the very large differences, the cases and controls had very similar plantar surface contact areas on average. Those with Sever’s disease also
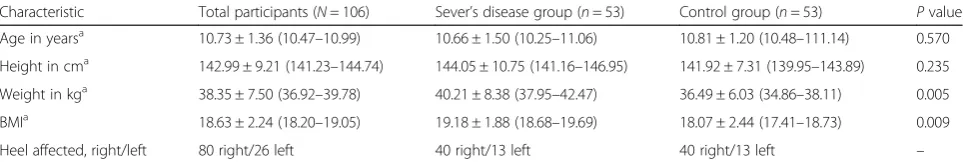
Table 1Characteristics of boys with and without Sever’s disease
Characteristic Total participants (N= 106) Sever’s disease group (n= 53) Control group (n= 53) Pvalue Age in yearsa 10.73 ± 1.36 (10.47–10.99) 10.66 ± 1.50 (10.25–11.06) 10.81 ± 1.20 (10.48–111.14) 0.570
Height in cma 142.99 ± 9.21 (141.23–144.74) 144.05 ± 10.75 (141.16–146.95) 141.92 ± 7.31 (139.95–143.89) 0.235 Weight in kga 38.35 ± 7.50 (36.92–39.78) 40.21 ± 8.38 (37.95–42.47) 36.49 ± 6.03 (34.86–38.11) 0.005 BMIa 18.63 ± 2.24 (18.20–19.05) 19.18 ± 1.88 (18.68–19.69) 18.07 ± 2.44 (17.41–18.73) 0.009 Heel affected, right/left 80 right/26 left 40 right/13 left 40 right/13 left –
a
The cells in these rows show means±standard deviations, with 95% confidence intervals in parentheses
had much lower velocity of the COP than the controls (p< .001).
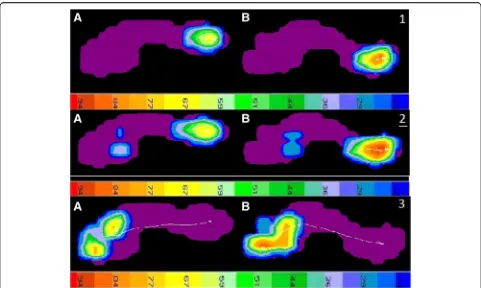
Figure1.1 and1.2 show the pattern of the results for 20% and 35% of the stance phase, respectively, for a rep-resentative case and a reprep-resentative control. The load in the heel area was significantly higher for the subject with Sever’s disease than the control. The line of the COP for the subject with Sever’s disease was also less straight and longer than that for the control, indicating more time in contact with the floor and higher load.
Table 2 shows the results for the pressure platform variables measured at the forefoot at 92% of the stance phase, when the heel has lifted off. Those with Sever’s disease had higher average and maximum peak pressures than the controls (p< 0.001). Nonetheless, the cases and controls had very similar plantar surface contact areas on average. Those with Sever’s disease also had moder-ately lower velocity of the COP than the controls, although the difference was not significant (p= 0.014). Figure1.3 shows the results for 92% of the stance phase for a representative case and a representative control.
The one-factor ANCOVA results obtained for the velocity at 20% of the stance phase shows no influence of height and weight on the velocity of COP. We found significant differences (p< 0.01) between the velocity of the Sever group (27.74 ± 3.94 mm/seg) and non-Sever
group (55.64 ± 8.22 mm/seg). For 35% of the stance phase, we found no influence of weight and height and obtained significant differences (p< 0.01) between the velocity of the Sever group (34.99 ± 1 mm/seg) and non-Sever group (66.21 ± 0.68 mm/seg). Similarly, the results for 92% of the stance phase show no influence of weight and height and significant differences (p< 0.01) for velocity between the Sever group (34.59 ± 5.3) and non-Sever group (31.48 ± 4.66). The same trend was found for velocity values at 100% of the gait process. We found no influence of height and weight and significant differences (p< 0.01) between the velocity of the Sever group (69.3 ± 0.65) and non-Sever Group (66.46 ± 0.44).
Those with Sever’s disease had a higher BMI and weighed more on average than the controls. The cases also had lower ankle range of motion than the controls, as indicated by a higher prevalence of gastrocnemius equinus. Furthermore, those with Sever’s disease had much higher plantar pressures and lower velocity of the COP at 20%, 35%, and 92% of the stance phase than the controls on average, although the plantar surface contact areas were similar between groups.
Discussion
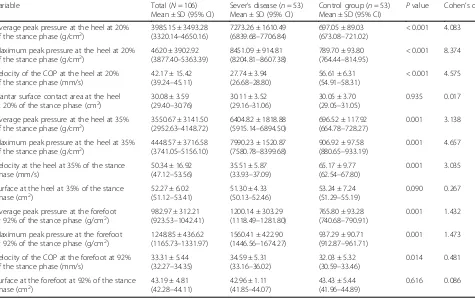
Our results are consistent with prior research, which also indicated that static and dynamic plantar pressures Table 2Pressure platform measurements at the heel at 20%, 35% and 92% of the stance phase for boys with Sever’s disease and controls
Variable Total (N= 106) Mean ± SD (95% CI)
Sever’s disease (n= 53) Mean ± SD (95% CI)
Control group (n= 53) Mean ± SD (95% CI)
Pvalue Cohen’s d Average peak pressure at the heel at 20%
of the stance phase (g/cm2) 3985.15 ± 3493.28(3320.14–4650.16) (6839.687273.26 ± 1610.49–7706.84) 697.05 ± 89.03(673.08–721.02) < 0.001 4.083
Maximum peak pressure at the heel at 20% of the stance phase (g/cm2)
4620 ± 3902.92 (3877.40–5363.39)
8451.09 ± 914.81 (8204.81–8607.38)
789.70 ± 93.80 (764.44–814.95)
< 0.001 8.374 Velocity of the COP at the heel at 20%
of the stance phase (mm/s)
42.17 ± 15.42 (39.24–45.11)
27.74 ± 3.94 (26.68–28.80)
56.61 ± 6.31 (54.91–58.31)
< 0.001 4.575 Plantar surface contact area at the heel
at 20% of the stance phase (cm2)
30.08 ± 3.59 (29.40–30.76)
30.11 ± 3.52 (29.16–31.06)
30.05 ± 3.70 (29.05–31.05)
0.935 0.017 Average peak pressure at the heel at 35%
of the stance phase (g/cm2) 3550.67 ± 3141.50(2952.63–4148.72) (5915.146404.82 ± 1818.88–6894.50) 696.52 ± 117.92(664.78–728.27) 0.001 3.138
Maximum peak pressure at the heel at 35% of the stance phase (g/cm2)
4448.57 ± 3716.58 (3741.05–5156.10)
7990.23 ± 1520.87 (7580.78–8399.68)
906.92 ± 97.58 (880.65–933.19)
0.001 4.657 Velocity at the heel at 35% of the stance
phase (mm/s)
50.34 ± 16.92 (47.12–53.56)
35.51 ± 5.87 (33.93–37.09)
65.17 ± 9.77 (62.54–67.80)
0.001 3.035 Surface at the heel at 35% of the stance
phase (cm2)
52.27 ± 6.02 (51.12–53.41)
51.30 ± 4.33 (50.13–52.46)
53.24 ± 7.24 (51.29–55.19)
0.090 0.267 Average peak pressure at the forefoot
at 92% of the stance phase (g/cm2) 982.97 ± 312.21(923.53–1042.41) (1118.491200.14 ± 303.29–1281.80) 765.80 ± 93.28(740.68–790.91) 0.001 1.432
Maximum peak pressure at the forefoot at 92% of the stance phase (g/cm2)
1248.85 ± 436.62 (1165.73–1331.97)
1560.41 ± 422.90 (1446.56–1674.27)
937.29 ± 90.71 (912.87–961.71)
0.001 1.473 Velocity of the COP at the forefoot at 92%
of the stance phase (mm/s)
33.31 ± 5.44 (32.27–34.35)
34.59 ± 5.31 (33.16–36.02)
32.03 ± 5.32 (30.59–33.46)
0.014 0.481 Surface at the forefoot at 92% of the stance
phase (cm2)
43.19 ± 4.81 (42.28–44.11)
42.96 ± 1.11 (41.85–44.07)
43.43 ± 5.44 (41.96–44.89)
[12,13] were higher in children with Sever’s disease than in healthy children. To our knowledge, no prior study has investigated the velocity of the COP during walking in relation to Sever’s disease. In our study, the heels of those with Sever’s disease supported higher average and peak pressures for more time than the heels of the controls. The greater amount and duration of pressure on the heel could lead to secondary injury of the vulner-able immature calcaneal cartilage. Jahss and colleagues showed that if the force or repetition of force is not attenuated to below a critical level, tissue damage can result, with healing responses leading to further struc-tural changes and alterations to the tissue mechanics. These changes can modify forces on the heel during the gait and lead to repetitive microtrauma [3,8].
Although gastrocnemius equinus and gastrocnemius soleus equinus are common in asymptomatic subjects, equinus may be a causative factor in many other foot and ankle pathologies, including plantar fasciitis, pes planus, hallux abducto valgus, Achilles tendinosis, Charcot’s midfoot collapse, and diabetic ulcerations [24]. The mechanism by which ankle equinus may influence calcaneal apophysitis or Sever’s disease is unclear [18].
Gastrocnemius equinus might lead to mechanical over-loading in the symptomatic heel as a direct consequence of soft tissue tightness. Tight triceps surae can cause ex-cessive tension through the Achilles tendon and increase the traction on the apophysis, which may lead to Sever’s disease due to an increased tractional effect [1,8,11].
One important limitation of this study is that with our case-control design, we cannot assess whether the high plantar pressures and low velocity of the COP are possible causes or consequences of Sever’s disease. Prospective and longitudinal trials are needed to shed light on the exact etiological factors of Sever’s disease. Additional work is also needed to investigate whether biomechanical factors beyond those assessed may be associated with diseases such as flat foot, pronated foot, and pes cavus, among other biomechanical conditions of the lower limbs. Other data-collection protocols for the plantar pressure variables might have produced different results. Nonetheless, our measurements displayed very high inter-trial reliability within participants. Further-more, measurements of the ankle-dorsiflexion range of movement can be highly variable within and between raters. It would be beneficial to obtain a standardised
approach for the measurement of ankle joint dorsiflex-ion. However, reliability is higher for gastrocnemius ankle motion than for gastrocnemius soleus ankle mo-tion. In regard to the subtalar-joint neutral validity and reliability, the palpation technique as part of the subtalar joint axis location and rotational equilibrium theory pro-posed by Kirby is a reliable and valid clinical tool. Experience in performing the palpation technique has a positive influence on the accuracy of the results [31].
Conclusion
High heel plantar pressure and low velocity of COP are associated with Sever’s condition in boys. However, it is not clear whether these factors predispose individuals to the disease or are consequences of the disease. Gastro-cnemius ankle equinus may also be a predisposing factor for Sever’s condition.
Practical implications
Clinical screening was performed with a non-invasive diagnosis tool (force platform) to examine high heel plantar pressure of COP and its association with Sever’s disease.
Screening was performed with a non-invasive diagnosis tool (force platform) to examine the association between low velocity of COP and Sever’s disease.
Gastrocnemius ankle equinus may be a predisposing factor for calcaneal apophysitis or Sever’s condition in children.
Abbreviations
BMI:Body mass index; CE: European approval; COP: Center of pressure Acknowledgements
Not applicable.
Funding Not applicable.
Availability of data and materials
Raw data are available for journal request. Presented as additional supporting file.
Authors’contributions
Substantial contributions to study conception and design: RBBV, DRS and MELI. Substantial contributions to acquisition of data: CCL, DRS., EMJ, RBBV, MELI, PPL. Substantial contributions to analysis and interpretation of data: RBBV, EPB, and MELI. Drafting the article or revising it critically for important intellectual content: CCL, DLL, RBBV, and MELI. Final approval of the version of the article to be published: DRS, CCL, DLL, RBBV, and MELI. All authors read and approved the final manuscript.
Ethics approval and consent to participate
This study conformed to the guidelines set forth in the Declaration of Helsinki and was approved by the institutional research committee of Hospital La Princesa code number 2828A (Spain). The parents of participating children gave informed written consent and the participating children gave verbal assent prior to data collection.
Consent for publication Not Aplicable.
Competing interests
The authors declare that they have no competing interests.
Publisher’s Note
Springer Nature remains neutral with regard to jurisdictional claims in published maps and institutional affiliations.
Author details 1
Department, Faculty of Health, Exercise and Sport, European University of Madrid, Madrid, Spain.2Facultad de Enfermería, Fisioterapia y Podología
UniversidadComplutense de Madrid, Madrid, Spain.3Research, Health and Podiatry Unit, Department of Health Sciences, Faculty of Nursing and Podiatry, Universidade da Coruña, Ferrol, Spain.4Nursing and Physical Therapy Department, Faculty of Health Sciences, Universidad de León, Ponferrada, León, Spain.5Faculty of Health Sciences, Universidad Rey Juan Carlos, Alcorcon, Spain.6University Center of Plasencia, Universidad de
Extremadura, Plasencia, Spain.
Received: 16 January 2018 Accepted: 23 October 2018
References
1. Saperstein AL, Nicholas SJ. Pediatric and adolescent sports medicine. Pediatr Clin N Am. 1996;43:1013–33.
2. Sever JW. Apophysitis of the os calcis. N Y Med J. 1912;95:1025–9. 3. Kaeding CC, Whitehead R. Musculoskeletal injuries in adolescents. Prim Care.
1998;25:211–23.
4. Ogden JA, Ganey TM, Hill JJ, et al. Sever’s injury: a stress fracture of the immature calcaneal metaphysis. J Pediatr Orthop. 2004;24:488–92. 5. Peck DM. Apophyseal injuries in the young athlete. Am Fam Physician.
1995;51:1891–5 1897-98.
6. Kvist MH, Heinonen OJ. Calcaneal apophysitis (Sever’s disease): a common cause of heel pain in young athletes. Scand J Med Sci Sports. 1991;1:235–8. 7. Ishikawa SN. Conditions of the calcaneus in skeletally immature patients.
Foot Ankle Clin. 2005;10:503–13.
8. Micheli LJ, Ireland ML. Prevention and management of calcaneal apophysitis in children: an overuse syndrome. J Pediatr Orthop. 1987;7:34–8.
9. Hendrix CL. Calcaneal apophysitis (sever disease). Clin Podiatr Med Surg. 2005;22:55–62.
10. Rome K. Anthropometric and biomechanical risk factors in the development of plantar heel pain: a review of the literature. Phys Ther Rev. 1997;3:123–34. 11. Szames SE, Forman WM, Oster J, et al. Sever’s disease and its relationship to
equinus: a statistical analysis. Clin Podiatr Med Surg. 1990;7:377–84. 12. Becerro de Bengoa Vallejo R, Losa Iglesias M, Rodríguez Sanz D, Prados
Frutos JC, Salvadores Fuentes P, López Chicharro J. Plantar pressures in children with and without Sever’s disease. J Am Podiatr Med Assoc. 2011; 101:17–24.
13. Becerro de Bengoa Vallejo R, Losa Iglesias ME, Rodriguez Sanz D. Static and dynamic plantar pressures in children with and without sever disease: a case-control study. Phys Ther. 2014;94:818–26.
14. Madden CC, Mellion MB. Sever’s disease and other causes of heel pain in adolescents. Am Fam Physician. 1996;54:1995–2000.
15. Wirtz PD, Vito GR, Long DH. Calcaneal apophysitis (Sever’s disease) associated with tae kwon do injuries. J Am Podiatr Med Assoc. 1988;78:474–5. 16. Scharfbillig RW, Jones S, Scutter SD. Sever’s disease: what does the literature
really tell us? J Am Pod Med Assoc. 2008;98:212–23.
17. Silfverskiöld N. Reduction of the uncrossed two-joint muscles of the leg to one-joint muscles in spastic conditions. Acta Chir Scand. 1924;56:315–28. 18. Lamm BM, Paley D, Herzenberg JE. Gastrocnemius soleus recession: a
simpler, more limited approach. J Am Podiatr Med Assoc. 2005;95:18–25. 19. Haglund P. Concerning some rare but important surgical injuries brought
on by violent exercise. Lancet. 1908;172:12–5.
20. Wearing SC, Urry S, Smeathers JE, Battistutta D. A comparison of gait initiation and termination methods for obtaining plantar foot pressures. Gait Posture. 1999;10:255–63.
21. De Cock A, Willems T, Witvrouw E, Vanrenterghem J, De Clercq D. A functional foot type classification with cluster analysis based on plantar pressure distribution during jogging. Gait Posture. 2006;23:339–47. 22. Harding VV. Time schedule for the appearance and fusion of a second
23. Hoerr NL, Pyle SI, Francis CC. Radiographic Atlas of Skeletal Development of the Foot and Ankle. Springfield, CC Thomas; 1962.
24. Downey MS, Banks AS. Gastrocnemius recession in the treatment of nonspastic ankle equinus: a retrospective study. J Am Podiatr Med Assoc. 1989;79:159–74.
25. Shopfner CE, Coin CG. Effect of weight-bearing on the appearance and development of the secondary calcaneal apophysis. Radiology. 1966;86:201–6. 26. Cavanagh PR. Forces and pressures between the foot and floor during
normal walking and running. In: Cooper JM, Haven B, editors. Proceedings of the Biomechanics Symposium. Indianapolis: Indiana State Board of Health, Indianapolis; 1980. p. 172.
27. Perry J. Gait analysis: Normal and pathological function. Thorofare: Slack; 1992. 28. Cornwall MW, McPoil TG. Velocity of the center of pressure during walking.
J Am Podiatr Med Assoc. 2000;90(7):334–8.
29. Santopietro FJ. Foot and foot-related injuries in the young athlete. Clin Sports Med. 1988;7:563–89.
30. Omey ML, Micheli LJ. Foot and ankle problems in the young athlete. Med Sci Sports Exerc. 1999;31:S470–86.