Abstract—Using the constructed wetland of Yan Huang ditch of Qihe County treat wastewater, and the real-time Polymerase Chain Reaction(PCR) technology was used to detect the water abundance of nitrification functional gene amoA and the abundance of denitrification function gene nirS, nirK and nosZ. The results showed that the whole abundance of amoA was low. At each sampling point, nosZ was the highest abundance gene, and nirS had the same trend with nirK, and the abundance of nirS was higher than the abundance of nirK. The study showed that the removal rate of chemical oxygen demand (COD) was relatively high, but the removal rate of ammonia nitrogen was lower, and the effect of nitrogen removal was not obvious, and the end product of denitrification was nitrogen. The content of ammonium nitrogen (NH4+-N) in water had significant negative correlation with the abundance of amoA, but the content of nitrate nitrogen (NO3--N) had no significant correlation with the abundance of nirS, nirK and nosZ, which indicated that there were other nitrogen removal mechanisms in addition to nitrification-denitrification.
Index Terms—Constructed wetland, amoA, nirS, nirK, nosZ.
I. INTRODUCTION
As an ecological and low cost water treatment technology, constructed wetland has been widely used in the treatment of wastewater, and denitrification treatment of wastewater [1]-[3]. There are many kinds of nitrogen removal mechanisms in constructed wetland, in which microbial nitrification-denitrification is considered as the most important nitrogen removal process [4], [5]. The study showed that the removal of nitrogen content by nitrification-denitrification accounts for 60%-86% of total nitrogen removal [6]. Therefore, it has the actual significance to study the community structure and the abundance of nitrogen removal microbial in constructed wetland.
As the limiting step of nitration reaction, ammonia oxidation reaction is the key step of nitrogen removal [7]. As diversity of ammonia oxidizing bacteria molecular markers,
amoA gene has been widely applied in the study of natural and artificial ecosystems [8]-[10]. Siripong and Rittmann et al. [11] showed that amoA gene was used to detect the diversity
Manuscript received December 10, 2015; revised February 10, 2016. Zhu Ying, Tian Chao, and Shao Yanqiu are with the New Materials Research Institute of Shandong Academy of Sciences, Jinan, 250014, China (e-mail: [email protected], [email protected], [email protected]).
Tang Houquan is with the Jinan Environmental Monitoring Center, Jinan, 250014, China (e-mail: [email protected]).
Chen Qingfeng is with the Shandong Analysis and Test Center, Jinan, 250014, China (e-mail: [email protected]).
of the bacterial population in the seven water reuse plant, and the hypothesis that the diversity and functional redundancy of the nitrification bacteria in activated sludge with stable and complete nitrification was significantly similar. Mertoglu et al. [12] used 16S rDNA and amoA gene which based molecular biology techniques in the assessment of the effect of ammonia removal in the landfill bioreactor to determine the nitrification activity. The amoA gene was used as phylogenetic relationship of comparative basis to assess the dissolved oxygen of ammonia oxidizing bacteria population in activated sludge in the study of Park and Noguera [13]. Nitrate or nitrite can be reduction into nitrogen or nitrous oxide (N2O) by denitrification bacteria. This process was accomplished by NO3--N reductase (Nar), NO2--N reductase (Nir), NO reductase (Nor) and N2O reductase (Nos), in which the nirK,
nosZ, nirS and other genes play an important role in the denitrification pathway [14]. At present, denitrification genes’ (such as nirS, nirK and nosZ) PCR amplification primer method has been successfully used in the study of diversity of denitrifying bacteria, such as Marine sediments [15], cyanobacteria blooms [16], pollution of groundwater [17] and all kinds of water treatment reactor [18], [19].
Real-time PCR technology which has a higher sensitivity, specificity and greater reliability, can realize multiple reaction and other characteristics, and has been widely applied in all kinds of denitrification function group of bacterial abundance in the environment of study[20]-[22]. At present, the study on the function gene of the constructed wetland is focused on the denitrification gene, but the study of quantitative about genes both the nitrification and denitrification in constructed wetland is rare. In addition, the winter’s temperature is lower than other season in northern China, and the temperature is too low will not only affect wetland treatment effect of pollutants, may also cause the water to freeze, low dissolved oxygen content and other adverse consequences, which limits the application of artificial wetland in the north, thus for wetland winter less study. Therefore, through using Real-time PCR technology, this study aimed at amoA, nirS, nirK and
nosZ genes, to make a quantitative at different levels of nitrifying and denitrifying bacteria in constructed wetland. At the same time, this study determinate content changes of COD, dissolved oxygen (DO), NH4+-N, NO3--N and total nitrogen (TN) in water, to discuss the relationship between nitrification-denitrification genes abundance variation characteristics of with the quality of the output water.
II. MATERIALS AND METHODS
Correlation between Changes of the Abundance of the
Nitrification and Denitrification and Quality of the
Effluent in Constructed Wetland
A. Constructed Wetland Technology
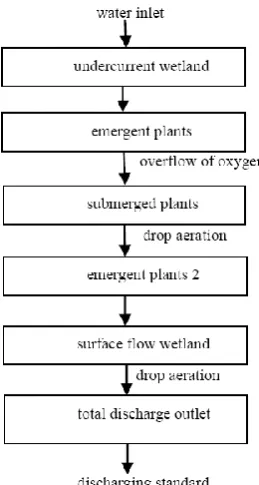
The experiment adopted process as follows: using the undercurrent wetland technology as the mainly pole and combination technology of surface flow constructed wetland as the auxiliary pole. Process is shown in Fig. 1.
Fig. 1. Process of constructed Wetland.
B. Sample Collection and Water Quality Analysis
Water samples were collected from constructed wetland of yanhuang ditch Qihe County of Shandong Province in December 2014. Set the sampling point at the outlet of each pond, respectively: water inle (A), undercurrent wetland(B), emergent plants (C), submerged plants (D), emergent plants2(E), surface flow wetland (F), total discharge outlet(G). Each sample point was collected from 4 L water, which was quickly transported to the laboratory for 4℃ to freezing. Determinate of water quality indexes (COD, DO, NH4+-N, NO3--N and TN) content change by using standard methods [23] DNA samples immediately enrichment, extraction, and -20℃ preservation. In order to the stability of the operation, DNA extraction and Real - time PCR test all has three parallel samples
C. DNA Extraction
Using polycarbonate membrane (aperture 0.2μm, diameter of 50 mm, Millipore) vacuum suction filter 50 mL water sample, and then to filter 2 mL sterilization water for washing membrane filter. Cut into pieces, membrane filter in 10 mL of polyethylene centrifuge tube, add 1.8 mL SET buffer (0% sucrose, tendency of 50 mmol/L EDTA, tendency of 50 mmol/L Tris HCl, pH = 7. 6) [24], spiral, - 20 ℃ preservation, for subsequent DNA extraction [25]. Sediment genomic DNA extraction using Fast DNA @ SPIN for soil kit (MP, USA), according to product manuals, with 50μL finally Tris - HCl (pH = 8.0-8.5) dissolve purified DNA.
D. Real-Time Pcr Assays
Amplification of quantitative PCR products was carried out with an ABI Prim SDS 7300 (Applied Biosystems, USA).
amoA and denitrification function gene (nirS, nirK and nosZ) primers used sequence information shown in Table I [20], [26]-[30], The real-time PCR use 20μL system, components: the PCR mastermix (Applied Biosystems, USA) 10μL; 20μ mol/L upstream and downstream primers each 0.5μL; DNA template 1μL; ddH2O 8μL. The reaction conditions of PCR: 500C for 2 min (enzyme); 950C for 10 min;40 cycles , 950C for 15 s, annealing 1 min(amoA 54. 50C, nirS 580C, nirK 600C, nosZ 580C), and then 72℃ for 30 s; With the final score of 0.1℃/s rate rising from 600C to 950C, obtain the solution of the amplified DNA fragments chain curve.
TABLEI:PRIMERS USED IN REAL-TIME PCR target gene primers primer sequences
amoA amoA-1F
GGGGTTTCTACTGGTGGT′
amoA-2R CCCCTCKGSAAAGCCTTCTTC
nirS nirS-cd3aF GTSAACGTSAAGGARACSGG nirS-R3cd GASTTCGGRTGSGTCTTGA
nirK nirK-876F ATYGGCGGVAYGGCGA nirK-1040R GCCTCGATCAGRTTRTGGTT
nosZ
nosZ-F CGYTGTTCMTCGACAGCCAG
nosZ-1622
R CGSACCTTSTTGCCSTYGCG
E. Statistics and Analysis
Using SPSS18.0 and origin9.0 software analyze the data of environmental factors, nitrification and denitrification, and the correlation.
III. RESULTS AND DISCUSSIONS
A. Purification of Water Quality in Constructed Wetland
COD, DO, NH4+-N, NO3--N and TN concentrations change of sampling points out-water as shown in Fig. 2 (a) and (b). The content of COD, NH4+-N and TN were decreased with the operation process of constructed wetland, and content change of influent and effluent were: 66.9mg/L-15.6mg/L, 5.48mg/L -3.70mg/L and 5.57 mg/L -3.79mg/L. Removal efficiency were 76.68%, 32.48% and 31.96%. The content of DO and NO3
--N were first increase and after decrease with the operation process of constructed wetland, and the content change of influent and effluent were: 1.44mg/L-6.5mg/L and 0.05mg/L-0.08mg/L.
nitrite, and oxygen is consumed not only of the constructed wetland system in the degradation of nitrogen and phosphorus and other nutrients, also is used in organic material degradation, these make the process of denitrification become more limited [33], [34]. The sampling time is December, after entering the winter, the content of DO in water is all low, but input water contain a certain content of DO which can carry out nitration reaction, so the removal rate of NH4+-N is relatively large. After treatment of subsurface flow constructed wetlands, before surface flow wetland, the content of DO in water was lower, and with little change, so NH4+-N was removed slow. After several times of drop aeration, to the surface flow wetland, the DO content in water gradually increased, thus of NH4+-N removal rate was higher.
A B C D E F G
10 20 30 40 50 60 70
COD DO
Sampling point
COD
concentra
tion/mg.L
-1
(a)
1 2 3 4 5 6 7
DO con
centrat
ion/mg.L
-1
A B C D E F G
3.5 4.0 4.5 5.0 5.5
NH4+-N
TN NO3--N
Sampling point
NH
4
+
-N and T
N
concentration/mg.L
-1
(b)
0.2 0.4 0.6 0.8 1.0
NO
3
--N concentr
ati
on/mg.L
-1
Fig.2.TheresultswaterpurificationinconstructedwetlandA:waterinle,B: undercurrentwetland,C:emergentplants,D:submergedplants,E:emergent
plants2,F:surfaceflowwetland,G:totaldischargeoutlet.
The Fig. 2(b) shows that the content of NO3--N was gradually increasing. The input water content of NO3--N was 0.05 mg/L, and the output water the content of NO3--N was 0.08 mg/L. The content of NO3--N gradually increased in surface flow wetland, This result may be due to there was more DO in water of surface flow wetland, resulting in nitrification was stronger, ammonifier can convert organic nitrogen and ammonia nitrogen to nitrate nitrogen, resulting in content of nitrate nitrogen increased.
Similar to the variation of the changes of TN and NH4+-N. But before submerged plants, the decline range of TN was greater than NH4+-N. The main reason is that the content of organic nitrogen in influent is relatively large, which provides nitrogen source for ammonia oxidizing bacteria, and ammonia oxidizing bacteria convert organic nitrogen to NH4+-N. However, NH4+-N affected by DO could not be timely carried out nitrification transformation, resulting in the accumulation of NH4+-N, but content of less ammonia oxidizing bacteria in the influent, NH4+-N accumulated less.
B. Abundance Changes of Nitrification Microbial Communities in Water
At each sampling point, the quantitative analysis of denitrification gene (nirS, nirK and nosZ)in water results as shown in Fig. 3(b). Overall, the abundance of nirS, nirK and
nosZ showed an increasing trend along the process. The abundance of nosZ gene was the higher. The abundance of
nosZ of the influent was the lowest, only 6.00E+09copies/L, and the surface flow wetland was the highest, which was 1.29E+13copies/L. There nirS has increasing trend after the first decreasing. The abundance of nirS was lowest in influent, only 4.82E+09copies/L, and was highest in submerged plants, emergent plants 2, surface flow wetland and total discharge outlet followed, respectively 3.50E+12copies/L, 2.97E+12copies/L, 2.55E+12copies/L and 2.40E+12copies/L. NirK had the same trend with nirS, and the abundance of nirK gene was lower than nirS gene at all sampling points. The lowest abundance of nirK gene was also in the influent, only 1.15E+09copies/L and reached the highest in the submerged plant, 1.78E+12copies/L. The abundance of nirK gene had declined in emergent plants 2, surface flow wetland and total discharge outlet, but did not change significantly.
There are many functional genes involved in denitrification process. Since nitrite is converted to nitric oxide is different from other nitrate metabolism iconic response in denitrification process, and is important in the process of denitrification rate-limiting step. The corresponding nitrite reductase gene (including nirS and nirK) is often used as a representative molecule denitrifying microorganisms research community structure tag. Jones et al. [35] pointed out that although the two kinds of denitrification function of
nirS and nirK genes encode enzymes to exercise the same function in the process of denitrification, and these two genes carrying denitrifying bacteria seem to exist for different micro environmental preferences. Knapp et al. [36]pointed out that the abundance of nirS is more in anoxic environment and the abundance of nirK is more in oxygen-rich conditions. Ligi et al. [37] found that the abundance of nirS in a riparian zone was higher than that of nirK. Zhi et al. [38] found that the abundance of nirS was also higher than nirK in constructed wetland. Similar results were obtained in this study which the abundance of nirS was lower in oxygen-rich. NirK had the same trend with nirS, and the abundance of nirK gene was lower than nirS gene at all sampling points. It is indicated that the nirS type of the denitrification bacteria can adapt to the water quality environment of the constructed wetland than
nirK.
anti-nitrifying bacteria growth, and is conducive to nitrification and denitrification common occurrence.
A B C D E F G
105 106 107 108 109 1010 1011
amo
A c
opies/L
Sampling point (a)
A B C D E F G
107 108 109 1010 1011 1012 1013 1014 1015 1016
copies/L
Sampling point
nirS
nirK
nosZ
(b)
Fig.3.TheabundanceofnitrificationanddenitrificationinwaterA:water inle,B:undercurrentwetland,C:emergentplants,D:submergedplants,E:
emergentplants2,F:surfaceflowwetland,G:totaldischargeoutlet.
C. Abundance Changes of Denitrification Microbial Communities in Water
At each sampling point, the quantitative analysis of denitrification gene (nirS、nirK and nosZ)in water results as shown in Fig. 3(b). Overall, the abundance of nirS, nirK and
nosZ showed an increasing trend along the process. The abundance of nosZ gene was the higher. The abundance of
nosZ of the influent was the lowest, only 6.00E+09copies/L, and the surface flow wetland was the highest, which was 1.29E+13copies/L. There nirS has increasing trend after the first decreasing. The abundance of nirS was lowest in influent, only 4.82E+09copies/L, and was highest in submerged plants, emergent plants 2, surface flow wetland and total discharge outlet followed, respectively 3.50E+12copies/L, 2.97E+12copies/L, 2.55E+12copies/L and 2.40E+12copies/L. NirK had the same trend with nirS, and the abundance of nirK gene was lower than nirS gene at all sampling points. The lowest abundance of nirK gene was also in the influent, only 1.15E+09copies/L and reached the highest in the submerged plant, 1.78E+12copies/L. The abundance of nirK gene had declined in emergent plants 2, surface flow wetland and total discharge outlet, but did not change significantly.
There are many functional genes involved in denitrification process. Since nitrite is converted to nitric oxide is different from other nitrate metabolism iconic response in denitrification process, and is important in the process of
denitrification rate-limiting step. The corresponding nitrite reductase gene (including nirS and nirK) is often used as a representative molecule denitrifying microorganisms research community structure tag. Jones et al. [35] pointed out that although the two kinds of denitrification function of
nirS and nirK genes encode enzymes to exercise the same function in the process of denitrification, and these two genes carrying denitrifying bacteria seem to exist for different micro environmental preferences. Knapp et al. [36]pointed out that the abundance of nirS is more in anoxic environment and the abundance of nirK is more in oxygen-rich conditions. Ligi et al. [37] found that the abundance of nirS in a riparian zone was higher than that of nirK. Zhi et al. [38] found that the abundance of nirS was also higher than nirK in constructed wetland. Similar results were obtained in this study which the abundance of nirS was lower in oxygen-rich. NirK had the same trend with nirS, and the abundance of nirK gene was lower than nirS gene at all sampling points. It is indicated that the nirS type of the denitrification bacteria can adapt to the water quality environment of the constructed wetland than
nirK.
NosZ can encode nitrous oxide reductase, and the enzyme N2O can be reduced to N2. García-Lledo et al. [39]found the abundance of nirS was significantly higher than nosZ in the study of denitrification function of wetland, and when the abundance of nosZ was significantly lower than that of other denitrifying functional gene, N2O which is denitrification intermediate was cumulated in constructed wetland. The results of this test are opposite, the abundance of nosZ is higher than nirS, which indicates that the end product of denitrification in the wetland is N2. In addition, in this test, both abundance of nitrification and denitrification gene were higher in emergent plants 2 and surface flow wetland, which indicates that the environmental conditions of the two sampling points is more appropriate denitrifying bacteria and anti-nitrifying bacteria growth, and is conducive to nitrification and denitrification common occurrence.
D. Abundance Variation of Nitrification and
Denitrification Functional Geneand Correlation between Water Quality Parameters
Correlation analysis of nitrification functional gene abundance and water quality parameters is shown in Table II. The abundance of amoA gene was significantly negatively correlation with the content of NH4+-N (P<0.05); there was no significant negative correlation with TN(P>0.05); the abundance of amoA gene was positively correlation with DO and NO3--N, but the correlation was not significant(P>0.05).
Correlation analysis of denitrification functional gene abundance and water quality parameters is shown in Table III. The abundance of nirS and nirK were no significantly negatively correlation with the content of NH4+-N and TN (P>0.05); the abundance of nosZ gene was significantly negatively correlation with the content of NH4+-N and TN (P<0.05); the abundance of nirS、nirK and nosZ gene were positively correlation with DO and NO3--N, but the correlations were not significant(P>0.05).
Correlation analysis showed that the content of DO didn’t exist significantly correlation with the abundance of nirS,
wetlands by García-Lledó et al. [39] studied. Dissolved oxygen can effectively inhibit the denitrification activity of denitrifying bacteria, but does not mean the abundance of denitrification gene function will be affected by oxygen inhibition.Truu et al. [40] also pointed out that denitrification activity and abundance of denitrifying functional genes can’t be simple linked.
TABLEII:PEARSON CORRELATION ANALYSIS OF ENVIRONMENTAL
PARAMETERS AND ABUNDANCE OF NITRIFICATION GENES
Water parameters C OD
D O
T N
N H4+-N
N O3--N
amoA
-0.803*
0 .385
-0.711
-0.7 65*
0 .303 Note: *is significant correlation (P<0.05).
TABLEIII:PEARSON CORRELATION ANALYSIS OF ENVIRONMENTAL
PARAMETERS AND ABUNDANCE OF DENITRIFICATION GENES
Water parameters nirS nirK nosZ
COD 0.624 0.747 -0.859*
DO 0.220 0.376 0.578
TN -0.560 -0.690 -0.844*
NH4+-N -0.584 -0.711 -0.863*
NO3--N 0.104 0.232 0.473
Note: *is significant correlation (P<0.05).
There was a significant negative correlation between nitrification genes and the content of NH4+-N, which was not significant with NO3--N. The reason is that with the increase abundance of ammonia oxidizing bacteria in water, NH4+-N is oxidized into NO3
--N or NO2
--N, which leads to the decrease of NH4+-N and increase of NO3--N. NO3--N is a substrate for denitrification, and it should be closely related to the denitrification bacteria. However, the results showed that there was no significant correlation between denitrification bacteria and NO3--N, The results may be that the content of NO3--N in influent is less and the quantity of denitrifying bacteria increased along the process, NO3--N in water far do not provide sufficient substrate for the denitrification, and the substrate must be another source of denitrification required, Therefore, the low content of NO3--N failed to show a significant correlation with the denitrification bacteria.
IV. CONCLUSIONS
The removal of COD by constructed wetland was efficiency, and the removal rate reached 76.68%. The removal rate of TN, NH4+-N was lower, and the removal rate was only 31.96% and 32.48%. The removal efficiency of NO3--N was not obvious, and the content of NO3--N increased slightly.
The whole abundance of amoA was low, and that of amoA is increasing along the process, which indicates that the initial nitrification ability of the constructed wetland is weak, and there is a gradually increasing trend; the abundance of nirK gene was lower than nirS gene at all sampling points. But the response of the two types of nir-type denitrification bacteria is more consistent with the environmental change, which indicated that the nirS type of the denitrification bacteria can adapt to the water quality environment of the constructed wetland. The abundance of nosZ was higher than the
abundance of nirS and nirK, which indicated that the end product of denitrification was N2.
There was significant negative correlation between the content of NH4+-N and the abundance of amoA, and there was no significant correlation between the content of NO3
--N and the abundance of nirS,nirK and nosZ, which indicated that the mechanism of nitrification-denitrification in northern winter is not obvious, and there may be other nitrogen removal mechanisms.
ACKNOWLEDGMENT
The work was financially supported by the National Natural Science Foundation of China (51208290) and The Major Science and Technology Program for National Water Pollution Prevention and Control (2012ZX07203-004)
REFERENCES
[1] S. David, F. Lauchlan, B. James et al., “Efficiency of small constructed wetlands for subsurface treatment of single family domestic effluent,” Ecological Engineering, vol. 18, pp. 429-440, 2002.
[2] D. JiG, T. H. Sun, Q. X. Zh et al., “Constructed subsurface flow wetland for treating heavy oil-produced water of the Liaohe Oilfield in China,” Ecological Engineering, vol. 18, pp. 459-465, 2002. [3] B. C. Braskerud, “Factors affecting nitrogen retention in small
constructed wetlands treating agricultural non-point source pollution,” Ecological Engineering, vol. 18, pp. 459-465, 2002.
[4] J. Vymazal, “Horizontal sub-surface flow and hybrid constructed wetlands systems for wastewater treatment,” Ecological Engineering, vol. 25, no. 5. pp. 478-490, 2005.
[5] C. G. Lee, T. D. Fletcher, and G. Z. Sun, “Nitrogen removal in constructed wetland systems,” Engnieering in Life Sciences, vol. 9, no. 1, pp. 11-22, 2009.
[6] Y. Ding, X. S. Song, Y. H. Wang et al., “Effects of dissolved oxygen and influent COD/N ratios on nitrogen removal in horizontal subsurface flow constructed wetland,” Ecological Engineering, vol. 46, no. 1, pp. 107-111, 2012.
[7] W. Deboer, P. J. A. K. Gunnewiek, M. Veenhuis et al., “Nitrification at low pH by aggregated chemolithotrophic bacteria,” Applied and Environmental Microbiology, vol. 57, pp. 3600-3604, 1991. [8] A. Gieseke, U. Purkhold, U. Wagnerx, R. Amann et al., “Community
structure and activity dynamics of nitrifying bacteria in aphosphate-removing biofilm,” Applied and Environmental Microbiology, vol. 67, no. 3, pp. 135l-62, 2001.
[9] H. P. Horz, J. H. Rotthauwe, T. Lukow et al., “Identification of major subgroups of ammonia-oxidizing bacteria in environmental samples by T-RFLP analysis of amoA PCR products,” Journal of Microbiological Methods, vol. 39, pp. 197-204, 2000.
[11] S. Siripong and B. E. Rittmann, “Diversity study of nitrifying bacteria in full-scale municipal wastewater treatment plants,” Water Research, vol. 41, no. 5, pp. 1110-1120, 2007.
[12] B. Mertoglu, B. Calli, B. Inanc et al., “Evaluation of in situ ammonia removal in all aerated landfill bioreactor,” Process Biochemistry, vol. 41, no. 12, pp. 2359-2366, 2006.
[13] H. D. Park and D. R. Noguera, “Evaluating the effect of dissolved oxygen on ammonia-oxidizing bacterial communities in activated sludge,” Water Research, vol. 38, no. 14-15, pp. 3275-3286, 2004. [14] L. G. Grregory, P. L. Bond, D. J. Richardson et al., “Characterization
of a nitrate-respiring bacterial community using the nitrate reductase gene (narG)as a functional marker,” Microbiology, vol. 1, no. 49, pp. 229-237, 2003.
[15] H. Y. Dang, J. Li, X. Zhang et al., “Diversity and spatial distribution of amoA-encoding archaea in the deep-sea sediments of the tropical West Pacific Continental Margin,” Applied and Environmental Microbiology, vol. 106, no. 5, pp. 1482-1493, 2009.
[16] J. Tuomainen, S. Hietanen, J. K. Parinen et al. “Baltic sea cyanobacterial bloom contains denitrifieation and nitrification genes, [10] J. H. Rotthauwe, K. P. Witzel, and W. Liesack, “The ammonia
International Journal of Environmental Science and Development, Vol. 7, No. 12, December 2016
[18] Y. Sakano, K. D. Piekering, P. F. Strom et al., “Spatial distribution of total, ammonia-oxidizing, and denitrifying bacteria in biological wastewater treatment reactors for bioregenerative life support,” Applied and Environmental Microbiology, vol. 68, pp. 2285-2293, 2002.
[19] S. Tsuneda, R. Miyauehi, T. Ohno et al., “Characterization of denitrifying polyphosphate-accumulating organisms in activated sludge based on nitrite reductase gene,” Journal of Bioscience and Bioengineering, vol. 99, pp. 403-407, 2005.
[20] E. Kandeler, K. Deiglmayr, D. Tscherko et al., “Abundance of narG, nirS, nirK and nosZ genes of denitrifying bacteria during primary successions of a glacier foreland,” Applied and Environmental Microbiology, vol. 72, no. 9, pp. 5957-5962, 2006.
[21] M. D. Wallenstein and R. J. Vilgalys, “Quantitative analyses of nitrogen cycling genes in soils,” Pedobiologia, vol. 49, no. 6, pp. 665-672, 2005.
[22] J. S. David and J. K. Lee, “Diversity of nitrous oxide reductase (nosZ) genes in continental shelf sediments,” Applied and Environmental Microbiology, vol. 65, no. 4, pp. 1681-1687, 1999.
[23] APHA, Standard Methods for the Examination of Water and Wastewater, 20th ed. Washington, DC. 1998.
[24] C. C. Sommerville, Knightit, W. L. Straube et al., “Simple rapid method for direct isolation of nucleic acids from aquatic environments,” Applied and Environmental Microbiology, vol. 55, no. 3, pp. 548-554, 1989.
[25] Riveraing, Lippek, Gila et al., “Method of DNA extraction and application of multiplex polymerase chain reaction to detect toxigenic vibrio cholerae O1 and O139 from aquatic ecosystems,” Environmental Microbiology, vol. 5, no. 7, pp. 599-606, 2003. [26] G. A. Kowalchuk, J. R. Stephen, W. Deboer et al., “Analysis of
ammonia-oxidizing bacteria of the subdivision of the class proteobacteria in coastal sand dunes by denaturing gradient gel electrophoresis and sequencing of PCR-amplified 16S ribosomal DNA fragments,” Applied and Environmental Microbiology, vol. 63, no. 4, pp. 1489-1497, 1997.
[27] A. Hermansson and P. E. Lindgren, “Quantification of ammonia oxidizing bacteria in arable soil by real-time PCR,” Applied and Environmental Microbiology, vol. 67, no. 2, pp. 972-976, 2001. [28] J. Geets, M. de Cooman, L. Wittebolle et al. “Realtime PCR assay for
the simultaneous quantification of nitrifying and denitrifying bacteria in activated sludge,” Applied Microbiology and Biotechnology, vol. 75, no. 1, pp. 211-221, 2007.
[29] S. Henry, E. Baudoin, J. C. Lopez-Gutierrez et al., “Quantification of denitrifying bacteria in soils by nirK gene targeted real-time PCR,” Journal of Microbiological Methods, vol. 59, no. 3, pp. 327-335, 2004.
[30] J. Jung, J. Yeom, J. Han et al., “Seasonal changes in nitrogen-cycle gene abundances and in bacterial communities in acidic forest soils,” Journal of Microbiology, vol. 50, no. 3, pp. 365-373, 2012. [31] G. Maltais-Landry, R. Maranger, J. Brisson et al., “Nitrogen
transformations and retention in planted and artificially aerated constructed wetlands,” Water Research, vol. 43, no. 2, pp. 535-545, 2009.
[32] G. Z. Sun and D. Austin, “Completely autotrophic nitrogen-removal over nitrite in lab-scale constructed wetlands: Evidence from a mass balance study,” Chemosphere, vol. 68, no. 6, pp. 1120-1128, 2007. [33] A. Sims, J. Horton, S. Gajaraj et al., “Temporal and spatial
distributions of ammonia-oxidizing archaea and bacteria and their ratio as an indicator of oligotrophic conditions in natural wetlands,” Water Research, vol. 46, no. 13, pp. 4121-4129, 2012.
[34] H. P. Horz, A. Barbrook, C. B. Field et al., “Ammonia oxidizing bacteria respond to multifactorial global change," in Proc. the National Academy of Sciences of the United States of America, vol. 101, pp. 15136-15141, 2004.
[35] C. M. Jones and S. Hallin, “Ecological and evolutionary factors underlying global and local assembly of denitrifier communities,” The ISME Journal, vol. 4, no. 5, pp. 633-641, 2010.
[36] C. W. Knapp, W. K. Dodds, K. C. Wilson et al., “Spatial heterogeneity of denitrification genes in a highly homogenous urban stream,” Environmental Science & Technology, vol. 43, no. 12, pp. 4273-4279, 2009.
[37] T. Ligi, M. Truu, J. Truu et al., “Effects of soil chemical characteristics and water regime on denitrification genes (nirS, nirK and nosZ) abundances in a created riverine wetland complex,” Ecological Engineering, vol. 72, pp. 47-55, 2014.
[38] W. Zhi and G. D. Ji, “Quantitative response relationships between nitrogen transformation rates and nitrogen functional genes in a tidal flow constructed wetland under C/N ratio constraints,” Water Research, vol. 64, pp. 32-41, 2014.
[39] A. García-Lledó, A. Vilar-Sanz, R. Trias et al., “Genetic potential for N2O emissions from the sediment of a free water surface constructed
wetland,” Water Research, vol. 45, no. 17, pp. 5621-5632, 2011. [40] M. Truu, J. Juhanson, and J. Truu, “Microbial biomass activity and
community composition in constructed wetlands,” Science of the Total Environment, vol. 407, no. 13, pp. 3958-3971, 2009.
Zhu Ying was born in March 1978. She got her PhD in environmental engineering in 2008 from Tongji University; the master of environmental engineering in 2005 from Shandong University; and the bachelor of environmental engineering in 2000 from Qingdao University. Her research areas are environmental engineering.
She is the head of Environmental Engineering Materials Innovation Team of New Materials Research Institute of Shandong Academy of Sciences. She is a research associate.
Tian Chao was born in September 1989. He got the master of environmental engineering in 2015 from Guilin University of Technology; and the bachelor of environmental engineering in 2012/06 from College of Science & Amp, Arts of Jianghan University. He research areas are environmental engineering.
He is a member of Environmental Engineering Materials Innovation Team of New Materials Research Institute of Shandong Academy of Sciences. He is a research intern.
Tang Houquan got the master of environmental Engineering from Shandong University. His research areas are environmental engineering. He is an environmental engineer.
Shao Yanqiu was born in June 1985. Her education experience is as follows: she got the PhD in environmental engineering in 2015 from University of Chinese Academy of Sciences; the master of environmental engineering in 2011 from Northwest A & F University; and the bachelor of environmental engineering in 2008. Her research areas are environmental engineering.
She is a member of Environmental Engineering Materials Innovation Team of New Materials Research Institute of Shandong Academy of Sciences. She is an assistant researcher.
Chen Qingfeng’s research areas are study on key
technologies, wetland ecological process and surface source pollution control technology in the construction of multi natural river. He is a PhD in environmental engineering, research associate.
but has negligible denitrification activity,” FEMS Microbiology Ecology, vol. 45, pp. 83-96, 2003.