Deviation Causing Factors in a Code based on
Environment of Analysis
Rohitt Sharma
Department of Computer Science
Lovely Professional University
Phagwara, India
Paramjit Singh
Department of Computer Science
Lovely Professional University
Phagwara, India
Sumit Sharma
Department of Computer Science
Lovely Professional University
Phagwara, India
ABSTRACT
This paper is based upon the type of software metrics available and their behavior on a piece of code in static environment and in run-time/ dynamic environment. Observing the current trend in the research in software metrics, it is noted that the work is majorly being carried in either using the metrics to evaluate the performance of any software or a source code, or in the path of creating some new metric, which is the blend of previous metric, but nothing much is been done in way of evaluating the performance of a metric itself and in order to find ways and methods to improve it. In this paper a similar approach is followed that leads to some factors that are responsible for the deviation of a metric results in static environment and dynamic/ run-time state.
General Terms
Performance Analysis, Comparative Study.
Keywords
Software metrics, Static environment, Dynamic environment, cyclometic complexity.
1.
INTRODUCTION
A Software in today’s world serves a bi-functional role of being a product of some process as well as of serving a vehicle to produce a new product. As a product it serves as a calculating potential in form of hardware or software and as vehicle it acts as platform for the control of systems, communication networks, creating tools and environments for development, evaluation[6]. Software engineering (SE) is the application of a systematic, disciplined, quantifiable approach to the development, operation, and maintenance of software, and the study of these approaches; that is, the application of engineering to software[1]. It is concerned with theories, methods and tools for professional software development. Software Engineering like all other engineering professions has metrics. Goodman (1993, 6) defines software metrics as: "The continuous application of measurement-based techniques to the software development process and its products to supply meaningful and timely management information, together with the use of those techniques to improve that process and its products". Software metrics can perform one of four functions. Metrics can help us Understand more about our software products, processes and services. Metrics can be used to Evaluate our software products, processes and services against established standards and goals. Metrics can provide the information we need to Control resources and processes used to produce our software. Metrics can be used to Predict attributes of software entities in the future[2].
Thus, incorporating metrics into software development process is a valuable step towards creating better systems. The practice of applying software metrics to a software process and to a software product is a complex task that requires study of the discipline, and which brings knowledge of the status of the process and / or product of software in regards to the goals to achieve. The software metrics depend on what software’s attributes we want to quantify or qualify, and Software complexity is an estimate of the amount of effort needed to develop, understand or maintain the code[7]. It follows that more complex the code is the higher the effort and time needed to develop or maintain this code.
2.
STATIC AND DYNAMIC ANALYSIS
PERSPECTIVES
Analysis is the process of breaking a complex problem into smaller parts and then analysing them to gain a better understanding of it. In the field of software engineering, the analysis in terms of the environment/surroundings is done in two ways: 1) Static Analysis and 2) Dynamic Analysis.
2.1
Static Analysis
Static analysis, as by the name depicts, means the analysis of the code in static environment. Static code analysis, is a method of computer program debugging that is done by examining the code without executing the program[3]. It provides the basic understanding of the structure of the code and this can help in ensuring the code to be of industry standards. Static analysis involves no dynamic execution and can detect possible faults such as unreachable code, undeclared variables, parameter type mismatches, uncalled functions and procedures, possible array bound violations, etc.[4]. The static analysis results are basically compiler generated errors, and the knowledge of these syntactical errors proves very useful during the debugging and maintenance work.
2.2
Dynamic Analysis
Dynamic analysis means the analysis of code in dynamic environment. A dynamic analysis measures the efficiency and effectiveness of software testing by monitoring the software system during its execution phase [5]. The objective is to find errors in a program while it is running, rather than by repeatedly examining the code offline. In this research also, we will be examining the code in dynamic state and then after comparing the values obtained with the values of static state and thus finding the factors.
3.
METHODOLOGY
that, this research is carried in three phases. In the First phase, the developed code is statically analysed over the selected metrics. In second phase, the same code is dynamically analysed using the same metrics used in static case. In third phase, when all the values from both the states are recorded, then those values will be used to determine the factors behind the deviation in results in both the cases.
Source code developed – Sales and inventory management system in C++.
Metrics to be used – LOC, Maximum complexity, maximum, depth, McCabe's Cyclomatic complexity, number of modules. In the first phase of analysis, the code is evaluated statically using two tools named, CCCC[9] (C and C++ code counter ) and source Monitor[10] on the various measures as specified above. In second phase, the same code is dynamically evaluated using D.U.M.A[11] (Detect Unintended Memory Access) and Understand[12] on the same measures. Then after in the third phase of the study, both the results from the first two phases is compared and the factors causing the deviation in the figures is appraised.
4.
BIFURCATING FACTORS BASED
ON EXPERIMENTAL RESULTS
As in the first phase, the initially developed code is statically analyzed, the output of the process is as follows[8] :
From figure 1, the values of static analysis performed on code are recorded, which figures out the number of modules in the code to be 5, with 480 lines of code and McCabe’s cyclometic complexity number to be 68 for the whole code.
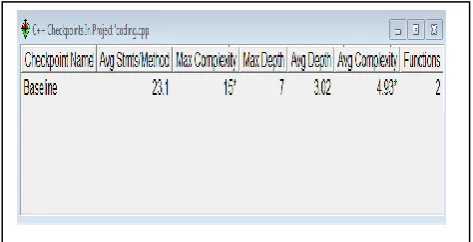
The figure2 shows the static analysis results from other tool and describes the value of maximum complexity to be 15, maximum depth of statements to be 7, average depth to be 3.02 and average complexity is recorded. The results obtained was used to draw a kiviat graph to unriddle the interrelation between the various factors and a block histogram to understand number of statements with similar the block depth.
A Kiviat diagram is used to graphically represent and compare multiple entities and then to evaluate them against more than two variables, which gives it an edge over other charting and graphing techniques. and a Block Histogram allows us to see distribution of numeric values in a data set. The x-axis is divided into 'bins' that correspond to value ranges. Each item in the data set is drawn as a rectangular block, and the blocks are piled into the bins to show how many values in each range.
Table 1: Metrics details for the written code.
Parameter Value
Project Name CODING.cpp
Checkpoint Name Baseline
Percent Lines with comments 1.8
Classes Defined 3
Methods Implemented per Class 4.00 Average Statements per Method 23.1 Line Number of Most Complex
Method 118
Maximum Complexity 15
Line Number of Deepest Block 375
Maximum Block Depth 7
Average Block Depth 3.02
Average Complexity 4.93
Functions 2
Thus the kiviat graph in Fig 3 depicts the inter-relation between %comments, Average complexity, Average Depth, Maximum Depth, Maximum Complexity, Average Statements per Method and Methods per class, formed from the above
Figure 2: Results obtained from toolSource Monitor.
Table 2: Number of statements corresponding to the block depth
Block Depth Statements
0 14
1 50
2 80
3 76
4 103
5 41
6 14
7 1
8 0
9+ 0
The Table 2, provides the information of number of statements with a particular depth of block, like, number of statements having block depth of 4 are 103, etc. Hence formulated block-depth histogram in Figure 4 is as under :
The second phase, i.e. dynamic analysis produces the results on the same code. The results of the analysis helped in drawing various kinds of graphs, which ultimately helped in
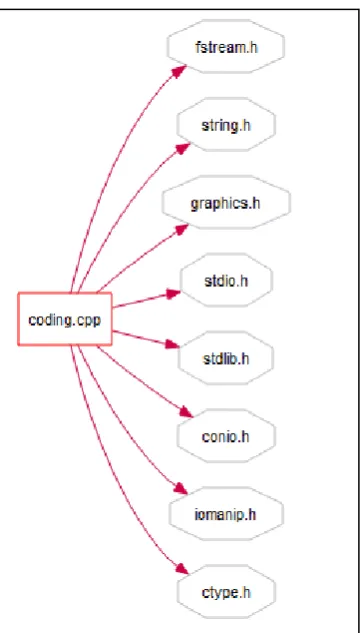
solving the enigma. By the analysis of the code a butterfly graph drawn is as under:
The butterfly graph in diagram 5, describes the header files being used in order at the time of execution of the program. The more closer view of execution explains the calling of functions and the carrying out of the sequence being followed by the program with the help of a cluster call internal graph. It show the function call graph, organized by file.
The Cluster call internal graph describes the order and the sequence in which the execution is taking place that how are the methods inside the code are originally being accessed as the uses is providing the input and is interacting with the program code.
The Cluster call internal diagram in diagram 6, depicts the actual implementation of program, as per the c++ norms and guidelines, the main method of the code being accessed first, then the control is forwarded to the select method of the code in which the user selects its category of being a buyer or the administrator, after that the control is either forwarded to the items section or the admin section as per the selection being made by the user during the selection time.
Figure 5: A Butterfly Graph
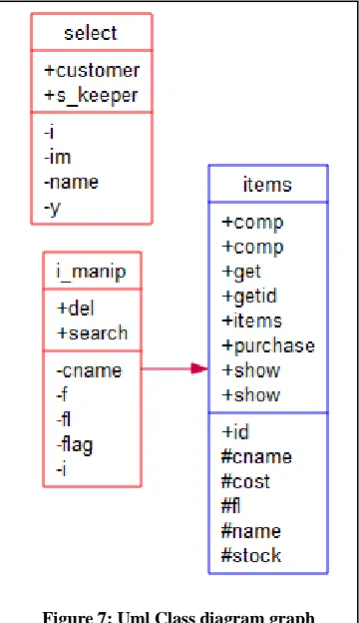
The internal analysis of the executing structure of the code describes the various components present in the various methods of the code, i.e. select, i_manip and items with the aid of a uml class diagram graph.
The uml class diagram graph in diagram 7, states the various functions under the three methods present in the code. Like the method select contains two options, that are customer and admin, i.e. shopkeeper. Similarly, the i_manip contains the two , delete and the search functions, and the items having the most, i.e. seven options as specified in Figure 8.
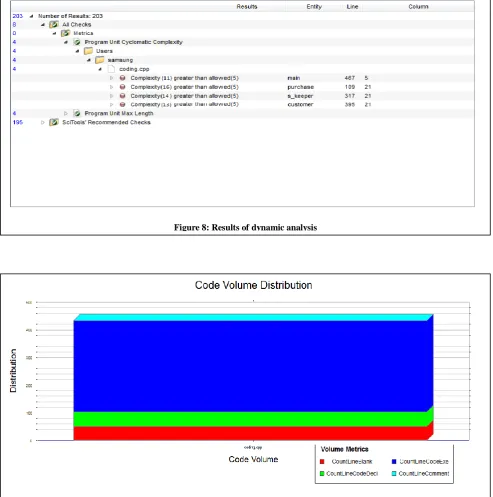
The results as specified in figure 8 determines the value of the complexity of the code in dynamic environment. As it can be
more than the allowed value (5) with the maximum complexity of 16 of the purchase module of the code followed by the s_keeper module of complexity 14, customer module of complexity 13 and main function with value 11. The code volume distribution graph of the code identifies the various sections of the code and their values, for example, the number of blank lines in the code depicted by the CountLineBlank, the number of lines used in for the declaration purposes in the code is stated by CountLineCodeDec and the total executable lines of code is stated by the CountLineCodeExe.
Table 3: Code volume distribution values CountLin
eBlank
CountLin eCodeDec
CountLin eCodeExe
CountLine Comment
Coding
.cpp 50 58 362 10
From the values as retrieved in the table 3, its crystallized that of the total line of code of 480, number of blank code lines is 50, total declarations made took 58 lines of the program code, and the total executable code lines , i.e. the main executable code in the program is 362 whereas, the commented lines are 10. From the results retrieved, a code volume distribution can be formulated as in figure 9, representing the relation of code volume with respect to the distribution. The cyclometic complexity factor of the code comes out to be 70, in case of the dynamic analysis.
Table 4: Cyclometic complexity of code
Sum Cyclometic Sum Essential
Coding.cpp 70 36
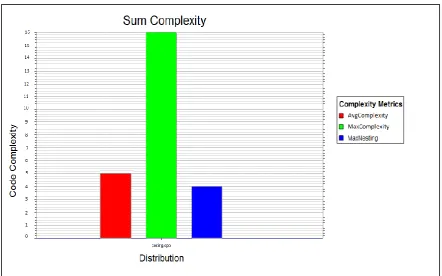
The values from table 4 can be used to draw a graph of distribution values with respect to the cyclometic complexity of the code. The graph is shown in figure 10, depicting the code cyclometic complexity to be 70 and SumEssential value to be 36.The other factor of the complexity generated the maximum value to be 16 and the average complexity value to
Figure 7: Uml Class diagram graph
be of 5 and maximum nesting values to be 4. The values representing the results are specified in table 5.
Hence using the values of the above table, a graph corresponding to the results is drawn which shows the interrelation of distribution with the complexity of the code. The graph is detailed in figure 11.
After deducing the results in both the environments now it’s the time to compare the results produced in both the cases. The major change came in the values of complexity and the cyclometic complexity. The comparative results are specified in the table 6.
Table 6: Comparative results of both states.
Static State Dynamic State
Average complexity 4.93 5
Maximum Complexity 15 16
Cyclometic complexity 68 70
From the values in table 6, it is very much clear that there is variation in the values of complexity as we go from a static state to a dynamic state. There can be various factors that can lead towards the variation of these values.
5.
FACTORS HELPING IN CAUSING
DEVIATION
Factors that leads to the variation in the results can be as follows:
1. Number of looping statements : Looping statements are the vital part of any program code. Very less program code are there that do not contains any looping statements. This is one of the reasons that produces a change in complexity values in dynamic environment as compared to the static environment. More the number of looping statements are there more will be the time taken to process the whole loops during the runtime state, and if more time is been taken upon that then that extra work done will also add some extra effort. This extra effort is in the end added to the complexity factor. Thus, therefore, there is increase in the complexity of code in run-time environment as compared to the static state.
2. Provision of User inputs : when a code is analysed in a
static environment, it is analysed on the basis of the statements and code, i.e. no user interaction is there at that stage. But when a code is dynamically analysed, it is analysed during the runtime, i.e. with the user interation and the user inputs. When run-time environment is involved, then there can be some input errors, runtime errors, etc. and the code behavior will be soully dependent upon the user inputs. Hence as the number of inputs can vary and so as depending upon the inputs, the program behavior can also vary, thus, due to these varying of behavior and various runtime errors encountered, the complexity tends to increase.
3. Coupling : Coupling is the degree to which each program
module relies on each one of the other modules. During the static state, the coupling values are specified only as the interdependency of the code, in which the actual amount is not known , that how much is the fuctions interdependent, what is the degree of dependency,etc. but during the run-time, actuall value is known, and with the increase in the inputs and the values the coupling increases, thus increasing the complexity value. More is the coupling, less is the cohesion and more is the complexity as more time will be taken to process the results as the functions will be more interdependent and after the completion of first function only, the second function will be taken to execution, hence increasing the total execution time and oncreasing the complexity.
4. Effective statements executed : In a program code, there
are number of such functions that can be called recursivelly, during a run-time state. The number of times the function will be called and processed recurcivelly depends upon the user and user input. This recursive calling cannot be determined in static evaluationof the code. Thus, this factors is not fully included while fetching the values in static environment, therefore, the complexity in static state is less as compared to the dynamic run, where the total number of how many time was the function called is known.
5. Modular structure : No doubt that the more number of
modules increases the the flexibility of the code and increases the reusability of the program, but it also accounts into adding on the cost in terms of increased need of memory space and
extra time for execution because some modules may partly repeat the task performed by other modules[13]. The static state evaluation of the code onlyprocess the code lines and modules, but do not processes the work done in all the modules, that whether work is being repeated or not, but in run time environment, as the whole code is procesed, thus all the work is checked, and the repeated work adds to the extra effort, hence, increasing the complexity of the code in dynamic environment.
6.
REMEDIES TO MINIMISE THE
DEVIATION
All the factors described in previous point are responsible for the increased work done in terms of time, space and complexity in the dynamic state of the analysis as compared to the static state analysis. Though all the factors cannot be overcomed, but some points can be kept into mind in order to reduce the run time complexity of the code and keep it as closer as possible to the static values of the code. Some of the recommendations are :
Though we cannot avoid including the looping statements into the code, but their number can be reduced by using a wrap function and then calling that wrap function which extracts the data from the result set which handles the null or change the query so it doesn't return nulls. Hence by this way the added complexity of the looping statements can be reduced and overcomed, thus, enhancing the performance attribute of the code.
The run time complexity can also be reduced by providing more refined inputs and avoiding the input errors, as errors will reduce, thus, they will ultimately reduce the complexity. also during the code writing, the modules created should be of a specific length, if there are more modules with less number of instructions under them then it also accounts into increased complexity, because it will increase the inter-modular communication cost. Coupling is also one of the needed attributes of the
code, but it must be kept in mind while writing the code that, the value of content coupling must be less, because if the value of content coupling is high, then it will mean that there is larger interdependency of the information, hence, more resources will be needed to process, thus increasing the complexity.
The above factors were some remedies of reducing the gap of complexity values between static and run-time environment.
7.
CONCLUSION
run-time or dynamic environment. Various factors are obtained during the research study and the alternative remedies were also proposed along with. Various conclusions that can be drawn from the experimental research conducted are :
1. The run-time facilities, like user input, user control, etc. are the basic factors leading to the deviation in the results. 2. The structure of the program along with the kind of input given also effects the results.
3. If one thing is giving benefit at one place, then it is also adding some cost at other place, for eg : the modular structure do adds the benefit of the increased readability, flexibility, and usability, but it also increases the complexity at run time. 4. Although all the factors cannot be overcome, but still some remedies can be kept in mind while writing the program code and operating with it.
8.
FUTURE SCOPE
There is a very wide future scope of this research, a more complex code with large codebase and more complex modules can be used to analyze and determine more factors that can cause the deviation in the results.
The factors deduced in the study are not the only factors as other properties of the code are not included in the study, so the future analysis should include some more factors like coupling, cohesion, etc. with more complex codebase and should be tested on multiple number of tools to figure out some more factors.
9.
REFERENCES
[1] Pierre Bourque and Robert Dupuis(2004). Guide to the Software Engineering Body of Knowledge -
2004 Version. IEEE Computer Society. pp. 1–1. ISBN 0-7695-2330-7.
[2] Robert W. Carroll, “Project management and process improvement through software metrics”, http://www.gisdevelopment.net/proceedings/gita/19 99/system/sa002pf.htm.
[3] Hilda B. Klasky ( 2003 ). A Study Of Software Metrics, issued by Graduate School-New Brunswick Rutgers, The State University of New Jersey [4] Muzamil Jah ( 2008 ). Software Metrics – Usability
and Evaluation of Software Quality, issued by Department of Technology, Mathematics and Computer Science, University West.
[5] Varun Gupta ( 2010 ). Object-Oriented Static and Dynamic Software Metrics for Design and Complexity, issued by Department of Computer Engineering National Institute of Technology, Kurukshetra.
[6] Roger S Pressman (2001), Software Engineering: A Practitioner's Approach, fifth edition, Published by McGraw-Hill.
[7] Kamaljit Kaur, Kirti Minhas, Neha Mehan, and Namita Kakkar(2009). Static and Dynamic Complexity Analysis of Software Metrics. World Academy of Science, Engineering and Technology 56 2009.
[8] Rohitt Sharma, Paramjit Singh, Sumit Sharma (2012). An Approach Oriented Towards Enhancing A Metric Performance. Vol. 4 No. 05 May 2012, pp: 743-748
[9] http://cccc.sourceforge.net/
[10]http://www.campwoodsw.com/sourcemonitor.html [11]http://duma.sourceforge.net/