1. Introduction
The increasing demand of the refrigeration and air conditioning lead to increase in energy consumption and worldwide economic growth. Therefore, conventional vapor compression refrigeration systems were commonly used. This system is very popular because of their small size, low weight and higher performance value. However, there are two common issues for the conventional refrigeration system are environmental and energy issues. Global warming potential (GWP) is an environmental problem caused by the over concentration of greenhouse gases (carbon dioxide, nitrous oxide, water vapour and methane) in the earth's atmosphere. The gases GWP cause the increase of the average atmosphere temperat. of the earth when solar radiation passing through the earth atmosphere trapped by the greenhouse gases before it escapes to the outer
atmosphere. Other environmental problem is Ozone Depletion Potential (ODP), chlorofluorocarbons used as refrigerants in vapour compression systems lead to the destruction of ozone molecules as ODP substance. Hydrochlorofluorocarbon (HFC) and chlorofluorocarbons (CFC) have been limited in Montreal in 1988 and in Kyoto in 1998 conventions, which are most accountable for ozone layer depletion and global warming problems [1, 2]. According to the survey, it is evaluated that energy consumption will be increased about 71% in 2030. About 80% of energy on earth comes from fossil fuels. Therefore, the awareness on decrease fossil fuel resources, remote area problems and environmental issues leads to development toward new technologies. Use available energies like wind, solar, biomass, hydropower, geothermal energies, or thermal waste from various process can be
Click here, type the title of your paper, Capitalize first letter of each words
First Author
a, Second Author
b,*aFirst affiliation, Address, City and Postcode, Country b
Second affiliation, Address, City and Postcode, Country
Journal of Solar Energy Research Vol 1 No 1 (2016) 13-22
Journal of Solar Energy Research (JSER)
Journal homepage: jser.ir
A B S T R A C T
Click here and insert your abstract text. Click here and insert your abstract text. Click here and insert your abstract text. Click here and insert your abstract text. Click here and insert your abstract text. Click here and insert your abstract text. Click here and insert your abstract text. Click here and insert your abstract text. Click here and insert your abstract text. Click here and insert your abstract text. Click here and insert your abstract text. Click here and insert your abstract text. Click here and insert your abstract text. Click here and insert your abstract text. Click here and insert your abstract text. Click here and insert your abstract text. Click here and insert your abstract text. Click here and insert your abstract text. Click here and insert your abstract text. Click here and insert your abstract text. Click here and insert your abstract text Click here and insert your abstract text Click here and insert your abstract text Click here and insert your abstract text Click here and insert your abstract text Click here and insert your abstract text Click here and insert your abst
© 2013Published by University of Tehran Press. All rights reserved.
ARTICLE INFO Received:
Received in revised form: Accepted:
Available online:
Keywords:
Type 3-6 keywords here,
separated by semicolons ;
Modelling of Solar Adsorption Refrigeration System in Nasiriya City
R.M.Hannun
*, Z.A.Lafta
Mechanical Engineering department, College of Engineering / Thi-Qar University. *E-mail: [email protected]
Journal of Solar Energy Research (JSER)
Journal homepage: www.jser.ut.ac.ir
A B S T R A C T
The paper presents study the factors that can improve the performance of an activated carbon/methanol intermittent solar adsorption icemarker. That uses an adsorption tube collector for cooling, in which solar energy can be directly absorbed. Effect of some important parameters, such as amount 8of methanol, condenser temperature initial and peak collector temperature on the system performances were investigated. The amount of activated carbon is fixed and is equal to (4 kg) for all the experiments that have been performed. Several quantities of Methanol were tested (650 g, 750g, 900g) to get the best system performance. The experimental test rig of present work was designed to produce 2 kg of ice by using Activated Carbon in a concentration of 0.28 kg Methanol/kg Activated Carbon. The shape of the flat plate type adsorber/collector was parallelogram with dimensions (110 cm× 67 cm×8 cm). The results show that the coefficient of performance of the unit decreases with increase the condenser and evaporator temperature. The new in this paper that the maximum average of COP was 0.49 but the minimum was 0.4 that agree with literature experiments in this field.
© 2016 Published by University of Tehran Press. All rights reserved.
ARTICLE INFO
Received: 10 June 2016 Received in revised form: 23 August 2016
Accepted: 25 August 2016 Available online: 27 Aug 2016
Keywords:
effectively utilized for achieving the demand of energy demands [3]. The first method of artificial refrigeration was demonstrated by Prof .Dr. William Cullen at the university of Glasgow in 1748 [4].Cullen used a pump to create a partial vacuum over a container of diethyl ether which then boiled, absorbing heat from the surrounding air. William succeeded in producing a small amount of ice. In 1805, American inventor, Oliver Evans, designed but not built a refrigeration system based on vapour- compression [5]. Critoph,1988, studied the performance limitations of adsorption cycles for solar cooling and concluded that, generally activated carbon methanol combination was preferable for solar cooling to gives the best coefficient of performance, with 0.5 being possible in a single-stage cycle.[6] Amar Sadoon, 2006, presented a research about solar adsorption icemaker by using flat plate type adsorber/ collector. The mass of active carbon was and the mass of methanol was under operating press. . The minimum temperat. of evaporator was oC and coefficient of performance COP of system was 0.39, these result under atmosphere temperat. 38° [7]. Watheq Said, 2008 designed the solid adsorption solar cooler used granular activated carbon and methanol as the adsorbent /adsorbate pair (0.26 kg methanol / kg activated carbon). The system has three important components: collector/adsorber, condenser and evaporator, used a flat plate type collector with effective exposed area of 0.95 m². The unit produced chilled water at temperature. around 10°C and the optimum heating period was found to be at least 5 hours, while the cooling period was more than 10 hours.[8] Hassan Fadiel, 2008, presented a research about theoretical and experimental study of a hybrid adsorption refrigeration system. The result showed that the COP about 0.31 when the concentration of methanol in activated carbon was
, and the system can chill one
litter of water from an initial temperat. of 35℃ to evaporator temperat. oC with formation of thick ice around the evaporator when mass of active carbon was 1.25 kg [9]. A solar adsorption
refrigeration machine was developed in 2014 by Mohand Berdja et. al., the thermal COP of the prototype equal to 0.49 depending thus on the energy absorbed in the collector/adsorbor and the refrigerating effect. While it equal to 0.081 depending on the solar radiation and the refrigerating effect [10]. Hadj Ammar et al, 2015, presented a simulation and optimization of a tubular solar collector/adsorber destined for an adsorption refrigeration system. The system used activated carbon–methanol as a working pair. They found that the optimal adsorber tube diameter was equal 0.118m corresponding to a number of 8 tubes for filling 1 collector by about 38.59kg of stone coal, and the COP 0.21 when used double glazed cover for the collector.[11]
2. Materials and Methods
2.1. Thermodynamic modeling
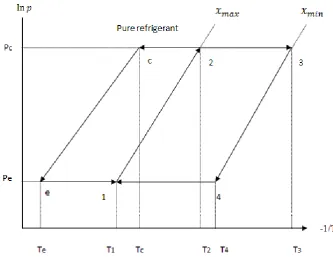
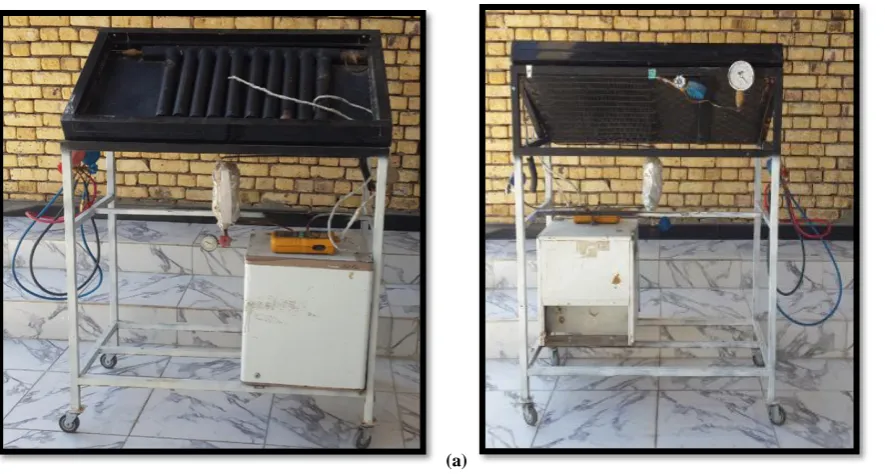
The adsorption refrigeration system consists of three parts: solar collector/adsorbent bed, condenser and evaporator, Fig (1). The operating cycle of the system has four processes, shown in the Clapeyron diagram in Fig. (2). The heating process 1-2, the desorbing process 2-3 , the cooling process 3-4 and adsorption process 4-1. During the heating process, the adsorbent bed receives heat from the solar energy lead to raises the temperat. of the pair of adsorbent /adsorbate as shown in Fig. 3.2 by line 1 -2 with constant concentration of the adsorbate
. When the press. of the adsorbent bed reaches the condenser press., the adsorbate vapor diffuses from the collector and condensed in the condenser desorption process occurs as line 2-3. In addition, the concentration
of the adsorbate reaches the minimum value at the end of desorption process. This process is followed by cooling the generator, line 3 -4. Then, the liquid adsorbate flows from the condenser to the evaporator. Next, the adsorbent adsorbs the refrigerant that is coming from the evaporator line 4-1, (at evaporator press.). The result, the liquid water in evaporator becomes cold or
Fig. 1. Schematic diagram of the solar adsorption refrigeration system
Fig. 2. The P-T-X (Press.- Temperat.- Concentration) diagram of the ideal simple adsorption.
From Fig. 2 above, the state points 1-2-3-4-1 represents an idealized combined cycle, 1-2-3-4-1 represents the path of adsorbent along with the adsorbed adsorbate while 1-2-c-e-1 represents the path of desorbed adsorbate.
THEORETICAL ANALYSIS
The vapor press. P of methanol in a limited temperat. range is described by Exell et al. 1987 [12].
(1)
(2)
(2) Another expression of Dubinin-Astakhov equation is
driven by using the relationship between saturation pressure and temperature [13].
( )
(3) Where and are constants.
For methanol, according to Eq. (1), A and B can be determined by the following expressions:
(4a) And
(4b) Similarly, the pressure-temperature relationship of an adsorbate can also be simply expressed as:
( ⁄ ) (5) To determine a and b (the intercept and the slope for a constant mass concentration line on the vs diagram respectively), rewrite D-A
(Dubinin-Astakhov) equation as:
Where C= ( )
Compare with equation (5) yields: And
With a series of a and b, a set of lines for a particular adsorbate/adsorbent pair can be drawn in the …. – ( ) Diagram.
Latent heat describes the amount of heat that must be added to a substance in order to induce a phase transition. With assumption that the specific volume of the gas is much greater than specific volume of the liquid, the specific volume of the liquid is negligible, and if the press. is low enough for the gas to be treated as the ideal gas [14, 15].
( ⁄ )
(6)
: The latent enthalpy of the liquid to vapour phase
transformation.
For gas adsorption equilibrium, the analogous equation for adsorption:
( ( ⁄ ))
(7)
The subscript signifies that the derivative is taken at constant concentration adsorbed. The heat of adsorption is a function of the concentration .
Where
h
fg andh
ad can be obtained from the slopes of the equilibrium lines for the p. refrigerant and for a constant concentration x on the lnP vs (- 1/ T) diagram.Comparing equation (7) with equation (5) yield:
(8) The heat of adsorption is just the multiplication of
the slope b of a constant concentration line on ( ) vs (-1/T) diagram and the specific gas constant of methanol ( ). The efficiency in cooling system is called the "coefficient of performance". It is generally the ratio of the cooling effect to the heat input. In other words, how much energy that can be removed from a cold space ( ) for each unit of energy expended ( ).
(9) and are the cooling effect and collector generation heat, respectively.
Thermodynamic analysis
The adsorption cycle consists of four processes as follows:
Heating Process 1—2:
In this process, the concentration of methanol in the adsorbent bed remains constant at maximum value ( ). The temperature rises from to , and the
press. of the refrigerant in the adsorption bed rises from
to pc , generally we assume that desorption doesn’t occur until the press. reaches pc. As shown by line 1 -2, in Fig.(2). The heat absorbed from solar energy is utilized to heat up both activated carbon and methanol. Then, the heat addition is expressed as: [16]. (10)
(
)( ) Where:
: The mass of absorber metal (kg). : The maximum concentration of methanol.
: The mass of adsorbent (activated carbon) (kg). : The specific heat of activated carbon (J/kg.K).
: The specific heat of the metal of absorber
(J/kg.K).
: The specific heat of methanol at constant
volume (J/kg.K).
: The minimum adsorption temperat.. : The starting desorption temperat..
(11)
( ) ( )
DESORPTION PROCESS 2—3:
The desorption process is represented by the line (2-3) in Fig. (2). The adsorbent inside the bed is continually heated pending its temperature reaches the maximum desorption temperature (the press. inside the system increases as well). At the same time, the adsorbed refrigerant is desorbed. Therefore, the concentration of methanol in the activated carbon decreases to minimum value ( ). The heat provided during this
process can be written as:
(12)
(
) ( )
( )
Where:
: The maximum desorption temperat..
: The minimum concentration of methanol. : The specific heat of methanol at constant press.
(J/kg.K).
The press. and the specific volume of the saturated liquid.
(13)
[ ( )]
[ ] (
)
( (
) ) ( ( ) )
( ( ) )
(14)
COOLING PROCESS 3-4:
It is similar with the heating process; the adsorbent bed in this process is cooled down by means of atmospheric air. Therefore, the temperat. dropped from to as well as the press. of the refrigerant being
reduced from to when the concentration of
methanol remains constant but at the minimum value as shown by line 3-4.
REFRIGERATION PROCESS 4-1:
This process (line 4-1) is responsible on the vaporization of methanol from evaporator to be adsorbed by activated carbon. The adsorbent will adsorb the refrigerant inside the evaporator, and the evaporating press. Will control press., this process will be completed when the adsorbent is restored to the state1. The net cooling effect is:
(15)
[ ( ) ]
(
) (
)
Where:
: is the latent heat of liquid-vapour transition at
evaporator temperat.
Maximum concentration at T= and P=
[ (( ( ( ) ) ( )) ] (16)
While, minimum concentration at T= and
P=
[ (( ( ( ) ) ( )) ]
(16b)
2.2 EXPERIMENTAL WORK
The experimental test rig of present work is designed to produce 2 kg of ice by using 4 kg of Activated Carbon in a concentration of 0.28 kg Methanol/kg Activated Carbon.
The system consists of three main components as shown in fig. (3):
(a)
SOLAR COLLECTOR
The collector is the main part of the system, which acts as a compressor in the vapour compression unit, and as generator and absorber in the absorption refrigeration systems. For the flat-plate solar collector, the collector and adsorbent bed are often designed into an integrated shape to enhance heat transfer. The shape of the flat plate type adsorber/collector was parallelogram with dimensions (110 cm× 67 cm×8 cm). Generally the collector consists of some components as adsorbent bed, glaze cover, absorber metal and insulation material. The adsorbent (activated carbon) is the solid porous media, which desorbs and adsorbs the vapour of adsorbate (methanol). The bed consists of 10 copper tubes, each one has outer diameter equals 5 cm and 2 cm for inner pass tube and 50 cm long arranged side by side, the ends of all tubes were cut in half circle hole. The surface area
of the adsorbent bed nearly 0.737 . The total amount of carbon that can be filled in the generator/collector tubes is 4kg (400 g in each one), then the ten copper disk cover of the tubes by soldering from the bottom. With a small opening in each lid for the purpose of replacing the carbon which then install nut in each tube where it can be opened easily when carbon changing. The activated carbon is placed in an annular space between a two coaxial collector pipes, the external tubes are covered with black coat to increase the absorptivity at their surfaces. And the inner tubes was drilled with holes smaller than the granules to ens. the flow of methanol vapour with all activated carbon granules and to avoid press. drops and temperat. differences along the collector tubes as well.
CONDENSER
The main purpose of the condenser is converting the high pressurized and heated vapor to the liquid form by transferring the observed heat to the surroundings. The condenser is tilted by small angle from horizontal to prevent any collection of condensate in the condenser. This part is very important to control on condensing process. The condenser must be placed in shadow areas and avoid having it heated by the sun. Condenser is made from 14 tubes with 50 cm length and 0.625 cm diameter metallic tubes, it coupling with 136 fins to increase area of heat transfer to air. The air cooled condenser was chosen because it was easy to manufact. , do not need a large space and it economical.
EVAPORATOR The evaporator is used for vaporizing the refrigerant
by transferring heat from surroundings (mainly from the refrigeration desired space) to the refrigerant liquid, which it contains. The evaporator is made of a copper pipe 2 cm diameter and 2.3 m long-which is enough for small quantity of water, and the pipe was formed in a helical shape to ins. a direct contact with water (about 2 lit). Inside these pipes the refrigerant (methanol) is allowed to boil under very low press. conditions. The evaporator put inside a plastic cooler box was (43 43
47) for insulation, and then the evaporator is connected to the generator with 0.625 cm diameter pipe. The important factors affecting on the performance of the evaporator is the evaporator press. and through which can set the system's work when press. is less than (4 kPa) using the system to freeze, but if the evaporator press. is greater than (4 kPa) then use the system for cooling.
3. Results & Discussion
The system was tested for two months, May and June; during which, more than ten experiments were performed to study the effects of several variables on system performance including solar collector temperat. and the amount of methanol in the system. The amount of activated carbon is fixed and is equal to (4 kg) for all the experiments that have been performed. Several quantities of Methanol were tested (650g, 750 g, and 900 g) to get the best system performance.
Fig. 4. The variation of collector temperature, pressure and ambient temperatures (23 May 2016) Fig. 5 shows the change in temperature at the inlet
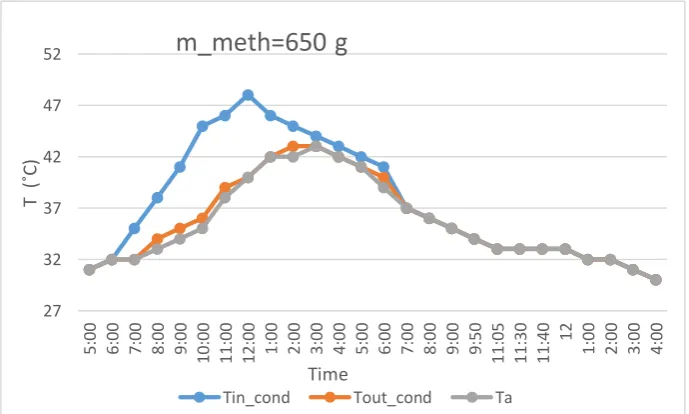
and outlet of condenser and the change of ambient temperature with time. The temperature lines are coinciding at early morning between (5-6) a.m. because there is no effect of solar temperature on the system and no evaporation of refrigerant inside the evaporator (30-32) º C. After this time, the temperature begins to utilize the collector and absorbed by methanol inside and rise the temperature gradient to evaporate it. Therefore, there is a temperature difference between the condenser inlet and outlet according to this cause. So, it is observed that no change in ambient and outlet temperature of condenser between the second and third hour of measurement at morning
(7-8) a.m. since high effectiveness of condenser with low temperatures. The difference between the inlet and outlet temperature reaches the maximum value at 10 a.m. as a result to high temperature consumed by the collector to go to condenser but low temperature of condenser outlet since the condenser effectiveness is high with low temperature but that was narrow curves distances with continue to 12 a.m. (mid- day between the sunrise and sunset time). These values continue to be more narrow at the second part of day since the ambient temperature is high that affect the outlet of condenser to be the same or lower than the condenser outlet temperature.
Fig. 5. The variation of inlet and outlet condenser, ambient temperatures and Pressure
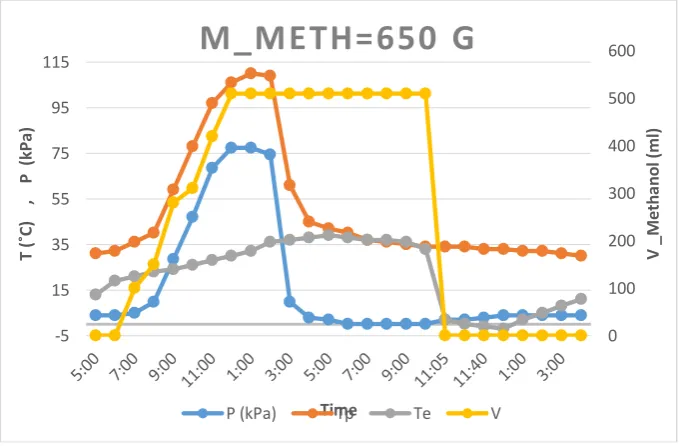
From fig. (6) can be observed that the methanol begins to condense after 7 a.m., when the temperature of methanol was (40 º C) its press. was equal to (5kPa) and the ambient temperature was (33 ºC). With the generator press. increased, the amount of methanol condensate was increases up to the highest value at noon, where has been
intensified (540 ml) and then stop the process of condensation due to the low amount of methanol in the solar collector to the lowest amount; at this time the valve between the collector/adsorber and condenser was closed to avoid return the methanol to the collector/adsorber, at (10 pm) the valve connecting the condenser and evaporator was 0 50 100 150 5: 00 7: 00 9: 00 11 :0 0 1: 00 3: 00 5: 00 7: 00 9: 00 11 :0 5 11 :4 0 1: 00 3: 00 T (˚ C) , P ( kP a) Time
M_METH=650 G
P (kPa) Tp Ta
27 32 37 42 47 52 5 :0 0 6 :0 0 7 :0 0 8 :0 0 9 :0 0 1 0 :0 0 1 1 :0 0 1 2 :0 0 1: 00 2: 00 3 :0 0 4 :0 0 5 :0 0 6 :0 0 7 :0 0 8 :0 0 9 :0 0 9 :5 0 1 1 :0 5 1 1 :3 0 11 :4 0 12 1 :0 0 2 :0 0 3 :0 0 4 :0 0 T ( ˚C ) Time
m_meth=650 g
opened, and note that the methanol pulls heat from the water inside the refrigerator box and turn into vapor during the short period, while the evaporator temperature was drop from (34º C) to (5º C) at (11 pm), then temperature drop continues to reach (0
ºC) at midnight. Therefore, the concentration of condensed methanol (black line) increases with time from the morning to maximum value at 1 p.m. to be constant
Fig. 6: The variation of generator, evaporator temperatures, pressure. and methanol concentration with the time
Fig. (7) represents the temperature change of the generator, ambient and the glass cover. At 7:30 am the temperature of collector starts to increase due to increase the ambient temperature to reach the maximum value at 2:30 pm. Also can be seen that the highest temperature of the glass cover is (85 º
C) was recorded at 1 pm, then at 3 pm the glass cove removed from the collector .At this time the temperature of the collector decreased due to remove the glass cover and decrease the ambient temperature.
Fig. 7. The variation of generator, ambient and glass cover temperature with time. 0 100 200 300 400 500 600
-5 15 35 55 75 95 115
V
_M
et
h
an
o
l (
ml
)
T
(˚
C)
,
P
(
kP
a)
Time
M_METH=650 G
P (kPa) Tp Te V
0 20 40 60 80 100 120
5
:00
6
:00
7
:00
8
:00
9
:00
10
:00
11
:00
12
:00
1
:00
2
:00
3
:00
4
:00
5
:00
6
:00
7
:00
8
:00
9
:00
9
:50
11
:05
11
:30
11
:40 12
1
:00
2
:00
3
:00
4
:00
T
(˚
C
)
TIME
M_METH=650 G
Author name / JHMTR 00 (2013) 000–000 22
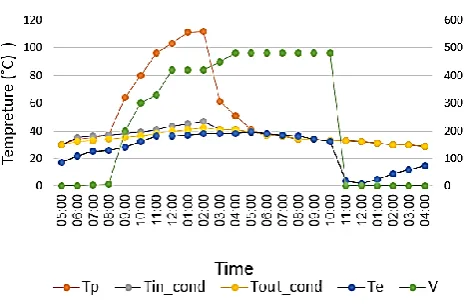
Fig. (8) represents the variation of generator, inlet and outlet condenser, evaporator temperatures, and methanol concentration with the time (in 4/6/2016). It is noted from this fig. that methanol begins condense at eight o'clock in the morning; Nasiriya time; and becomes increase with time to reach the maximum value at 5 pm then stop the condensation process because of the low amount of methanol in the collector , at this time the collector disconnected from the condenser. When connecting the evaporator with collector at 10 pm the temperature of the evaporator drop from 35 ºC to 7 ºC then to 2 ºC for short time.
Fig. 8. The variation of generator, inlet and outlet condenser, evaporator temperatures and methanol concentration with time
4. Conclusions
Many conclusions can be derived from this study: ●Using of removable glass cover was very useful tool in cooling solar collector and the disposal of latent heat in it which leaded to press. drop at night and thus increase the efficiency of the system.
●The experimental data demonstrated that the refrigerator has a capacity to cool down a mass of 2kg of water from 35 ˚C to 0˚C in the cooling box, when the mass of active carbon was 4 kg.
References
[1] Piyush Patil, Anindita Roy and H.U.Tiwari. (2015). Modelling and simulation of adsorption refrigeration system using low grade thermal energy. International Engineering Research Journal (IERJ) Special Issue 2 Page 351-355.
[2] I Made Astina, Wimonnad Charote, Lonn Sophal, Prihadi S, Darmanto, H.Sat. (2013). Fundamental Experiment of Active Carbon+Methanol for Adsorption Refrigeration System. International conference on fluid and thermal energy conversion.
[3] Fernandes M.S., Brites GJVN., Costa J.J., Gasper A.R. and Costa V.A.F. (2014). Review and fut.
trends of solar adsorption refrigeration systems. Renewable and sustainable energy, 39, 102-123.
[4] Nilesh Pawar, Dnyaneshwar Pawar and Dayanand Gorabe. (2014). Theoretical Investigation of Refrigeration System for Rapid Cooling Applications. International Journal of Engineering, Business and Enterprise Applications, 7(1), 95-98.
[5] Douglas G. Parbery. (2015). Daniel McAlpine and the Bitter Pit. University of Melbourne Blackburn, VIC, Australia. Springer International Publishing Switzerl.
[6] R. E. Crttoprt. (1988). Performance Limitations of Adsorption Cycles for Solar Cooling. Solar Energy, 41(1), 21-31.
[7] Amar Sadoon. (2006). Design, built and performance study on adsorption ice maker. M.Sc. Thesis, Iraq.
[8] Watheq K. Said. (2008). Solar energy refrigeration by liquid-solid adsorption technique. M.Sc. An-Najah University, Nablus – Palestine.
[9] Hassan Jawdat Fadiel. (2008). Theoretical and Experimental study of a hybird adsorption refrigeration system. M.Sc. Thesis "solar energy".
[10] Mohand Berdja, Brahim Abbad, Ferhat Yahi, Fateh Bouzefour, Maamar Ouali. (2014). Design and realization of a solar adsorption refrigeration machine powered by solar energy. Energy Procedia, 48, 1226 – 1235.
[11] M.A. Hadj Ammar, B. Benhaoua and M. Balghouthi. (2015). Simulation of tubular adsorber for adsorption refrigeration system powered by solar energy in sub-Sahara region of Algeria., 106, 31–40.
[12] Ying You, Dip. (2003). Solar Adsorption Refrigeration System Operating at near atmospheric press. A thesis Doctor of philosophy.
[13] Smith, J.M., H. C. Van Ness and M. M. Abbott. (2001). Introduction to Chemical Engineering Thermodynamics., sixth Edition, McGraw-Hill, New York.
[14] Zalman Lavan, Ali Hajji and William M.Worek. (1988). Research and development of solar powered desiccant refrigeration for cold storage applications. final Report. By Illinois Institute of Technology Chicago, Illinois and Asian Institute of Technology Bangkok, Thailand.