http://www.ijcmph.com pISSN 2394-6032 | eISSN 2394-6040
Original Research Article
Socio-demographic and socio-economic profile of tribal communities in
East Godavari district, Andhra Pradesh
Sravana Kumar Gutta
1, Sowmyasudha Kothapalle
2*, Krishnababu Goru
3,
Satyanarayana Kadali
4INTRODUCTION
Article 366 (25) of the Constitution of India refers to Scheduled Tribes (ST) as those communities, who are scheduled in accordance with Article 342 of the Constitution.1 Tribal’s in Andhra Pradesh constitute 5.7% of total tribal population of india.2 Scheduled Tribes live in unique physical, socio-economic and cultural environment, isolated from general population. Scheduled tribes are mainly the indigenous population in
India Government of India identifies as socially and economically backward and in need of special protection from social injustice and exploitation.3 The Government of India identifies communities as scheduled tribes based on a community’s “primitive traits, distinctive culture, shyness with the public at large, geographical isolation and social and economic backwardness with substantial variations in each of these dimensions with respect to different scheduled tribe Communities.4,5
ABSTRACT
Background: Scheduled tribes live in unique physical, socio-economic and cultural environment isolated from general population. The tribal population is at a higher risk of under-nutrition and Malaria, because of the socio-cultural, socio-economic and environmental factors influencing health seeking behaviour. We made an attempt to study the socio demographic economic variables in the tribal communities of East Godavari district.
Methods: A pre-tested questionnaire containing information on household socio-economic and demographic particulars like type of family, religion, caste, age, gender, income, literacy and occupation, was administered by paying house to house visits. All the data were entered into excel sheets and analyzed by using SPSS software 17.
Results: 59.25% were literates. 56.25% belongs to monthly income less than 773 rupees i.e. class-5, 74.29% are living in nuclear families. 48.55% belongs to Konda Reddy community. 56.69% have access to mineral water supply. 89.78 – 98.94% does not have toilets in their houses. 43.39% of the respondents have cattle sheds near to their houses.
Conclusions: More than half of the tribal’s needs to improve their socio-demographic and socio-economic conditions. Still it needs construction of community toilets or individual toilets in tribal areas.
Keywords: Schedule tribes, Socio-demography, Socio-economic, ITDA
1
Associate Professor, Department of Hospital Administration, Narayana Medical College and Hospital, Nellore, Andhra Pradesh, India
Department of Community Medicine, 2Assistant Professor, A. C. S. R. Government Medical College, Nellore,
3
Professor and HOD, Rangaraya Medical College, Kakinada, Andhra Pradesh, India
4
PODTT, East Godavari District, Andhra Pradesh, India
Received: 01 May 2019
Revised: 15 May 2019
Accepted: 16 May 2019
*Correspondence:
Dr. Sowmyasudha Kothapalle, E-mail: [email protected]
Copyright: © the author(s), publisher and licensee Medip Academy. This is an open-access article distributed under the terms of the Creative Commons Attribution Non-Commercial License, which permits unrestricted non-commercial use, distribution, and reproduction in any medium, provided the original work is properly cited.
ST are enumerated in 30 Indian States/UTs and the number of individual ethnic groups notified as ST are 705. Tribal communities differ from other communities owing to their languages, economic activities, social structure, traditional beliefs, practices and distinct cultural background. Economic and education level of the tribes varies from tribe to tribe. Socio-economic and demographic characteristic of a population depends upon its social and cultural practices and place of residence. Tribal communities live in various ecological and geo-climatic conditions ranging from plains and forests to hills and inaccessible areas. Tribal groups are at different stages of social, economic and educational development. While some tribal communities have adopted a mainstream way of life, at the other end of the spectrum, some are still at primitive stage.6-8
East Godavari district, known as the rice bowl of Andhrapradesh with lush paddy fields and coconut groves. The district is situated between 63.0I and 180 N latitude and 81030I and 82036I E longitude. It is bounded in the north by Vishakhapatnam district, South by Bay of Bengal, state of Orissa in the East, and in the West by Khammam and West Godavari districts. It is spread over an area of 10807.7II sq.km. The district comprises of 60 mandals out of which 7 are within the agency tract, which are under the administrative control of ITDA (Integrated Tribal Development Agency), Rampachodavaram. Most of the agency area is hilly and covered with dense forest. In East Godavari district population consist 54, 51,549. Among this tribal people are 2.5 lacs (2, 56,749). Among 103 PHCs in East Godavari district 18 were tribal PHCs which are present in 7 Mandals of agency track.9 we made an attempt to study the socio demographic economic variables in the tribal communities of East Godavari district.
Objectives
To study the socio-demographic and economic profile in tribal population.
To study the basic amenities in tribal villages.
METHODS
A cross sectional study was undertaken from tribal areas of East Godavari district for a period of one year in 2013. Rampachodavaram is the head quarter of tribal area where ITDA is located. All these areas are difficult to reach. Most of the villages are surrounded by fields and dense forest. More often we need to walk long distance to reach the villages. The major tribal communities in East Godavari include the following. Konda Reddy -40%, Koya Dora-35%, KondaKammara-12%, Valmiki-4%, Kondakapu-4% and Others-4%. Sample size is calculated by using the following formula n= 4pq/d2. P=28% (pilot study), Q=100-P=(100-28)= 72. D= allowable error of prevalence =10% of 28= 2.8. The sample size is 1028. The sample size is adjusted by adding 10% of non response rate and it is evenly distributed in the selected
study areas. Hence the total size of the sample is1136. Sampling method: Multistage random sampling method has been used to identify the study areas. In Stage-1 all the 18 primary health care centers (PHC’s) in tribal area were arranged alphabetically. 4 PHC’s were selected by simple Random Method, each representing in 4 directions. The selected PHC’s are as follows. Zaddangi-East, Devipatnam-West, Duppula- palem-North and Narasapuram-South. In the second Stage all the sub-centres in each of the PHC’s were arranged alphabetically. 4 sub-centres from each PHC were then selected randomly. The selected sub- centres were given in the table below. In Stage-3 all the villages were listed in each of the sub-centres and one village was selected randomly. The sample size is equally divided among the selected PHC’s (284) and similarly the sample is also equally divided among the selected villages in each sub-centre (71). Thus a total of 1136 subjects were selected from all the 16 villages. Stage-4: Study subjects were selected by simple random sampling method. All the data were entered into Excel sheet and analyzed using SPSS software version 17.
RESULTS
Distribution of basic amenities in the study villages All the villages are accessible by road.4 out of 16 villages have mud roads. Tar roads are available in remaining 12 villages. All the villages have access to bore wells and in addition Devipatnam has access to river water, and Narasapuram has access to mineral water. None of the study villages has either community toilets or individual toilets. All the villages are electrified. Mosquito breeding sites are present in all the villages in the form of shallow pools, cess pools, cattle sheds, potted plants, coconut shells and the presence of bushes and shrubs.
Distribution of health facilities and availability of health workers in the study villages
All the 4 PHC’s and sub-centre’s are functional. 54 anganwadi centres are present. As per norms 19 ASHA’s should be there, only 8 are present suggesting that <50% occupancy of ASHA’s. All the study villages have access to sub centres. And all the villages are covered under ICDS scheme. The sub-centre is manned by one ANM and one MPW-M. All the villages are covered by ANM/MPW-M once in 2 weeks under NVBDCP and the supervisor visits all these villages once in 2 weeks. Suggesting that the system at the ground level is in place and working effectively.
Details about distribution of mosquito nets in the study villages through ITDA
rate of one net for every 2 individuals. And all the families have received mosquito nets in adequate numbers. These nets have been imported from Australia by ITDA. The effectiveness of these nets are expected to last for a period of 5 years meaning that the villagers will receive nets again only after 5 years. IRS was carried out by ITDA with concerned PHC. IRS was done in all the villages. And as an on-going activity at the time of my visit. The spray activity is under takes once in 6 months. In my study villages the activity of first round was completed in April and second round in august. Indoor residual spraying in these areas means spraying of
insecticides on the external walls of the home and in the cattle sheds.
Gender distribution in the present study shows 42.6% of respondents are males and 57.4% are females. The percentage of male respondents varies from 20.24% in Zaddangi to 29.13% in Duppulapalem. The percentage of female respondents varies from 21.93% in Duppulapalem to 26.99% in Narasapuram (Table 1). 74.38% are aged less than 40 years as compared to 25.61% aged more than 40 years.
Table 1: Gender wise distribution of the respondents in the study P.H.C’s.
Gender P.H.C’s Total
Narasapuram Zaddangi Duppulapalem Devipatnam
N (%) N (%) N (%) N (%) N (%)
Males 108 (22.31) 98 (20.24) 141 (29.13) 137 (28.3) 484 (42.6)
Females 176 (26.99) 186 (28.52) 143 (21.93) 147 (22.54) 652 (57.4)
Total 284 (25) 284 (25) 284 (25) 284 (25) 1136 (100)
Table 2: PHC wise distribution of study respondents according to their educational status.
Educational status P.H.C’s Total
Narasapuram Zaddangi Duppulapalem Devipatnam
N (%) N (%) N (%) N (%) N (%)
Illiterate 136 (47.88) 119 (41.9) 78 (27.46) 130 (45.77) 463 (40.7)
Less than primary
school 57 (20.07) 57 (20.07) 66 (23.23) 41 (14.43) 221 (19.4)
Less than secondary
school 71 (25) 99 (34.85) 163 (57.39) 96 (33.8) 429 (37.7)
College 20 (7.04) 0 2 (0.7) 11 (3.87) 33 (2.9)
Total 284 (25) 284 (25) 284 (25) 284 (25) 1136 (100)
Table 3: PHC wise distribution of study respondents according to occupation.
Occupation P.H.C’s Total
Narasapuram Zaddangi Duppulapalem Devipatnam
N (%) N (%) N (%) N (%) N (%)
Unemployed 36 (12.67) 38 (13.38) 51(17.95) 19 (6.69) 144 (12.67)
Unskilled 237 (83.45) 195 (68.66) 185 (65.14) 251 (88.28) 868 (76.4)
Clerical 11 (3.87) 51 (17.95) 48 (16.9) 14 (4.92) 124(10.91)
Total 284 (25) 284 (25) 284 (25) 284 (25) 1136 (100)
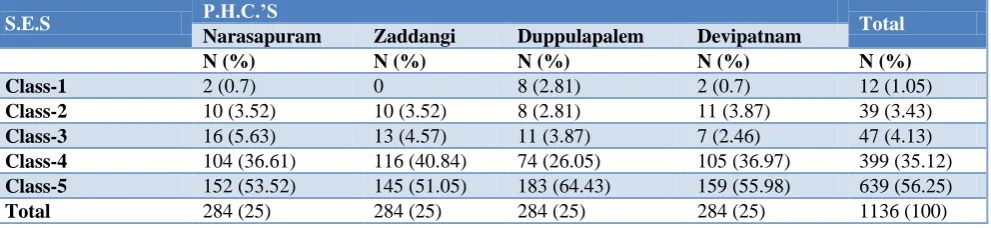
Table 4: PHC wise distribution of study respondents as per the socio-economic status (B.G.Prasad classification).
S.E.S P.H.C.’S Total
Narasapuram Zaddangi Duppulapalem Devipatnam
N (%) N (%) N (%) N (%) N (%)
Class-1 2 (0.7) 0 8 (2.81) 2 (0.7) 12 (1.05)
Class-2 10 (3.52) 10 (3.52) 8 (2.81) 11 (3.87) 39 (3.43)
Class-3 16 (5.63) 13 (4.57) 11 (3.87) 7 (2.46) 47 (4.13)
Class-4 104 (36.61) 116 (40.84) 74 (26.05) 105 (36.97) 399 (35.12)
Class-5 152 (53.52) 145 (51.05) 183 (64.43) 159 (55.98) 639 (56.25)
Total 284 (25) 284 (25) 284 (25) 284 (25) 1136 (100)
59.25% are literates as compared to 40.75% are illiterates. The literacy status of the study population is not far below the literacy status of AP (67.7%) and India (74.04%). The literacy status of the tribal’s is more than comparable with that of tribes in the country (47.1%) and the state of Andhra Pradesh (37%). 37.76% of the study subjects have high school education as compared to 18.57% of the study subjects have primary school education. And 2.9% have college education. Illiteracy was 30.78% in males and 48.15% in female participants. 17.35% of males and 19.47% of the females have primary school education or less. 49.17% of males and 29.29% of females have high school education or less. There seems to be more number of school drop outs among females as compared to males in the above two categories. There is a relationship between rows and
columns. Chi square value- 50.45, d.f- 3, p<0.001 (Table 2).
76.4% were unskilled workers which include labourers, agricultural workers, and gatherers.12.67% limited with household work. Rest 10.91% was job holders. None of them are in semiskilled, skilled, semi-professionals and professional group (Table 3). Some people depend on forest products and their protection in Vanasamrakshana Samiti. 56.25% belongs to monthly income less than 773 rupees class-5, followed by 35.12% of class-4, 4.13% of class-3, 3.43% of class-2 and only 1.05% is class-1 (Table 4). The mean per-capita income in the study areas-939.08, standard deviation- 940.947. Mean income of head of family- 2666.46. Mean family income- 3619.28. Mean number of family members- 4.29. Dependency ratio-2:5.
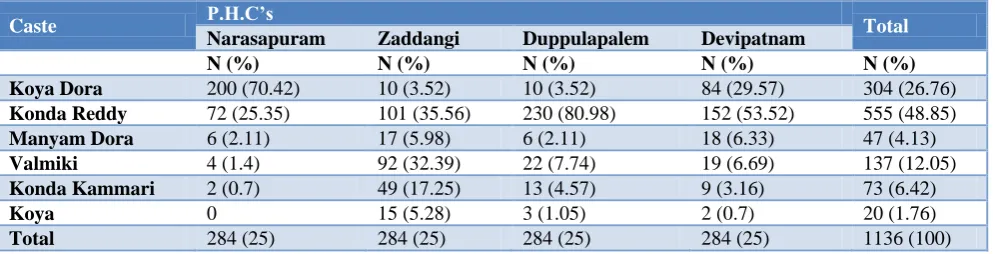
Table 5: PHC wise distribution of study respondents according to their sub-Caste.
Caste P.H.C’s Total
Narasapuram Zaddangi Duppulapalem Devipatnam
N (%) N (%) N (%) N (%) N (%)
Koya Dora 200 (70.42) 10 (3.52) 10 (3.52) 84 (29.57) 304 (26.76)
Konda Reddy 72 (25.35) 101 (35.56) 230 (80.98) 152 (53.52) 555 (48.85)
Manyam Dora 6 (2.11) 17 (5.98) 6 (2.11) 18 (6.33) 47 (4.13)
Valmiki 4 (1.4) 92 (32.39) 22 (7.74) 19 (6.69) 137 (12.05)
Konda Kammari 2 (0.7) 49 (17.25) 13 (4.57) 9 (3.16) 73 (6.42)
Koya 0 15 (5.28) 3 (1.05) 2 (0.7) 20 (1.76)
Total 284 (25) 284 (25) 284 (25) 284 (25) 1136 (100)
Majority (92.86%) belongs to Hindus followed by 7.13% Christians and none of them belongs to Muslim religion. Majority 48.55% belongs to Konda Reddy, followed by 26.76% Koya Dora, 4.13% Konda Kammari, 12.05% Valmiki, 6.42% Manyam Dora, and 1.76% Koya (Table 5).
In the present study 74.29% of the study subjects are living in nuclear families as compared to 24.82% in joint families. 31.33% of the study subjects are living in joint families in Narasapuram as compared to 26.05% in Devipatnam, 22.11% in Duppulapalem and 19.71% in Zaddangi. About 23.22% of the study respondents are living in Katcha houses as compared to 15.66% in pucca houses and 61% in semi-pucca houses. The distribution of houses among the 4 PHC’s is not different from each other.
Majority (82.29 - 88.73%) of the study population lives in villages with electricity. And only few (11.26–17.6%) of the study population lives without electricity. The variation between the PHC’s with and without electrification is minimal. Chi square- 17.98, d.f- 6, p-0.06 (Figure 1).
Majority of the study population in all 4 P.H.C’s are depending on mineral water (56.69%), bore water (36%)
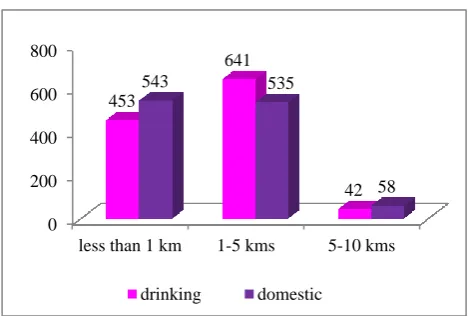
for drinking purpose. and on bore water (49.55%) and canal water (43.83%) for domestic purposes (Figure 2). 56.42% of the study subjects have to procure drinking water from a distance of 1-5 km as compared to 39.87% within 1 km distance (Figure 3). Almost equal percent of study subjects have to travel a distance of less than 1-5 km for domestic purposes. 5.1% of the study subjects have to travel a distance of 5-10 km. The mean distance travelled for procuring drinking water is 1.57 with an S.D of 0.565, range of 2. The mean distance travelled for procuring domestic water 1.52 with an S.D of 0.5.In Duppulapalem PHC area the distance travelled for procuring drinking water is less when compared to other P.H.C areas. This is found to be statistically significant.100% travel less than a km for procuring drinking water.47.79% of study subjects have access to drinking water within 20ft. 70.07% in Duppulapalem PHC travel <20 ft for drinking water.
Majority of study respondents (89.78 – 98.94%) do not have toilets at their houses. But only few (1.05 – 10.21%) respondents have toilet facilities. Chi square- 26.12, d.f-3, p<0.001 (Figure 4).
And in 10- 20 feet distance from the house in 34.69% of the respondents. Among those who have cattle’s in their house they kept clean and dry in 50.54% of participants and wet and unhygienic in 49.45% of the participants. 98.67% of the study population does not have drainage facilities as compared with 1.32% have drainage facilities. This distribution is seen in all the PHC’s studied. Chi square-7.76, d.f-3, p=0.051. 75.08% of the study respondents are staying in their respective villages since their birth, 14.7% staying in their villages from 10-20 yrs, and 10.21% were staying <10 yrs of the duration.
Figure 1: PHC wise distribution of respondents having electricity.
Figure 2: Distribution of study subjects with different water sources.
Figure 3: Distribution of study subjects based on the distance of source of water.
Figure 4: PHC wise distribution of study respondent’s with sanitary facilities.
DISCUSSION
All the Basic amenities are present in the study villages except community toilets or individual toilets. More than half of the villages have adequate health facilities and health workers. All the villages were distributed with mosquito nets through ITDA. In our study 59.25% of the population were literates. Illiteracy was reported in 30.78% of males and 48.15% female participants. In contrast to our study Sujith et al found 72% of the population are illiterate, of them 61.5% of the population are illiterate beyond 10 years of their age.10 According to the Census figures, the literacy rate for the Scheduled Tribes in India is 59% while in Andhra Pradesh it is 49.2%. Male and female literacy for STs in India is 68.5% and 49.4%. Studies on tribes revealed Low female literacy (14.5% against 47%), have been reported among tribal populations as compared to their rural counterparts.11 We reported 76.4% are labourers, agricultural workers, and gatherers. 12.67% limited with household work. Rest 10.91% are job holders. Some people depend on forest products and their protection in Vanasamrakshana Samiti. 56.25% belongs to monthly income less than 773 rupees class-5, the mean per-capita income in the study areas-939.08. Sujith et al reported 40% of the population earned their livelihood by collecting forest products like honey, gum, etc. Average monthly per-capita income of the family is 853.30. The average monthly per capita income (PCI) of HHs in a study was 1,333.10
We reported 74.29% of them were living in nuclear families. Sujith et al reported 92% of the families are nuclear followed by joint families.10 In an another study about 82% of the families were nuclear, while about 8% were joint families.12 Majority (92.86%) belongs to Hindus followed by 7.13% Christians. Other studies also found that majority of the households (98%) were Hindus.13 In another study majority of the HHs (89%) were Hindus, while the remaining (11%) were Christians.14 We reported 89.78–98.94% do not have toilets in their houses which is very serious issue to be addressed.
0 100 200 300
252 246 234 252
32 38 50 32
yes no
0 200 400 600 800
mineral water
bore well canal water well water 644
409
54 29
0
563
498
75
drinking domestic
0 200 400 600 800
less than 1 km 1-5 kms 5-10 kms 453
641
42
543 535
58
drinking domestic
0 50 100 150 200 250 300
3 13 26 29
281 271
258 255
CONCLUSION
All the basic amenities were present in the study villages except community toilets or individual toilets. More than half of the villages have adequate health facilities and health workers. All the villages were distributed with mosquito nets through ITDA. 59.25% were literates. 56.25% belongs to monthly income less than 773 rupees i.e. class-5, 74.29%were living in nuclear families. 48.55% belongs to Konda Reddy community. 56.69% have access to mineral water supply. 89.78 – 98.94% does not have toilets at their houses. 43.39% of the respondents have cattle sheds near to their houses.
Funding: No funding sources Conflict of interest: None declared
Ethical approval: The study was approved by the Institutional Ethics Committee
REFERENCES
1. India. The Constitution of India. New Delhi: Government of India, Ministry of Law and Justice. 1949. Available at: http://indiacode.nic.in/ coiweb/welcome.html. Accessed on 3 January 2019. 2. India. Statistical Profile of Scheduled Tribes in India. New Delhi: Ministry of Tribal Affairs, 2013. Available at: http://tribal.nic.in/WriteReadData/ userfiles/file/Statistics/StatisticalProfileofSTs2013.p df. Accessed on 3 January 2019.
3. Census of India. Primary Census Abstract, Office of the Registrar General of India, New Delhi. 2001. 4. India Ministry of Tribal Affairs (2004) the national
tribal policy (draft) New Delhi: India Ministry of Tribal Affairs. Available at: http://tribal.nic.in/ finalContent.pdf. Accessed on 6 March 2019. 5. Basu S. Dimensions of tribal health in India. Health
Popul Perspect Issues. 2000;23:61–70.
6. Patel ML. Agrarian Transformation in Tribal India. New Delhi: M.D. Publications Pvt. Ltd. 1998: 313. 7. Sharma RN, Sharma RK. Problems of Education in
India. New Delhi: Atlantic Publishers Distributors. 2004: 46.
8. Sahani R, Nandy SK. Particularly Vulnerable Tribal Groups in India: An Overview. J Anthropological Survey India. 2013;62(2):851-65.
9. East Godavari chapter details obtained from district D.M.H.O office.
10. Dondapati SKS, Karimaddela K. Socio-demographic and health profile of schedule tribes of Velugodu, Andhra Pradesh, India. Int J Community Med Public Health. 2016;3:2615-20.
11. Vijayaraghavan K, Rao HD, Brahmam GNV, Sarma RKV, Laxmaiah A, Kumar HR. Integrated child development services in Andhra Pradesh: Baseline survey in old tribal projects. Hyderabad: National Institute of Nutrition. 2001.
12. Kodavanti MR, Nagalla B, Avula L, Kodali V, Brahmam GNV. Diet and nutritional status of adolescent tribal population in nine States of India. Asia Pac J Clin Nutr. 2006;15(1):64-71.
13. Rao KM, Kumar RH, Krishna SR, Bhaskar V, Laxmaiah A. Diet & nutrition profile of Chenchu population - a vulnerable tribe in Telangana & Andhra Pradesh, India. Indian J Med Res. 2015;141:688-96.
14. Rao DH, Brahmam GN, Rao NP. Diet and nutrition survey among the Onges. Nutr News. 1989;10:1-3.