Superparamagnetic Behavior of the Magnetic Hysteresis
Loop in the Fe
2O
3@Pt Core-Shell Nanoparticles
Z. Alborzi
1*, A. Hassanzadeh
2,3, M. M. Golzan
1,31- Department of Physics, Faculty of Science, Urmia, I. R. Iran
2- Department of Chemistry, Faculty of Science, Urmia, I. R. Iran
3- Nanotechnology Research Center of Urmia University, Urmia, I. R. Iran
(*) Corresponding author:
[email protected]
(Received:20 Feb. 2012 and Accepted: 28 May 2012)
Abstract:
Studies of the magnetization of Fe2O3@Pt nanoparticles at room temperature showed that there is superparamagnetic contribution with high saturation magnetization about 12.35(emu/g), and soft ferromagnetic contribution with narrow coercive field about 58(Oe). In this paper we fitted the hystersis loop of sample with Brillouin function that demonstrating existence of superparamagnetic phase. Total angular momentum quantum number J With computations performance, gave consistent value at high level that could be the reason into existence of spin clusters. Upshot theoretically, magnetic susceptibility of this sample was calculated from the Brillouin function at fields less than 1000(Oe) from 0.1 to 400 K to determine the high-temperature susceptibility. Keywords: α-Fe2O3@Pt core-shell nanoparticles, Magnetization, Superparamagnetic, Brillouin function, Susceptibility.
Int. J. Nanosci. Nanotechnol., Vol. 8, No. 2, June 2012, pp. 93-98
1
. INTRODUCTION
The platinum-hematite Fe2O3@Pt core-shell nanoparticles have attracted significant attention because of its complex magnetic properties and its
usage in industry and medicine applications such as drug-targeting, cancer therapy, lymph node imaging
or hyperthermia. There are other applications of magnetic nanoparticles, e.g. in ferrofluids, high performance permanent magnets, high-frequency electronics and magnetic refrigerators [1-3].
Core-shell nanoparticles were generally synthesized
through two synthetic ways: precipitation, surface reaction and controlled deposition using preformed
primary particles.
Recently in year 2010, Chen and co-workers
synthesized the α-Fe2O3@Pt urchin-like composites (fewer than 10 nanometers) and investigated their
magnetic and electrocatalytic properties. They have
seen superparamagnetic phase in this sample [4].
The descriptions of intricate behavior of magnetic materials subjected to magnetic fields under
non-equilibrium thermodynamic conditions have gained
a renewed interest in recent years [5]. Although the magnetism of fine particles has been studied for many years, there is the rich variety of phenomena
which remain to be understood and explained. The
adequate description of the whole magnetization curve is more difficult. In recent years many researchers work in this field work [6-9]. Very
small magnetic particles exhibit a gradual transition
to paramagnetism. For sufficiently small numbers
N of atoms, the interatomic exchange ensures
that the spins are all parallel, so that the particle behaves like a superparamagnetic single spin or
macrospin of length N. Nanoparticles containing
hundreds or thousands of atoms are intermediate
true ferromagnets. Very small particles have a low
coercivity due to superparamagnetic excitations
[10]. As outlined by Bean and Livingston (1959),
superparamagnetism involves two phenomena:
the Langevin-type alignment of macrospins in an external field and the superparamagnetic blocking or freezing of the magnetization reversal [11].
Moreover, in magnetic materials, approximation
of magnetization was performed by the Brillouin function that measured in applied magnetic field along the easy axis. The accuracy of these approximations in a wider region of magnetization
is not high.
In the present work, we will try to find an approximation based on the Brillouin equation satisfying the following necessity:
1.
It should be consistent with the phenomenologicaldescription of magnetization.
2.
The used component of theoretical formulashould be fitted with the experimental data of
samples.
3.
It achieves high accuracy in the whole region ofmagnetization.
For this purposes, we utilized the magnetic
experimental data of Fe2O3@Pt core-shell
nanoparticles that their magnetization results were measured by vibrating sample magnetization
(VSM). The experimental data was well fitted to equation (1-3.2) (approximately, the square chi coefficient is 10-6), which means that the Fe
2O3@
Pt core-shell NPs are essentially superparamagnetic
nanoparticles. Ultimately, in sight of theory, magnetic susceptibility of samples was calculated
and by this computation, good result was given.
2. MATERIALS AND METHODS
2.1. Synthesis of α-Fe2o3@Pt core-shell NPs α-Fe2o3@Pt core-shell NPs were synthesized by chemical reduction of Pt onto the Fe2o3 core. The
process was as followed: 140 mL of Fe2O3 (Merck; 10-3 M) aqueous solution was placed in ultrasonic
bath for 50 min. Then 7 mL of tri-sodium citrate
dihydrate (Merck; 1×10⁻¹ M) was added to Fe 2O3
solution and were violently stirred for 15 min. When the mixture was stirred and heated to 80 °C, 1 mL
of K2PtCl6 (Merck; 2×10⁻² M) was added and finally
7.5 mL of NaBH4 (Merck; 1.32 M) was added under
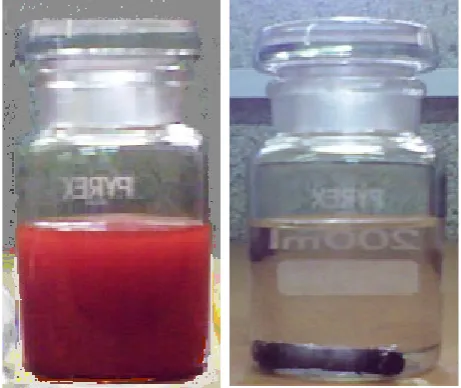
stirring for 30 min at 40 °C, until a brown-blackish colloidal solution was formed(See Figure 1). Pt shells were formed by reduction of Pt4+ onto the Fe2O3-core nanoparticles surfaces using tri-sodium
citrate dihydrate as both a reductant and a stabilizer material.
Figure 1: Solution of Fe2O3 (Left hand-side) and Fe2O3@Pt core-shellNPs (Right hand-side)
3. RESULTS AND DISCUSSION
3.1. TEM studies
Transmission electron microscopy (TEM) was employed for particles size measurement, shape evaluation and core-shell formation confirmation.
TEM confirms Fe2O3@Pt core-shell NPs formation
and it is clearly shown that the shape of NPs is nearly spherical and has an average diameter of 25 nm (See Figure 2). Besides, it shows that the dark
magnetite particles are individually coated with a
uniform platinum shell with a thickness of ca. 3 nm.
3.2. VSM measurements
Vibrating sample magnetometer (VSM) with a
sensitivity of 10-3 emu and magnetic field up to 10
kOe was utilized to evaluate the magnetic saturation
with field sweeping from -10 to +10 kOe. It is worth
noting that the Fe2O3 (Merck) was considered as a
reference sample and it was compared with Fe2O3@
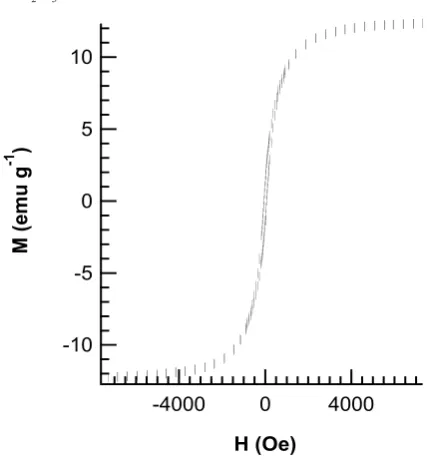
Pt core-shell NPs to gain some of the results. Hysteresis loop of magnetization of samples were shown in Figure 3 and Figure 4.
This phenomenon is known as magnetic hysteresis.
Key parameters of the hysteresis loop are the
coercivity Hc, at which the magnetization is zero, and the remanent magnetization or remanence Mr.
Coercivity and remanence are complemented by parameters describing the loop shape and the area
under the loop [10]. The magnetic results of these
samples were observed in Table 1.
Attention to the magnetic measurements, the
coefficient of squareness of hysteresis loops is
KP that equals to r S
M
M , where
M
r is a remanentmagnetization,
M
S is a saturation magnetization. These results were in Table 1. The measured Figure 2: TEM images of Fe2O3@Pt core-shells.-0.6 -0.4 -0.2 0.0 0.2 0.4 0.6
M (
em
u g
-1 )
-10000 -5000 0 5000 10000
H (Oe)
10
5
0
-5
-10
M (
em
u g
-1 )
4000 0
-4000
H (Oe) Figure 3: VSM result for Fe2O3@Pt core-shellNPs at
hysteresis loop of Fe2O3(Merck) show that this
sample approximately is in hard ferromagnetic
materials group and the measured hysteresis loop
of Fe2O3@Pt core-shellNPs show that behavior of this sample is in weak ferromagnetic phase, which can be categorized in soft magnetic materials group [12] (See Figure 3-5 & Table 1).
We have assumed that the magnetic dipole moment can take all possible orientations with respect to
the applied magnetic field, whereas in reality it can have only discrete orientations because of spatial quantization. If we incorporate the quantization into the derivation of the total magnetization, we obtain:
( , )
( , )
M H T
=
NJg F J y
µ
β (1)1 1 1
( , ) (1 )coth[(1 ) ] coth[ ]
2 2 2 2
y
F J y y
J J J J
= + + −
(2)
( P)
Jg H
y
K TB
µβ
q
=− (3)
Where N is the number of atoms per unit of gram, J
is the total angular momentum quantum number, g is the lande-g value approximately is equal to 2.01;
μβ isthe Bohr-Magneton moment,
F J y
( , )
is theBrillouin function, T is the ambient temperature and θP is the Curie temperature. Which (2) equation is
equal to the Langevin function in the limit that J
→∞ [13].
By allowing the values for N, J and θP to float, we fitted the experimental data with the equation (1). As you can see in Figure 5, we have one of the best fitted experimental results with theory.
After fitting, the value of total angular momentum quantum number J was equal to ≈ 8000, that this can be another reason for the formation of clusters in sample. The Curie temperature calculated for the sample was 0.02 K and N≈1016 (gr-1).
With decreasing the size of Fe2O3 particles in
during of synthesis, the amount of coercivity was decreased. It seems that atoms of Fe2O3 behave in
the ferromagnetic phase and existence of Pt shell
on (Fe2O3) core can have the most shares in high
saturation magnetization. High magnetization of this sample, can be the evidence of formation of clusters
in sample. In addition, the saturation magnetization will be increased by decreasing particles size [14].
Based on magnetic measurement (See Table 1),
the squareness KP of the Fe2O3@Pt core-shellNPs
is less than that of Fe2O3 (Merck), this means that
initial phase of Fe2O3, after coating the Pt shell,
converts to the superparamagnetic phase. When the magnetic cluster size decreases its magnetic
energy drops and approximates to the energy of heat movement that causes an enhancement of the
superparamagnetic contribution into magnetization.
As the experimental data are well fitted to the Brillouin function, it seems that the Fe2O3@Pt
core-shell NPs are essentially superparamagnetic nanoparticles.
3.3. Theoretical susceptibility
The properties of a material are defined not only by
the magnetization, or the magnetic induction, but also by the way in which these quantities vary with
the applied magnetic field. The ratio of M to H is
called the susceptibility:
( , )
M H T
H
χ =
(4)( , )
NJg F J y
H
β
µ
χ =
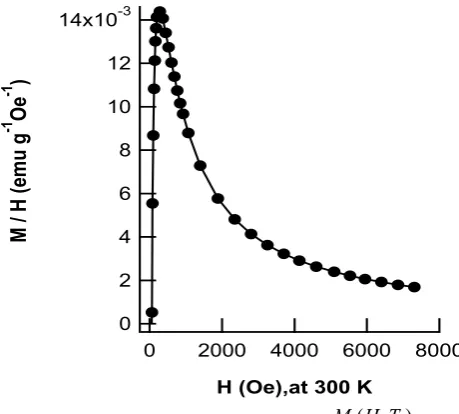
(5)Susceptibility function has two variables: H (magnetic field) and T (temperature). Susceptibility function at room temperature could be plotted by the experimental data of magnetization of sample at room temperature (See Figure 6).
At room temperature, the maximum value of susceptibility occurs at field 282.2(Oe).
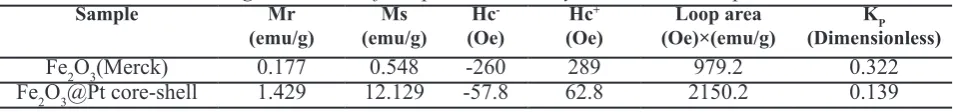
Table 1: Magnetic results of samples measured by VSM in room temperature.
Sample Mr
(emu/g) (emu/g)Ms Hc
-(Oe) Hc +
(Oe) (Oe)×(emu/g)Loop area (Dimensionless)KP
Fe2O3(Merck) 0.177 0.548 -260 289 979.2 0.322
Superconducting quantum interference device (or SQUID) is a device which is capable of measuring susceptibility of samples. In this device magnetic field was stabled for example in 100(Oe). Then susceptibility of sample was given with change of
temperature.
After fitting the experimental data of magnetization of sample with equation (1-3.1), we reach the
function of
M H T
( , )
. Theoretically, without useof SQUID device, the susceptibility of sample was plotted at fields less than 1000(Oe) from 0.1 to 400 K (See Figure 7).
It was indicated in Figure 7 that with increasing the magnetic field for measuring of susceptibility, maximum value of susceptibility is increased. Also with decreasing the magnetic field, graph of 12
10
8
6
4
2
0
M (
em
u g
-1 )
6000 4000
2000 0
H (Oe)
14x10-3
12
10
8
6
4
2
0
M /
H
(em
u g
-1 Oe -1 )
8000 6000
4000 2000
0
H (Oe),at 300 K
0.30
0.25
0.20
0.15
0.10
0.05
0.00
Su
sc
ep
tib
ili
ty
(e
m
u g
-1 Oe -1 )
300 200
100 0
T (K)
H(Oe)
Figure 5: The superparamagnetic contribution to the magnetization of the Fe2O3@Pt core-shellNPs at room temperature. The experimental data (dots) have the best
fits (solid lines) with the theoretical curves.
Figure 6: The magnetic susceptibility (M H T( , )
H ) of
sample at room temperature.
Figure 7: The magnetic susceptibility of sample, ●
line at 40.2(Oe), ■ line at -57.2(Oe) ,▼line at field
282.2(Oe) and ▲line at field 842.2(Oe).
0.20
0.15
0.10
0.05
0.00
Su
sc
ep
tib
ility
(e
m
u g
-1 Oe -1 )
400 300
200 100
0
T (K)
Figure 8: Magnetic susceptibility of sample at field
-57.2(Oe).The experimental data (dots) has the approximate best fits (solid lines) with the theoretical
susceptibility at high temperatures was entered to
the negative zone of susceptibility. It seems that diamagnetism’s contribution of susceptibility is
appearing.
Above their Curie temperatures, θP, ferromagnetic
materials become paramagnetic, and their
susceptibilities follow the Curie-Weiss law, with a value of θ approximately equal to θP. [13]
dia
C
T
χ
χ
q
=
+
−
(6)By fitting one of the graphs of susceptibility,
it could be shown that this behavior is correct (See Figure 8). Furthermore, the diamagnetism’s susceptibility contribution was observed on
sample after fitting. The value of
χ
dia wasobtained -0.02(emu/ (g.Oe)).
4. CONCLUSION
In brief, we found a new way to the synthesis of α-Fe2O3@Pt core-shell nanoparticles to use as the drug-targeting, cancer therapy and etc. Based on magnetic measurement, as the experimental data are well fitted to the Brillouin function, it seems that the α-Fe2O3@
Ptcore-shell NPs are essentially superparamagnetic
nanoparticles that with the calculation performed,
its total angular momentum quantum number J has became 8000. The high magnetization and high total angular momentum quantum number J could be a
reason of the presence of spin clusters in sample. Theoretically, without use of SQUID device, the susceptibility of sample at fields less than 1000(Oe) was plotted from 0.1 to 400 K. Susceptibility of sample follows the Curie-Weiss law.
REFERENCES
1. C. C. Berry, A. S. G. Curtis, Functionalisation of magnetic nanoparticles for applications in biomedicine, J. Phys. D: Appl. Phys. Vol. 36, (2003), pp. 198–206.
2. P. Tartaj, M. P. Morales, S. V. Verdaguer, T. G.
Carreno, C. J. Serna, The preparation of magnetic nanoparticles for applications in biomedicine, J. Phys. D: Appl. Phys. Vol. 36, (2003), pp. 182–197. 3. J. A. Nelson, L. H. Bennett, M. J. Wagner, Solution
Synthesis of Gadolinium Nanoparticles, J. AM. CHEM. SOC. Vol. 9, (2002), pp. 2979-2983.
4. Y. Chen, K. Zhang, Y. Min, Y. Zhang, R. Zhang,
Facile route to synthesis α-Fe2O3/ Pt urchin-like
composites and their magnetic and electrocatalytic
properties, material chemistry and physics. Vol. 123, (2010), pp. 378-384.
5. K. Chwastek, Modelling magnetic properties of MnZn ferrites with the modified Jiles–Atherton description, J. Phys. D: Appl. Phys. Vol. 43, (2010), pp. 15005-15010.
6. M. M. Golzan, D. R. Mckenzie, D. J. Miller, S. J.
Collocott, G. A. J. Amaratunga, Magnetic and spin
properties of tetrahedral amorphous carbon, Diamond and related materials, Vol. 4, (1995), pp. 912-916. 7. N. Dave, B. G. Pautler, S. S. Farvid, P. V.
Radovanovic1, Synthesis and surface control of
colloidal Cr3+-doped SnO
2 transparent magnetic
semiconductor nanocrystals, Nanotechnology. Vol.
21, (2010), pp. 134023-134030.
8. D. Ortega, E. Velez-Fort, D. A. Garcia, R. Garcia, R. Litran, C. Barrera, A. Solano, M. Ramirez-Del-Solar, M. Dominguez, Size and surface effects in the magnetic properties of maghemite and magnetite
coated nanoparticles, Phil. Trans. R. Soc. A. Vol.
368, (2010), pp. 4407–4418.
9. H. Liu, J. Wu, J. H. Min, P. Hou, A. Y. Song, Y. K. Kim, Non-aqueous synthesis of water-dispersible Fe3O4–
Ca3(PO4)2 core–shell nanoparticles, Nanotechnology. Vol. 22, (2011), pp. 055701-055708.
10. R. Skomski, Simple Models of Magnetism, Oxford University Press, New York, Vol. 228, (2008), p. 3.
11. C. P. Bean, J. D. Livingstone, Superparamagnetism, J. Appl. Phys. Vol. 30,(1959), pp. 120-129.
12. A. H. Morrish, The physical principles of Magnetism, John WILEY & Sons, Ins. New York, Vol. 483, (1965), pp. 3-5.
13. N. A. Spaldin, Magnetic materials: fundamentals and device applications, Cambridge, United Kingdom, (2003), p. 46.
14. I. V. Vasylenkoa, K. S. Gavrylenkoa, V. G. Il’yin, V. Golubc, G. Goloverda, V Kolesnichenko, A. W. Addisond, V. V. Pavlishchuka, The metamorphosis
of heterometallic trinuclear antiferromagnetic
complexes into nano-sized superparamagnetic spinels, Mater. Chem. Phys. Vol. 121, (2010), pp.