United Kingdom Vol. III, Issue 2, Feb 2015
Licensed under Creative Common Page 1
http://ijecm.co.uk/
ISSN 2348 0386
DETERMINANTS OF PERFORMANCE EFFICIENCY IN
NIGERIAN BANKING INDUSTRY: A DEA APPROACH
P. O. Eriki
Department of Banking & Finance, University of Benin, Nigeria [email protected]
Osagie OSifo
Department of Banking & Finance,University of Benin, Nigeria [email protected]
Abstract
The study examines the determinants of performance efficiency of 19 selected banks in Nigeria
in 2009. Three performance efficiency measures of constant returns to scale (CRS), variable
returns to scale (VRS) and scale efficiency models are used by employing the Data
Envelopment Analysis (DEA) approach. The estimation process was done using DEA frontier
software. The findings revealed that bank size and bank age are positively related to bank
performance efficiency, while board independence and board ownership structure are
negatively related to bank performance efficiency in Nigeria. We recommend that strong and
efficient resource management policies be put in place by banks’ management, as well as risk
management policies. It is also recommended that the regulatory and supervisory role of
monetary authorities and continuation of the reform process be vigorously pursued so as to
enhance bank performance in Nigeria.
Key words: Performance efficiency, DEA, VRS, CRS, Risk management
INTRODUCTION
Licensed under Creative Common Page 2 function of banks (Akhta, Ali & Sadaqat 2010). Given this critical importance of banks to the economy, researchers have focused on the evaluation of bank performance efficiency with rigorous empirical torchlight.
The importance of performance efficiency of banks is extremely vital because banks constitute the hub of the financial impact on the micro and macro levels of the economy (Athanasoglou, Brissimus & Delish 2005). Since a systemic failure in the banking sector can spell doom for depositors, shareholders, potential investors, managers, regulators and the general economy, their activities are perhaps the most heavily regulated and supervised of all businesses (Soyibo and Adekanye, 1991).
Empirical studies on performance efficiency of banks in the past used conventional ratios such as return on asset (ROA) and return on equity (ROE) as measures of performance. Others used various measures of performance to include financial index (Wu, Kao & Cheng 2006). However, these measures were fraught with inherent limitations such as the inability to analyze the efficiency of multiple decision making units simultaneously in a dynamic framework (Frimpong, 2006). It is in this regard that the Data Envelopment Analysis (DEA) came to the fore for analytical efficiency comparison among multiple decision making units at the same time (Jones, Izzeidin & Pappas 2009).
Given the intuitive and ingenious development of DEA in evaluating performance efficiency of banks, most studies have sought to compare the efficiencies associated with banks using an efficiency frontier. It is in this regard the current studies in performance efficiency of banks in Nigeria attempts to adopt the DEA approach.
The recent financial crisis in Nigeria which was a transmission impulse from the global financial crisis has given more credence to the evaluation of the determinants of banks performance efficiency in Nigeria using a more efficiency comparison approach such as the DEA. This is the focus of this paper.
Aside the introductory section of this paper, section two gives a brief review of the literature; section three describes the methods and sources of data. The results are presented in chapter four and section five concludes the paper.
LITERATURE REVIEW
Licensed under Creative Common Page 3 Drake, Hall and Simpler (2006) examined the impact of macroeconomic and regulatory factors on bank efficiency using the DEA in Hongkong. He finds that macroeconomic factors such as inflation, interest rate, real GDP significantly determine banks efficiency.
Studies such as Isik and Hassan (2003a), Canhoto and Dermine (2003) and Isik (2008) have examined efficiency of banks using DEA approach. Studies by Hassan, Mohamad and Bader (2009) and Malik (2010) regarded fixed assets, total funds, and interest and non-interest expenses, total deposits labour and capital as bank inputs. These inputs are regarded as determinants of bank efficiency.
Siems (1992) applied DEA to assess the significance of management quality in distinguishing surviving banks from failed banks in the USA. Using a sample of 611 surviving banks and 319 failed banks, he showed that management quality is critical for banks longterm performance efficiency.
Yan et al. (2007) applied stochastic frontier approach (SFA) to a panel of twenty-two banks to estimate the effect of ownership structure and implementation of “hard budget constraint on bank efficiency”. Non-state banks are found to be 8-18% more efficient than state banks, and banks facing a hard budget constraint tend to perform better than these relying on substantial government capital injections.
Using a DEA approach, Chen, Skully and Brown (2005) examine the cost technical and alternative efficiency of forty-three Chinese banks from 1993 to 2000. They found that large state-owned and smaller banks are more efficient than medium sized banks and that financial regulation improves cost and performance efficiency.
Most studies on performance of banks have identified a number of corporate governance variables as performance-determinant of banks. Studies as Bdour and Al-Khaoury (2008), Bino and Tomar (2008), Drake et al (2006) have examined the determinants of bank efficiency using non-parametric approach.
Sufian (2009) examines the determinants of bank efficiency during unstable macroeconomic environment. Empirical results show that economic growth rate, interest rate, and inflation affects bank efficiency.
Young (2003) examined the relationship between corporate governance and firm performance. Results show that bank size, board independence and ownership structure are performance determinants.
Licensed under Creative Common Page 4 Earliest study on efficiency of banks in Nigeria using DEA approach was done by Soyibo and Adekanye (1991). In the study, the authors examined the efficiency of banks in Nigeria using a non-parametric DEA approach and found that efficiency of banks in Nigeria were both internally and externally determined. Most studies in efficiency of banks in Nigeria used conventional ratio analysis such as return on assets (RoA), return on equity and CAMEL to proxy performance till date, only very few studies have used the DEA to evaluate bank performance in Nigeria this has made comparative efficiency of banks difficult in Nigeria.
Olugbenga and Olakunle (1998) examined the effect of gradual deregulation on the performance of banks in Nigeria. It also examined whether policy package results in an improvement in the technical efficiency of the industry. Using the DEA approach, the study reveals that banking industry efficiency declined significantly during years immediately following the adoption of deregulation. This study attributed this to the effect of inconsistent policies to which the sector was subjected to during the period.
METHODOLOGY
The study uses the DEA approach to investigate the determinants of performance efficiency of 19 selected banks in Nigeria for the year 2009. In order to have a robust empirical analysis, three DEA performance efficiency measure are employed to include the constant returns to scale (CRS), variable returns to scale (VRS) and scale. The independent variables (determinants) of bank efficiency used in the study include Bank size, Bank age, Board independence and Bank ownership structure. The measurement of the variables is demonstrated below in the table below.
Table 1: Measurement of Independent Variables
Independent Variables Measurement
Bank size (BSIZE) Total number of employee
Bank age (BAGE) 2010 – Date of establishment of the bank.
Board Independence (BODIN) Total non-executive directors/total board
Bank Ownership Structure (BOWNS) Percentage of shares owned by institutional investors
Sources of Data
Licensed under Creative Common Page 5 Data Envelopment Analysis
Data envelopment analysis (DEA) is a non-parametric linear programming technique for measuring the relative efficiency of multiple decision making units. It involves the construction of a non-parametric piecewise frontier over data so as to calculate efficiency relative this frontier. The ability of the DEA to identify possible peers or role models as well as comparative efficiency scores gives it an edge over other methods.
In multiple case relative efficiency approach, efficiency is defined as the ratio of weighted sum of outputs to weighted sum of inputs. The weights for the ratio are determined by the restriction that similar ratios for every DMU has to be less than or equal to unity, thus reducing multiple inputs and output to a single virtual input and single virtual outputs without requiring pre-assigned weights (Frimpong, 2010).
The DEA measures the efficiency of banks with multiple inputs and outputs. Second, it provides the quantitative information on the extent of financial inefficiency, and subsequently, on the targets required to become efficient. Third, it identifies the best-practice rather than average performance which may serve as a benchmark for financial inefficient banks.
In DEA, the maximum efficiency any group of banks can assume is 1, others with relative inefficiency will have a score less than 1. Furthermore, the efficiency scores makes for a ranking of the banks in the population from the least efficient to the most efficient.
While the CCR model ground itself on the assumption of constant returns to scale (CRS) and optimal scale operations, the BCC an extension to CCR model, assumes variable returns to scale and adds a convexity condition to CCR model. Thus, the efficiency estimated using BCC refers to the pure technical efficiency (PTE), while the efficiency score using CCR refers to the technical efficiency.
Using this approach, we investigate the impact of the following determinants of bank performance efficiency. Bank age, bank size, board independence and ownership structure on three performance efficiency score of constant returns to scale (CRS) variable returns to scale (VRS) and scale.
EMPIRICAL RESULTS AND DISCUSSION
Descriptive Statistics
Licensed under Creative Common Page 6 Correlation Results
The correlation analysis is used to examine the relationship between the independent variables (determinants of bank performance efficiency with each of the three efficiency measures. The results is presented in table below:
Table 2: Pearson Correlation analysis
Pearson Correlation TEers TEvrs Scale BSIZE BOWN BODIN BAGE
CRS 1.0000 0.8529 0.7620 0.2059 0.0454 -0.2143 0.1077
VRS 1.0000 0.3334 0.0036 0.3238 -0.0065 0.0372
Scale 1.0000 0.4649 -0.2077 -0.3608 0.1468
BSIZE 1.0000 -0.0557 -0.1339 0.1762
BOWNS 1.0000 0.3753 0.1622
BODIN 1.0000 -0.0929
BAGE 1.0000
In the correlation results, it can be observed that bank size and bank age are each positively related to each of the three performance efficiency measure of CRS, VRS and scale. This positive association is also observed in the case of bank age with the relevant efficiency measure. In the same vein, board index is negatively correlated with each of the performance efficiency measures, while board ownership is positively correlated with CRS and VRS and negatively correlated with scale, thus producing mixed correlation patterns with each of the performance efficiency scores.
Discussion of the Performance Efficiency Results
The DEA result is based on three efficiency measures, namely
(i) DEA overall technical efficiency score, based on constant returns to scale (CRS). (ii) DEA pure technical efficiency score, based on variable returns to scale (VRS) and (iii) Scale efficiency score, which is the ratio of constant returns to scale to variable
returns to scale (i.e CRSE/VRSE).
Table 3: Technical efficiency scores of the 19 sampled banks based on CRS DEA model
DMU No COMPANIES TEcrs RTS CRS Peer Frequency
1 ACCESS 0.48402 IR 10,17 0
2 AFRIBANK 0.51876 IR 15,17 0
3 DIAMOND 0.42474 IR 10,17 0
Licensed under Creative Common Page 7
5 FIDELITY 0.23687 IR 17,18 0 Tab 3…
6 FIRST BANK 0.52645 IR 10,17 0
7 FCMB 0.37327 IR 17,18 0
8 GTB 0.72823 DR 10,17 0
9 INTERCONTINETAL 0.57837 IR 17 0
10 SKYE 1.00000 CR 10 9
11 STANBIC IBTC 0.61361 IR 17,18 0
12 UBA 0.96646 DR 10,17 0
13 UNION 0.79138 IR 17 0
14 UNITY 0.45507 IR 15,17 0
15 WEMA 1.00000 CR 15 3
16 ZENITH 0.94845 DR 10 0
17 BANKPHB 1.00000 CR 17 16
18 FINBANK 1.00000 CR 17 3
19 STANDARD CHARTERED 0.51303 IR 10,17 0
An examination of the technical efficiency scores of the 19 sampled banks on the basis of CRS technical efficiency scores (TECrs) show that only four (4) of the nineteen (19) sampled banks are efficient, while the rest fifteen (15) are inefficient. The four (4) efficient banks that were able to use their total asset and equity input to generate better output (returns) are Skye Bank, Wema bank, Bank PHB and Finbank Plc. It is instructive to find that the five big banks (First bank, GTB, Union bank, UBA and Zenith) are technically inefficient. The CRS peers and frequency results in table 3 also show that Skye Bank (9) and Bank PHB were examples of “best practice or well-income rounded generation performer”, both constituting role models to other peers in the set.
This means that inefficient banks in terms of income generation based on asset and equity input should learn from Skye Bank and Bank PHB 2009 business income generation models.
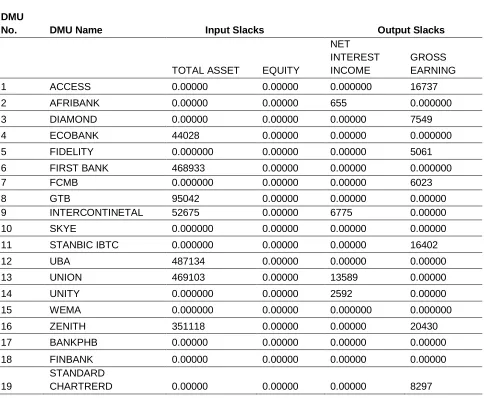
Licensed under Creative Common Page 8 Table 4: Inputs and outputs slacks of the 19 sampled banks based on CRS DEA model
DMU
No. DMU Name Input Slacks Output Slacks
TOTAL ASSET EQUITY
NET INTEREST INCOME
GROSS EARNING
1 ACCESS 0.00000 0.00000 0.000000 16737
2 AFRIBANK 0.00000 0.00000 655 0.000000
3 DIAMOND 0.00000 0.00000 0.00000 7549
4 ECOBANK 44028 0.00000 0.00000 0.000000
5 FIDELITY 0.000000 0.00000 0.00000 5061
6 FIRST BANK 468933 0.00000 0.00000 0.000000
7 FCMB 0.000000 0.00000 0.00000 6023
8 GTB 95042 0.00000 0.00000 0.00000
9 INTERCONTINETAL 52675 0.00000 6775 0.00000
10 SKYE 0.000000 0.00000 0.00000 0.00000
11 STANBIC IBTC 0.000000 0.00000 0.00000 16402
12 UBA 487134 0.00000 0.00000 0.00000
13 UNION 469103 0.00000 13589 0.00000
14 UNITY 0.000000 0.00000 2592 0.00000
15 WEMA 0.000000 0.00000 0.000000 0.000000
16 ZENITH 351118 0.00000 0.00000 20430
17 BANKPHB 0.00000 0.00000 0.00000 0.00000
18 FINBANK 0.00000 0.00000 0.00000 0.00000
19
STANDARD
CHARTRERD 0.00000 0.00000 0.00000 8297
From the table, it can be observed that among the mega banks, UBA had the highest total asset slack of N487,134 million, while Zenith had the least asset slack of N351,118 million.
VRS DEA Results
Table 5: Technical efficiency scores of the 19 sampled banks based on VRS DEA model
DMU No COMPANIES TEvrs VRS Peer Frequency
1 ACCESS 0.59609 10,15,19 0
2 AFRIBANK 0.72295 15,17,19 0
3 DIAMOND 0.55167 10,17,19 0
4 ECOBANK 1.00000 4 2
Licensed under Creative Common Page 9
6 FIRST BANK 0.53458 10,17 0 Tab 5…
7 FCMB 0.56449 10,15,19 0
8 GTB 0.73505 10,12,17 0
9 INTERCONTINETAL 0.66504 10,17,19 0
10 SKYE 1.00000 10 9
11 STANBIC IBTC 0.71522 15,17,18 0
12 UBA 1.00000 12 2
13 UNION 0.94389 4,10,19 0
14 UNITY 0.64584 15,17 0
15 WEMA 1.00000 15 7
16 ZENITH 1.00000 16 1
17 BANKPHB 1.00000 17 9
18 FINBANK 1.00000 18 2
19 STANDARD CHARTRERD 1.00000 19 7
In the VRS technical efficiency scores (TEVrs), it is found that eight (8) banks out of the 19 sampled banks are efficient, while 11 banks are found to be inefficient. Thus, a movement from the CRS DEA results to VRS DEA has made additional four banks efficient. These banks are Skyebank, Wema Bank, Bank PHB, Finbank, Ecobank, UBA, Zenith and standard chartered bank.
It can also be observed from then table that four banks – Skyebank (9), Wema bank (7), Bank PHB (9) Standard Chartered (7) as at 2009 operated banking business models that generated tremendous income, and could therefore be tagged “role models” which other banks should learned from. The results in table 5 further reveals that most of the mega banks were inefficient in resource utilization, as compared with some of their peers in the industry with small assets and equity inputs.
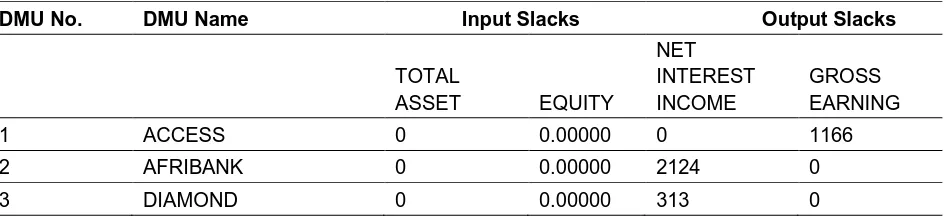
Similarly, in terms of asset slack, table 6 shows that some of the mega banks still had serious asset underutilization problem as at 2009. Table 6 shows the inputs and output slacks in the inefficient bank under the VRS model.
Table 6: Inputs and outputs slacks of the 19 sampled banks based on VRS DEA model
DMU No. DMU Name Input Slacks Output Slacks
TOTAL
ASSET EQUITY
NET INTEREST INCOME
GROSS EARNING
1 ACCESS 0 0.00000 0 1166
2 AFRIBANK 0 0.00000 2124 0
Licensed under Creative Common Page 10
4 ECOBANK 0 0.00000 0 0 Tab 6…
5 FIDELITY 0 0.00000 0 16444
6 FIRST BANK 454097 0.00000 1836 0
7 FCMB 0 0.00000 0 3372
8 GTB 7467 0.00000 0 0
9 INTERCONTINETAL 0 0.00000 12144 0
10 SKYE 0 0.00000 0 0
11 STANBIC IBTC 0 0.00000 0 27954
12 UBA 0 0.00000 0 0
13 UNION 380856 0.00000 26166 0
14 UNITY 0 0.00000 2832 0
15 WEMA 0 0.00000 0 0
16 ZENITH 0 0.00000 0 0
17 BANKPHB 0 0.00000 0 0
18 FINBANK 0 0.00000 0 0
19
STANDARD
CHARTRERD 0 0.00000 0 0
Scale Efficiency DEA Results
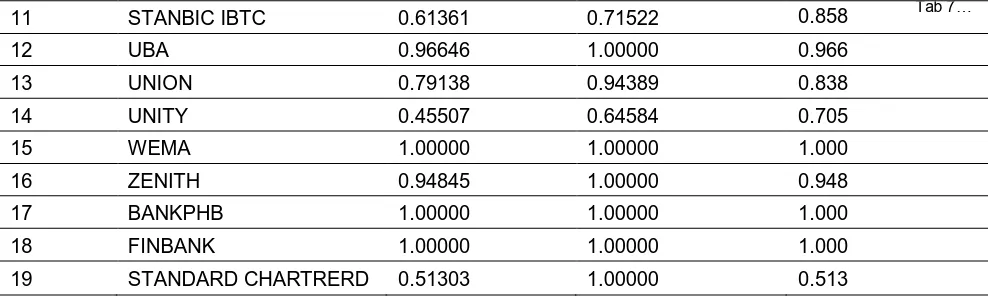
The scale efficiency is the ratio of overall technical efficiency (TECrs) to pure technical efficiency (TEVrs). It measures the ability of a bank to improve its efficiency irrespective of whether it operates at the right returns to scale or not. For a bank to be regarded as scale efficient, it must increase its output to a further level to reach the most productive scale. The scale efficiency DEA results is presented in table 7 below;
Table 7: Scale efficiency scores of the 19 sampled banks based on DEA model
DMU No COMPANIES
Overall technical efficiency
Input-oriented Tecrs
Pure technical
efficiency input-oriented Tevrs
Scale efficiency
(TEcrs/TEvrs)
1 ACCESS 0.48402 0.59609 0.812
2 AFRIBANK 0.51876 0.72295 0.718
3 DIAMOND 0.42474 0.55167 0.770
4 ECOBANK 0.64649 1.00000 0.646
5 FIDELITY 0.23687 0.36813 0.643
6 FIRST BANK 0.52645 0.53458 0.985
7 FCMB 0.37327 0.56449 0.661
8 GTB 0.72823 0.73505 0.991
9 INTERCONTINETAL 0.57837 0.66504 0.870
Licensed under Creative Common Page 11
11 STANBIC IBTC 0.61361 0.71522 0.858 Tab 7…
12 UBA 0.96646 1.00000 0.966
13 UNION 0.79138 0.94389 0.838
14 UNITY 0.45507 0.64584 0.705
15 WEMA 1.00000 1.00000 1.000
16 ZENITH 0.94845 1.00000 0.948
17 BANKPHB 1.00000 1.00000 1.000
18 FINBANK 1.00000 1.00000 1.000
19 STANDARD CHARTRERD 0.51303 1.00000 0.513
An examination of the scale efficiency results above reveals that only four (4) out of the 19 sampled banks are scale efficient, while the remaining 15 banks are scale inefficient. The scale efficient banks that were able to use their resources to improve their efficiency levels (i.e generate better outputs) under the CRS and VRS DEA assumptions are Skyebank, Wema bank, Bank PHB and Finbank. Thus, their management was successful in improving their efficiency level to higher productive scale. It is however interesting to note that in the same results, big banks like UBA and Zenith that were hitherto technically efficient under the VRS DEA model became scale inefficient due to diseconomies of scale in the two banks. The result of the scale efficiency is presented in table 8 below.
Table 8: ANOVA Test For Difference in DEA Score
Source SS DF MS F p-value
Between 0.272223 2 0.136112 3.116 0.0524
Within 2.359 54 0.0436855
Total 2.631 56
CONCLUSION
The study investigates the determinants of performance efficiency of Nigerian banks using a sample of 19 selected banks by employing the Data Envelopment Analysis (DEA) approach. Three performance efficiency scores models of constant returns to scale (CRS), variable returns to scale (VRS) and scale efficiency DEA models were adopted.
The estimation of results revealed the following;
(i) Small and medium banks were more performance efficient than the mega banks during the period;
Licensed under Creative Common Page 12 (iii) That board independence and board ownership structure are negatively related with
bank performance efficiency in Nigeria.
In line with the critical importance of bank performance efficiency to the survival, sustenance and growth of banks and the general economy, we recommend the following;
(i) A strong and resource management policies should be instituted by banks management in Nigeria;
(ii) Monetary authorities should carry out strict regulatory and supervisory risk management policies in commercial banks. Violators should be sanctioned appropriately;
(iii) Continuation of the financial sector reform process, with a critical focus on strategies to enhance bank performance efficiency in Nigeria.
LIMITATIONS OF THE STUDY
The limitation of the present study is that it used 19 banks out of the total 23 mega banks in Nigeria for the study. However, we believe that this could not have substantially affected the results and conclusion of the study.
REFERENCES
Aburime, T.U. (2008). Company-level determinants of bank profitability in Nigeria. Lagos Journal of Banking; Finance and Economic. 2(1).
Akhtar, M., Ali, K., & Sadaqat, S. (2010). Performance efficiency of commercial banks of Pakistan: Non-parametric technique data envelopment analysis (DEA). Asian Journal of Business and Management Sciences, 12), 150-156.
Alkhathlan, K., & Malik, S.A. (2010). Are Saudi banks efficient? Evidence using data envelopment analysis (DEA). International Journal of Economics and Finance, 2(2), 53-58.
Athanasoghou, P.P., Brissimus, S.N., & Delish, M.D. (2005). Bank-specific, industry-specific and macroeconomic determinants of bank profitability. Bank of Greece, Working Paper, No. 25.
Bdour, J.I., & Al-Khoury, A.F. (2008). Predicting change in bank efficiency in Jordan: A Data Envelopment Analysis. Journal of Accounting and Organization Change, 4(2), 162-181.
Bino, A. & Tomar, S. (2008). Corporate governance and bank performance: evidence from Jordanian banking industry.
Canholo, A., & Dermine, J. (2003). A note on banking efficiency in Portugal, New Vs Old Banks. Journal of Banking and Finance, 27, 2087-2098.
Chen, X., Skully, M., & Brown, K., (2005). Banking efficiency in China: Application of DEA to pre-and post-deregulation eras: 1993-2008.
Drake, L., Hall, M.J.R., & Simpler, R. (2006). The impact of macroeconomic and regulatory factors on bank efficiency: A non-parametric analysis of Hong kong’s banking system. Journal of Banking and Finance, 30, 1443-1466.
Licensed under Creative Common Page 13 Hassan, T., Mohamad, S., & Bader, M.K. (2009). Efficiency of conventional versus Islamic banks: Evidence from the middle east. International Journal of Islamic and Middle Eastern Finance and Management, 2(1), 46-65.
Isik, I. (2008). Productivity, technology and efficiency of Denovo banks: A counter evidence from Turkey. Journal of Multinational Financial Management, 18, 427-442.
Isik, I., & Hassan, M.K. (2003a). Efficiency, ownership and market structure, corporate control and governance in the Turkish banking industry. Journal of Business Finance and Accounting, 30, 1363 – 1421.
Jones, J., Izzeldin, M. & Pappas, V. (2009). The Efficiency of Islamic and Conventional Banks in the Gulf Cooperation Council (GCC) countries: An Analysis using Financial Ratio and Data Envelopment Analysis (online): available: http://eprints.lancs.acouk/48965/;Document.pdf. Accessed on September. 10, 2013
Olugbenga, S.O. & Olankunle, A.P. (1998). Bank performance and supervision in Nigeria: Analysing the transition to a Deregulated Economy, AERC paper 71: 1 – 62.
Siems, T.F. (1992). “Quantifying management’s Role in Bank Survival”. Federal Bank of Dallas Economic Review, first quarters: 29 – 41.
Somoye, R.O.C. (2008). The performance of commercial banks in post-consolidation period in Nigeria: An empirical review. European Journal of Economics, Finance and Administrative Sciences. 14, 62-73.
Soyibo, A. & Adekanye, F. (1991). The Nigerian bank system in the context of policies of financial regulation and deregulation, African Economic Research Consortium, Nairobi.
Sufian, F. (2009). Determinants of bank efficiency during unstable macroeconomic environment: Empirical evidence from Malaysia. Research in International Business and Finance 23, 54-77.
Wu, C.C., Kao, S.C., & Cheng, H.H. (2006). Examining retailing performance via financial index. Asia pacific management review. 11(2),83-92.
Yao, S., Jiang, C., Feng, G., & Willenbockel, D. (2007). On the efficiency of Chinese banks and INTO challenges. Journal of Applied Economics, 39, 629-643.