University of Warwick institutional repository: http://go.warwick.ac.uk/wrap
This paper is made available online in accordance with
publisher policies. Please scroll down to view the document
itself. Please refer to the repository record for this item and our
policy information available from the repository home page for
further information.
To see the final version of this paper please visit the publisher’s website.
Access to the published version may require a subscription.
Author(s): J. Neilsen, D. Steeghs, S. D. Vrtilek
Article Title: The eccentric accretion disc of the black hole A0620−00
Year of publication: 2008
Link to published article:
http://dx.doi.org/10.1111/j.1365-2966.2007.12599.x
Publisher statement: The definitive version is
arXiv:0710.3202v1 [astro-ph] 17 Oct 2007
The Eccentric Accretion Disc of the Black Hole A0620-00
⋆
J. Neilsen,
1†
D. Steeghs,
2,3S.D. Vrtilek
21Harvard University Department of Astronomy, 60 Garden Street, MS-10, Cambridge, MA 02138 2Smithsonian Astrophysical Observatory, 60 Garden Street, Cambridge, MA 02138
3Department of Physics, University of Warwick, Coventry CV4 7AL, UK
Released 2007 Xxxxx XX
ABSTRACT
We present spectroscopic observations of the quiescent black hole binary A0620-00 with the the 6.5-m Magellan Clay telescope at Las Campanas Observatory. We mea-sure absorption-line radial velocities of the secondary and make the most precise de-termination to date (K2= 435.4±0.5 km s−1). By fitting the rotational broadening
of the secondary, we refine the mass ratio toq= 0.060±0.004; these results, combined with the orbital period, imply a minimum mass for the compact object of 3.10±0.04 M⊙.Although quiescence implies little accretion activity, we find that the disc con-tributes 56±7 per cent of the light in B and V, and is subject to significant flickering. Doppler maps of the Balmer lines reveal bright emission from the gas stream-disc impact point and unusual crescent-shaped features. We also find that the disc centre of symmetry does not coincide with the predicted black hole velocity. By comparison with SPH simulations, we identify this source with an eccentric disc. With high S/N, we pursue modulation tomography of Hα and find that the aforementioned bright regions are strongly modulated at the orbital period. We interpret this modulation in the context of disc precession, and discuss cases for the accretion disc evolution.
Key words: accretion, accretion discs — stars: individual: A0620-00 — binaries: close
1 INTRODUCTION
A0620-00 (V616 Mon) is the prototype Soft X-ray Transient, a class of low-mass binary stars which exhibit infrequent but intense X-ray bursts (Gelino, Harrison, and Orosz, 2001). In 1975 it became the brightest X-ray nova ever detected, at ap-proximately 50 Crab (Elvis et al. 1975), and it was the first nova to be identified with a black hole primary (McClintock & Remillard, 1986; hereafter MR86). MR86 measured an or-bital period of 7.75 hr and a radial velocity semiamplitude for the K-type secondary of 457 km s−1, leading to a mass
functionf(M) = 3.18 M⊙; estimates ofK2 andf(M) have
decreased slightly since then (i.e. 433 km s−1and 3.09 M
⊙) (Marsh, Robinson, & Wood 1994, hereafter MRW94). Given this minimum mass, it is likely that A0620-00 is a black hole. A substantial amount of work has gone into the anal-ysis of A0620-00 in the last twenty years, with particular emphasis on ellipsoidal variations in the light curve and the contamination of the K-star flux by light from the accretion disc. As yet, no real consensus has been reached, mostly due
⋆ This paper includes data gathered with the 6.5-m Magellan
Telescopes located at Las Campanas Observatory, Chile.
† E-mail: [email protected] (JN); [email protected] (DS); [email protected] (SDV)
to the complexity of the lightcurves. While ellipsoidal vari-ations are obvious, they are highly asymmetric (Leibowitz, Hemar, & Orio 1998); the origin of the asymmetry is un-determined. Modelling this lightcurve, Gelino et al. (2001) determined in inclination of 41±3◦, invoking starspots to ex-plain the asymmetries. Shahbaz, Naylor, and Charles (1994) found a 90 per cent confidence interval ofi=30–45◦ given the mass ratio of A0620-00, modelling their asymmetries with the bright spot where the accretion stream hits the disc.
Table 1.Observation log
Source Date # of Spectra Texp(s)
A0620-00 2006 Dec 14 11 873 A0620-00 2006 Dec 15 23 698 A0620-00 2006 Dec 16 14 433
HILT 600 2006 Dec 14 1 20
HILT 600 2006 Dec 15 3 20
HILT 600 2006 Dec 16 3 20
HD 18298 2006 Dec 15 3 5
HD 7142 2006 Dec 15 5 5
Texpis the average exposure time for the source.
noticed signatures of an eccentric disc not seen in previous Doppler maps, but lacked the phase coverage to verify their hypothesis.
Therefore, as follow-up to the work of MRW94 and S04, and as part of a Doppler imaging survey of black hole and neutron star binaries, we undertook phase-resolved optical spectroscopy of A0620-00. In §2 we describe our observa-tional methods and data reduction. In §3 we measure the radial velocity of the secondary star, the system mass ratio, and attempt to quantify flickering. In§4 we present Doppler images of the accretion disc at several wavelengths, inves-tigate evidence for an eccentric disc, and report results of modulation tomography of the Hαline. We discuss conclu-sions from the variability of the disc and our Doppler maps in§5.
2 OBSERVATIONS
We observed A0620-00 with the Low-Dispersion Survey Spectrograph (LDSS3) at the f/4 focus of the 6.5-m Clay telescope at Las Campanas observatory on 2006 December 14–16. We acquired 48 spectra using the VPH Blue grism and a long 0.75 arcsec slit. By shifting the slit 4◦redward, we were able to observe Hαwith the superior resolution of the Blue grism (2.3 ˚A≡130 km s−1), covering 4250–7035
˚
A. To minimize the effects of atmospheric dispersion, we ob-served at parallactic angle. Our exposure times ranged from 420 s to 1200 s, with an average of 660 s (a total of 8.81 hours on the source).
Each night we observed the flux standard HILT 600 with the same instrumental setup as A0620-00. On all nights the seeing was generally comparable to our slit width, but occasionally spiked as high as 1.8 arcsec due to wind, and slit losses prevented precise flux calibration. On 2006 Dec 15 we also observed two K3/K4 stars, HD 18298 and HD 7142, as velocity standards, again with the same optical setup. As the secondary is constrained to be later than K3V Froning et al. (2007), we expect more accurate results for HD 7142, which is listed as K3/K4III in the SIMBAD database (HD 18298 is listed as K3IIICN). For each pointing, we obtained com-parison HeNeAr arc lamp spectra after every 3–7 spectra, depending on the current exposure time. We list the obser-vations in Table 1.
We used standard IRAF routines for basic data reduc-tion (zero-subtracreduc-tion, flat-fielding, and spectral extracreduc-tion). We extracted our spectra in multispec format, attempting
apall’s optimal extraction using nominal LDSS3 gain,
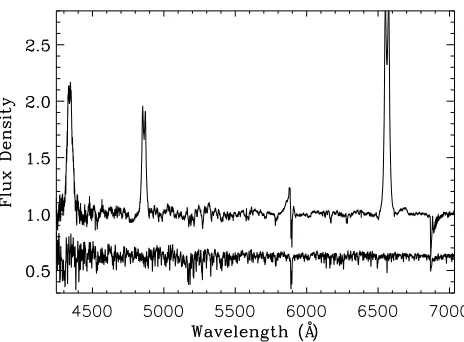
read-Figure 1.The average normalized spectrum of A0620-00. The strongest features are, in order of increasing wavelength, Hγ,Hβ,
Hei5875, Hα,Heii6678, and telluric absorption lines. We also show the scaled spectrum of HD 7142 for reference.
out noise, and full-well values. The routine also performs standard extraction and generates error bars. A CCD de-fect running across our spectra prevented reliable fits to the spatial profile for optimal extraction, so we used the nor-mally extracted spectra instead. This choice did not signifi-cantly degrade our S/N, and should have a negligible effect on our presented results. After wavelength calibration, we passed the spectra and their errors to the software package MOLLYfor cleaning and analysis.
3 ANALYSIS
3.1 The spectrum of A0620-00
In Figure 1 we present the average normalized spectrum of A0620-00. The spectrum shows a number of strong features (originating from the disc) and many relatively weak K-star absorption lines. We overplot the K-dwarf template HD 7142 for reference. We have extremely high S/N Hαand Hβlines, both observed by MRW94, as well as lower S/N Hγ and Hei 6678˚A. The non-detections of Heiilines indicates the scarcity of ionizing radiation. Our Hαline is stronger relative to the continuum than in 1994 by approximately 50 per cent. This relative brightening is not surprising given the decreased fraction of light contributed by the secondary. We show a close-up of Hαin panel a of Figure 2. The profile has two strong symmetric peaks. It is also interesting that our Hβ line also shows two strong peaks (as opposed to a single-peaked line seen by MRW94).
The other feature of note is located on top of the in-terstellar sodium doublet near 5890 ˚A. We show a close-up of this line in panel b of Figure 2. The line suffers signifi-cant extinction by interstellar sodium, so it is not possible to identify its peak unequivocally, but it seems to be Hei
[image:3.612.42.245.123.228.2]Figure 2.Close-ups of a) the Hαline and b) the feature near 5890˚A. Intensities are as in Figure 1.
3.2 The radial velocity of the secondary star
Following MRW94, we first measure the radial velocity of V616 Mon in order to estimate the mass function. Mask-ing out emission lines, telluric absorption, and interstellar sodium lines in our velocity standards, and normalizing, we cross-correlated our spectra against these K-dwarf tem-plates. The results of the following sections are presented in Table 2.
As discussed in MRW94, this process requires several adjustments for A0620-00: rotational broadening and orbital smearing. The following analysis was completed for each template. We performed a preliminary broadening of the template with MRW94’s value ofvsini= 83 km s−1. Then,
after cross-correlating, we shifted our spectra into the rest frame of the template, which is essentially the rest frame of the secondary. We made 48 copies of the template and smeared each according to the formulas= 2πViTi/P,where
P is the orbital period and Vi and Ti are the radial veloc-ity and exposure time for theith A0620-00 spectrum. With exposure times of up to 1200 s, it is necessary to correct for smearing becausesis comparable tovsini.We averaged the smeared templates, rotationally broadened the result with a value between 30 and 135 km s−1, and optimally
sub-tracted the final template from the average object spectrum. We assume a limb-darkening coefficient εof 0.65 (Wade & Rucinski 1985, and references therein), but perform these calculations forε= 0.45−0.85 to evaluate our systematics. The optimal subtraction routine returns the fraction f of light contributed by the secondary and a χ2 value. We fit
fourth-order polynomials to χ2 to identify the appropriate
f andvsini.Results are included in Table 2.
The measured rotational broadening of V616 Mon (80± 2 for HD 18298 and 83±2 for HD 7142) is consistent with MRW94, butfis not, even thoughfandvsiniwere strongly correlated (i.e. we were able to identify them with the same χ2minimum). MRW94 found that the secondary contributes
∼94 per cent of the light near Hαand∼85 per cent of the light near Hβ. We observed both wavelengths simultane-ously, and find that the secondary contributes only 44 per cent of the light inBandV (near 5500 ˚A). This conclusion
is effectively independent of the limb-darkening coefficient. We will discuss systematic uncertainties onf in§3.4.
Finally, we performed another cross-correlation of our spectra against the template, this time with the appropriate value ofvsini.The results are shown in Figure 3. Although we took arc exposures frequently to minimize the effects of flexure, we found arc scales to drift by∼0.5 ˚A over the course of a few hours. As our dispersion (0.69 ˚A pixel−1
) corresponds to 37.9 km s−1 pixel−1, it was necessary to
compensate for arc drift. We did this by cross-correlating the telluric lines near 6900 ˚A and shifting out the result-ing velocities (generally around 10 km s−1). In this way we
guaranteed a common (heliocentric) rest frame for all 48 spectra.
We fit a function of the formV =K2sin(2π(t−t0)/P)+
γ for each template. γ represents the systemic velocity in the template frame. Although we have very high S/N, the baseline (∼7 orbits) was insufficient to make a reliable in-dependent determination of the orbital period, so we fixed P according to the ephemeris of MR86. To get an accu-rate measure of our statistical uncertainties, we performed 10,000 Monte Carlo simulations for each fit, assuming each radial velocity to be distributed normally around the mea-sured value, increasing the errors from cross-correlation by a factor of three. For our final values, we averaged the re-sults from both templates and took the standard deviation of the combined distribution as the uncertainty. The result-ing uncertainty is not purely statistical, as the use of multi-ple templates includes some systematic errors (e.g. template mismatch). These results can be found in Table 2.
All fits are comparable in quality and have excellentχ2.
We find consistent values forK2 and excellent agreement in
t0 – we observed inferior conjunction on the second night
– and our measurements are independent of limb-darkening (ε=0.65 is marginally preferred). We will consider the sys-temic velocities only briefly. The uncertainties inγare dom-inated by the systematic uncertainty (one fifth of a pixel, or ∼7.6 km s−1). We were unable to find a cataloged
ra-dial velocity for HD 18298, but from Malaroda et al. (2001), the radial velocity of HD 7142 is 32.8 km s−1. Given that
MRW94 report a systemic velocity of 22 km s−1, we
con-sider these fits to be accurate; the choice of template does not significantly affect K2, t0, or vsini. In summary, we
adoptvsini= 82±2 andK2= 435.4±0.5 km s−1.In
ad-dition, we find that inferior conjunction of the mass donor star, which defines the zero point t0 of our ephemeris,
oc-curs at HJD (UTC) 2454084.69485±0.00005. This latestt0
is consistent with the ephemeris of MR86 (within 0.5σ).
3.3 The mass ratio
To measure the mass ratio, we use Paczynski’s (1971) for-mula relating the rotational broadening and K2 to q for
Roche lobe-filling stars,
vsini K2
= 0.462[(1 +q)2q]1/3. (1)
Figure 3.Radial velocity of V616 Mon. Two cycles are shown for clarity. Filled circles correspond to the template HD 18298, and open circles to HD 7142. Note from Table 2 that the main difference is inγ.
Table 2.Fits to rotational broadening and radial velocities.
Template ε vsini f K2(km s−1) t0−2454084 γ(km s−1) q f(M1) (M⊙) χ2
(km s−1)±2 ±0.001 ±0.4 ±4E-5 ±8 ±0.004 ±0.03
HD 18298 0.45 77 0.441 435.8 0.69487 11 0.051 3.06 1.06
0.55 78 0.441 435.8 0.69487 11 0.052 3.07 1.06
0.65 80 0.440 435.8 0.69487 11 0.057 3.09 1.05
0.75 80 0.441 435.8 0.69487 11 0.056 3.09 1.06
0.85 81 0.441 435.8 0.69487 11 0.058 3.10 1.06
HD 7142 0.45 80 0.433 435.0 0.69484 -9 0.056 3.07 1.03
0.55 80 0.433 435.0 0.69484 -9 0.057 3.08 1.03
0.65 83 0.449 434.9 0.69484 -9 0.063 3.11 1.02
0.75 83 0.433 435.0 0.69484 -9 0.061 3.10 1.03
0.85 84 0.433 435.0 0.69484 -9 0.064 3.12 1.03
including gravity darkening and quadratic limb darkening. Although it might be possible with our improved resolution to distinguish between the Paczynski approximation and the grid models, since the grid model correction was far from significant at their 1σ level, we opt to take our results as accurate. This choice is validated by the weak (at best) de-pendence of our measurements on limb darkening, and we report uncertainties large enough to account for any system-atics inε.
Given the orbital period, K2, and q, the minimum
masses for both objects are:
f(M1) = 3.10±0.04 M⊙ f(M2) = 0.19±0.02 M⊙,
where the true mass goes like Mmin/sin3i.As noted in many
papers (MRW94; Shahbaz et al. 1994), the mass of a maxi-mally rotating neutron star with the stiffest equation of state is 3.2 M⊙; if causality is the only constraint, the absolute upper limit is 3.76 M⊙(Friedman & Ipser 1987). Using the constraints 39◦6 i6 75◦ (Gelino et al. 2001), we find 3.4 M⊙ 6 M1 6 12.6 M⊙, with the most likely value at 11.1
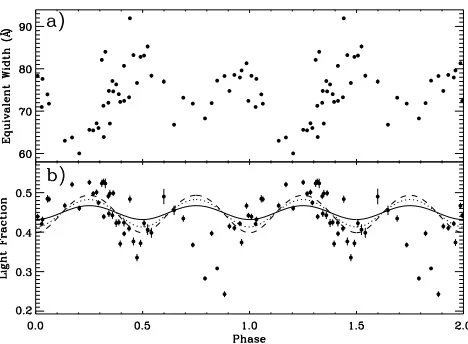
[image:5.612.81.546.463.597.2]Figure 4.a) Equivalent width of the Hαline. b) Secondary light fraction as measured from 5000–5800 ˚A and 6000–6500 ˚A for the template HD 7142. Differences from HD 18298 are less than 1σ.
These plots indicate a flickering source of light. The solid, dotted, and dashed lines are the predicted light fraction for a constant disc and ellipsoidal modulations, for inclinations of 40◦, 60◦, and 80◦, respectively. See Equation 2.
3.4 Ellipsoidal variations and the variability of
the disc
Part of the difficulty in measuring the parameters of A0620-00, and a possible source of systematic error, is the tidal distortion of the secondary. We assume, for example, in our radial velocity measurements, that the secondary’s centre of light coincides with its centre of mass. For a star filling its Roche lobe with some gravitational and limb darkening, this assumption is not likely to be valid. Following Sterne (1941), we checked for this distortion in our data by fitting an extra −Kellsin(4πφ) term to our radial velocity curve.
Orbital elements from Gelino et al. (2001) lead to a pre-dictedKell = 3.0 km s−1, but we foundKell∼0.7 km s−1
(less than the error bars on each radial velocity), and an insignificant improvement toχ2.It is possible that our data
have insufficient S/N to make this measurement. This par-ticular effect is small, but we must be careful not to dismiss the systematic uncertainties from ellipsoidal effects.
Ellipsoidal variations, particularly in the lightcurve, re-ceive a great deal of attention because of the constraints they place on the orbital parameters, especially the inclina-tion. In practice, one usually attributes all variation to the secondary (assuming the disc to be constant). However, the fact that the fraction of light contributed by the disc changes by a factor of nine over ten years casts significant doubt on that particular assumption. In turn, this evolution must be accounted for when interpreting lightcurves spanning a long period of time.
Given that we have good spectral resolution and rela-tively good phase coverage, we have attempted to charac-terize the ellipsoidal variations of the source during our ob-servations. While it is most common to address variations in the lightcurve, effects of tidal distortion should also be apparent in the secondary light fraction and the line equiv-alent widths. In the rest of this section we quantify these variations.
If the disc is a constant diluting source of light, then
con-tinuum variations, and therefore variations in the equivalent widths of lines, maybe be attributed to the tidal distortion of the secondary. In Figure 4a we show the equivalent width of the Hαline as a function of orbital phase. The asymmet-ric ellipsoidal variations observed by Gelino et al. (2001) are obvious, along with noticeable scatter. Given a S/N of∼95 at Hα, it seems reasonable to interpret this as flickering, al-beit undersampled, rather than noise. We will discuss the equivalent widths in more detail shortly.
Figure 4b shows the secondary light fractionfas a func-tion of orbital phase. We can evaluate the variability of the disc with a back-of-the-envelope calculation off(φ).We as-sume the secondary continues to exhibit ellipsoidal varia-tions of 0.077 mag (MRW94 using i= 40◦), or flux varia-tions of 7 per cent, and that the disc is constant in time. Since the disc contributes 56 per cent of the light, it should be roughly 22 per cent brighter than the secondary. Then in units of the mean secondary flux,F2 = 1−0.07 cos(4πφ)
andF1= 1.22,and
f= 1−0.07 cos(4πφ)
2.22−0.07 cos(4πφ). (2)
The inclination-dependent amplitude of ellipsoidal varia-tions is tabulated in MRW94. Equation 2 is plotted along withffor inclinations of 40, 60, and 80◦.We have matched the mean relatively well, and to some extent the functional form, but it is obvious that our assumptions do not hold. First, the disc appears anomalously bright betweenφ=0.7– 0.9. As this phase interval was observed on the second night only, we cannot speculate if the dip in f indicates a flare or a long-lived bright region of the disc, like a warp, visible only at this phase.
The second and more troubling discrepancy is the large amplitude of variation off.As is apparent from Figure 4b, excludingφ=0.7–0.9, higher inclinations are preferred, even those which are ruled out by the lack of eclipses in this source. Accepting momentarily the inclination determined by Gelino et al. (2001), this figure illustrates very clearly the significance of the assumption that the disc is a con-stant source of light; by requiring a concon-stant disc, we could overestimate the inclination by several tens of degrees. Now it is reasonable to assume that the secondary has not evolved substantially in the last twenty years, so we must conclude that the discrepancy between the predicted and observed light fractions is related to activity in the disc. For example, a component of disc light modulating at the orbital period could reproduce the effect easily.
reason f cannot be small and constant simultaneously, but an increase in light from the disc can only mean an increase in accretion activity, for which flickering is highly probable. This is admittedly a grim assessment of the situation, but lightcurve estimates of the inclination made during pe-riods of variability or non-negligible contamination by disc light are unreliable. The variation infitself is a final source of systematic uncertainty. We have a very precise measure-ment of the dilution fraction for the average spectrum, but that precision is only meaningful iffis not variable. Instead, we take the standard deviation inf(φ) as our uncertainty: f= 44±7 per cent, and summarize the discussion above by reminding the reader that quiescence is not inactivity, and ought not be used to justify invalid assumptions.
Consider now the equivalent width. Since the contin-uum varies slowly over our lines, it is trivial to show that the line equivalent width is given by
EW (˚A)≃EWdisc
1 +f , (3)
whereEWdiscis the ratio of flux integrated over the line to
the disc continuum, andfis the secondary light fraction. If the disc varies uniformly or not at all, EWdiscshould be a
constant for any given line. We can then attribute variations in the equivalent width to variations in f,which would be ellipsoidal in nature. However, measurements of the equiva-lent width with the secondary subtracted should reveal the reliability of this shaky assumption.
The equivalent width of our unsubtracted Hαline (open circles) is shown in Figure 5; it should be compared to the same plot from MRW94. To facilitate this comparison, we have overlaid their best-fitting line. We find good agreement with their phasing and amplitude, but an increase in average equivalent width of approximately 13 ˚A. As noted earlier, the H-alpha line is brighter relative to the continuum than it was in 1994, so this increase is reasonable. Also shown in Figure 5 (filled circles) is the equivalent width of the same line after subtraction of the secondary. To achieve this re-sult, which indicates the magnitude of fluctuations in the disc, we normalized, broadened, and smeared the template, subtractedf(φ) times the template from each spectrum, and set the continuum to one. The dip between phases 0.7 and 0.9 corresponds to the possible flare seen in the light frac-tion.
We also note that the subtracted modulations are in phase with the unsubtracted equivalent widths. As the sec-ondary is expected to contribute more light at longer wave-lengths, the phasing may be an artefact of improper sec-ondary subtraction, because the strongest contributions to f come from 5000–5800 ˚A. However, this effect should be small because absorption lines up to 6500 ˚A were used in the measurement. Even if this is the case, the scatter inEWdisc
cannot be explained by the combined noise in f and EW. We suggest that the most probable extra source of scatter is physical variability of the disc, i.e. flickering. In this case, the fact that the subtracted equivalent width is not con-stant suggests that the disc fluctuations cannot be spatially uniform.
[image:7.612.307.540.98.268.2]Our measurements of flickering are confirmed by nearly simultaneous observations with all four IRAC bands on Spitzer and the 1.2m FLWO telescope (McClintock 2007, private communication). These observations, taken in the
Figure 5. Measured equivalent widths for the Hα line from A0620-00. Open circles correspond to unsubtracted spectra; filled circles were calculated after subtracting the template HD 7142. Again, differences between templates were insignificant, and the errors are smaller than the circles because of the extreme signal-to-noise. We have plotted MRW94’s best fit for comparison.
last week of November 2006, show strong erratic variability which is well-correlated between telescopes. Neither ellip-soidal variations nor the orbital period is obvious through these fluctuations. The conclusion is clear: the assumption that the disc is constant is not valid, though it may be a good approximation if the disc contribution to the contin-uum is negligible (for example, when Gelino et al. (2001) found f & 97 per cent and i = 41±3◦). To investigate further the spatial and temporal intensity of the disc, we present the results of Doppler tomography and modulation tomography in§4.
4 DOPPLER IMAGING
In this section we discuss the results of Doppler tomogra-phy of the emission lines from A0620-00. To create each image, we subtracted the scaled HD 7142 spectrum, per-formed a linear fit to the continuum around each line, nor-malized, and set the surrounding continuum to zero (re-quired byDOPPLER). MRW94 express some uncertainty as to the propriety of interpolating over the Hα line in the template spectrum. Doing so removes an image of the donor star in the map, and it is not clear which is the appropri-ate choice. However, we found that Doppler maps including the light from the secondary do not show donor emission, so we chose to interpolate over the line. Then we binned the spectra to a uniform velocity scale and passed them to the DOPPLERroutine, which computes the maximum entropy image that reproduces the observed line profiles during the course of an orbital period. For an excellent summary of the method, see Marsh (2001).
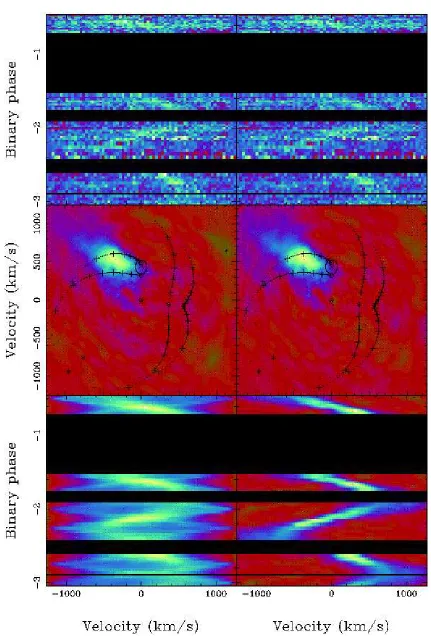
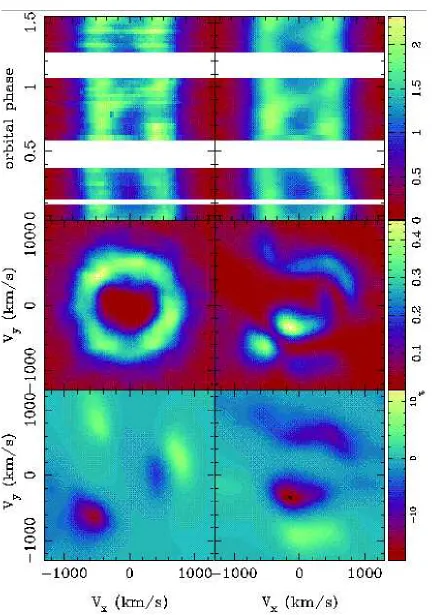
4.1 The maps
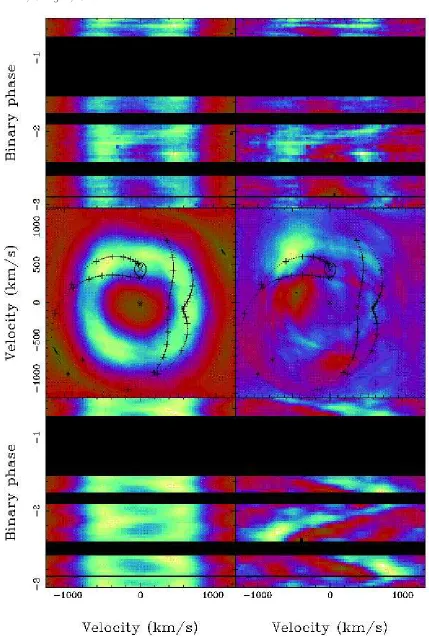
observed data minus a simulated symmetric part, the asym-metric part of the Doppler map, and its fitted data. In the maps, we plot the Roche lobe of the secondary, the ballistic trajectory of the gas stream (lower line), and the Keplerian velocity of the disc along the stream (upper line).
In Figure 6 we show the maps of Hα. The most obvi-ous feature is the bright spot, which corresponds to the gas stream impact point. As found by MRW94 and S04, in our maps the gas stream trajectory and the Keplerian disc ve-locity along t he stream (the two lines plotted in the map panels) bracket the bright spot. We can interpret this as post-shock emission, originating somewhat inside the outer edge of the disc (Marsh et al. 1990). Using the ballistic tra-jectory, we locate the spot atr= 0.6±0.05RL1.If the disc
velocities are Keplerian and the spot moves with the disc, we find the outer edge nearr= 0.45±0.05RL1.This is some
indication of our systematic uncertainties, but we shall sug-gest shortly that the larger disc is more likely.
The other features of note are the two crescents at∼7 o’clock and∼2 o’clock. We shall address their origin shortly. The fitted data are rather messy, mainly due to the pres-ence of those features and the strong flickering. Because the crescents and the bright spot so thoroughly dominate the image, the symmetric part is too bright, and we oversub-tract to make the asymmetric part. Still, we do detect some emission from the bright spot. The trail itself is not partic-ularly sinusoidal: it is more of a zigzag than an S-wave. The discrepancy is best seen in the simulated asymmetric trail (bottom right, Figure 6), but is apparent in the top panels as well. In the data panel (top left), the trail is diagonal between φ = −3 and φ = −2.5, but nearly horizontal at φ =−2. It is difficult to interpret this as the S-wave of a circular orbit. If the orbit is not circular, it may be a com-bination of the ballistic trajectory of the stream and the motion of the disc, or it may be an elliptical orbit.
In Figure 7 we show maps of Hβ. Again, we see the cres-cent features; their shape is more apparent despite the lower S/N at Hβ.For the same reason, we have less trouble com-puting the symmetric part, and our asymmetric part shows some emission along the stream. While the corresponding trail does look nicer than its Hαcounterpart, the two seem to be consistent. In Figure 8 we show maps of Hγ, and in Figure 9 we show maps of Hei 6678. These two maps, at much lower S/N, reveal bright spot emission with some con-tribution from the stream itself.
4.2 The eccentric disc of A0620-00
In the previous sections, we have presented evidence for a bright flickering disc which contributes more than half of the light from the source in the optical. It is already clear that the “no intrinsic variability” assumption of Doppler to-mography is not satisfied by A0620-00. We should therefore exercise caution in interpreting our Doppler maps. Tomog-raphy is a robust technique, but the physical relevance of its results depends on the extent to which its assumptions are violated. For example, we assume that all velocity vectors corotate with the binary. However, if the disc is large enough, it may reach an orbital resonance with the secondary and become eccentric by tidal distortions. It will then precess, even in the corotating frame. For the mass ratio of A0620-00, the dominant resonance is 3:1 (Whitehurst & King 1991).
Recent SPH simulations by Foulkes et al. (2004) show that the manifestations of eccentric discs are bright emission be-tween the gas stream and the Keplerian disc velocity along the stream, non-sinusoidal S-waves, crescent-shaped features in Doppler maps, and the shifting of the map centre of sym-metry away from (0,-K1).
S04 observed the first three features and invoked an ec-centric disc, but they also point out one possible objection: MRW94 found a clean circular disc. However, we have expo-sure times comparable to MRW94 with a larger telescope; our higher signal to noise may have enabled us to detect this phenomenon. The other explanation is that the cres-cent was absent in 1994, and the source has changed. It is thought that A0620-00 has an outburst recurrence time of 58 years, and more than half of that time has passed since 1975, so the system should be gearing up for a new outburst. In the disc instability model of outbursts, the disc steadily recharges between outbursts, growing in size and density until it becomes unstable. In the context of this model, it is quite possible that since 1994, we have actually watched the disc expand towards the 3:1 resonance (r=0.66RL1) and
become distorted. If this resonance is inside the disc, then the distortion time-scale is q−2P
orb, or about ninety days
(Frank et al. 2002). If not, the process is slower, but a change over twelve years for A0620-00 seems reasonable.
Now if the disc is actually circular, the Doppler map should be radially symmetric about the point (0,-K1), and
by locating the centre of the disc, we can identify the radial velocity of the black hole (Steeghs & Casares 2002). Oth-erwise, the eccentricity of the disc should be evident in a discrepancy between the observed and predicted locations of this point. We therefore implemented a search for the disc centre of symmetry, starting at the predicted point and extending±200 km s−1in V
xandVy,subtracting the
sym-metric part, squaring, and computing the mean and stan-dard deviation. The point with the lowest mean corresponds to the centre of symmetry. We iterated our search, updating the centre and improving the resolution until we found the minimum.
Since our disc is very structured, it was difficult to find a region of the image unaffected by bright spots, so we per-formed our search on a smoothed version of the map. We then ran 10,000 Monte Carlo simulations to find the centre of symmetry, using the standard deviation of the residuals as the uncertainty to be sampled. Combining the results for our Hα and Hβ maps, we find the center of symmetry at (80,-220)±(40,20) km s−1, well outside the uncertainty in
K1.Since we cannot explain a factor of nine of implied
in-crease inq,we take this result, coupled with the bright spot locationa and the crescent features in the maps, as evidence for the non-zero eccentricity of the disc.
With improved spectral resolution, a sequence of 3–4 full nights (for sufficient phase coverage per night) sampling the precession period should allow the motion of the center of symmetry of the disc to be resolved.
4.3 Modulation tomography
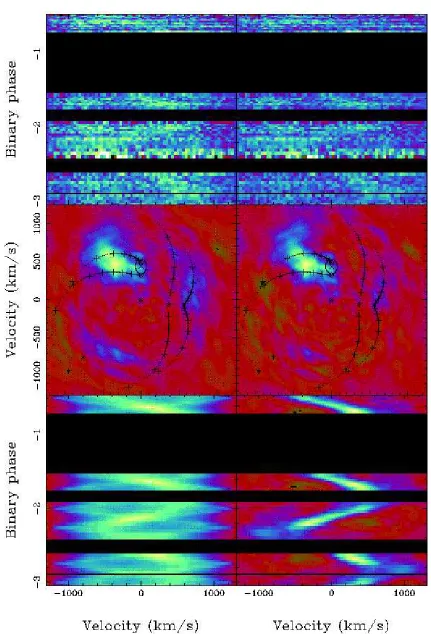
It is also possible to relax the assumption of Doppler tomog-raphy that the source flux is constant throughout the orbit (Steeghs 2003). The new technique of modulation tomog-raphy allows not only the imaging of average line emission from an accretion disc, but also maps harmonic variations on the orbital period. The technique is robust and flexible, but requires somewhat better S/N than standard tomographic imaging. Therefore we only consider our Hα profile here. The process of creating modulation maps is quite similar to standard tomography, and is described in Steeghs (2003). The map is presented in Figure 10.
It is clear from the fitted data (top right), that modula-tion tomography does a much better job reproducing the trail than standard Doppler mapping. Whereas standard mapping could only reachχ2 = 35,we were able to attain
χ2= 9.75 with modulation tomography. The poorχ2is due
to flickering. The constant portion of the map (middle row, left panel) looks quite similar to the maps presented in previ-ous sections, though the bright spot is significantly smaller. We still place it off the gas stream trajectory, but it is much less diffuse, and is located, as before, near r = 0.6RL1.It
is clear from this image that the inner edge of the disc in velocity space, and thus the outer edge of the disc in phys-ical space, extends as far as 0.7RL1.The crescents are not
nearly as prevalent in the constant part, but are apparent in the modulation maps. The crescent placed at 7 o’clock in the standard map appears in the cosφmap (bottom left) and the crescent placed at 2 o’clock appears in the sinφmap (bottom right). The full modulating amplitude is shown in the middle row, right panel.
For an erratic source like A0620-00, these maps must be interpreted carefully. Modulation tomography, as men-tioned, maps only harmonic variations, and the demon-strated flickering is hardly harmonic. However, we have shown the eccentric disc to be a viable explanation for the observed phenomena, and the regions responsible for the crescent emission are not constant by any means. It is clear from the constant image that the inner edge of the disc in velocity space, and thus the outer edge of the disc in physi-cal space, extends as far as 0.7RL1,lending credence to the
3:1 resonance argument. For typical disc precession, super-humps are observed with periods 3−5 per cent off the orbital period (Whitehurst & King 1991). If indeed this modulating emission is caused by viscous dissipation at the outer edge of an eccentric precessing disc, there should be some power atPorb,though a map of variation at some superhump
pe-riodPsh would reveal larger amplitudes. As yet, such a map
is not possible. None the less, modulation tomography has provided yet another piece of evidence for our eccentric pre-cessing disc model, and the fact that there is a component of disc light modulating at the orbital period could explain the observed light fraction from the secondary.
5 DISCUSSION
We have presented spectroscopic analysis of the black hole binary A0620-00. We measure an absorption-line radial ve-locityK2= 435.4±0.5 km s−1. With two measurements of
the rotational broadening of the secondary, we find a mass ratio ofq= 0.060±0.004 and a minimum mass of 3.10±0.04 M⊙for the primary object. With the most likely inclination of 41◦from Gelino et al. (2001), measured inJ, H,andK, the black hole has a mass of 11.1 M⊙.The strong infrared flickering discussed earlier, in conjunction with unexplained smooth variability in the lightcurve and uncertainty in the disc spectrum itself, makes it difficult to estimate the true uncertainty in the inclination. The range of reported inclina-tions, 31◦to 70.5◦(Gelino et al. 2001 and references therein), results in a black hole mass between 3.7 M⊙and 22.7 M⊙. Until the nature and variability of the light from the disc is revealed in full, this conservative error estimate must be sufficient.
We also find that the secondary contributes 44±7 per cent of the light near 5500 ˚A. As this means that the disc contributes a significant fraction of the light, especially in emission line regions, it becomes important to assess the variability of the disc, particularly if the inclination is to be determined by lightcurve modelling. As noted, it is common to assume that the disc is a constant source of light. While it may be valid whenf is large, three observational points cast doubt on this assumption:
(i) S04 performed a detailed study of flares from A0620-00, which in their observations have amplitudes nearing 20 per cent of the source flux.
(ii) Measurements of the fractionfof light contributed by the secondary have not been consistent. MR86 found 40±10 per cent at 5100 ˚A, MRW94 found 94±3 per cent at Hα, and Gelino et al. (2001) foundf&97 per cent inJ, H,and K, assuming aconstant diluting source of light.
(iii) Observations in all four Spitzer bands, taken approx-imately two weeks before our observations on the Clay tele-scope, show strong flickering which is highly correlated with simultaneous R-band lightcurves from the 1.2m telescope on Mt. Hopkins.
While McClintock, Horne, and Remillard (1995) rightly point out that the absorption line strength of the template will affect the observed dilution fraction, unless it can be shown that the measured fraction is strongly correlated with template line strength, a physical origin for this variation cannot be ruled out. Future studies could assess the true dependence off on template star, as well as the long-term variability off, by observing both BS 753 (MWR94’s tem-plate) and HD 7142. Our measurements of the Hαequivalent widths, when compared to those of MRW94, suggest a physi-cally real origin for the variation, because equivalent widths are independent of the template star and the instrument. So there appears to be evidence for a disc which is brighter relative to the secondary than it used to be.
ferent radial emissivity dependencies, which could result in slower modulations. We also detect several bright regions in the disc: one near the gas stream impact point, and two crescent-shaped regions on opposite sides of the disc. The reality of these features, as well as the non-uniform flick-ering, are confirmed by modulation tomography of the Hα disc line, which reveals variation near the bright crescents.
First noticed by S04, the crescent-like features may in-dicate an eccentric disc, which is predicted for systems like A0620-00 with small mass ratios and large discs. It seems that we have observed an eccentric disc, but let us consider the evidence. From our observations, the following are clear:
(i) The disc is bright and variable. The brightness is ev-ident in the increased dilution of the secondary spectrum, and the variability is clear from a number of phenomena. First, the trailed Hαline shows clear evidence of flickering events. Second, the subtracted equivalent width of the same line is variable beyond explanation by noise alone. Third, the phase-resolved light fraction cannot be reproduced by ellipsoidal variability on top of a constant source of light.
(ii) The disc extends to the 3:1 tidal resonance. This is a simple point, clear from the Doppler and modulation maps. (iii) The disc is not centered on the radial velocity of the black hole.
(iv) The disc is not radially symmetric, but characterized by bright crescent-shaped regions.
(v) The crescent regions are modulated at the orbital pe-riod.
Each of these points alone would be insufficient evidence to conclude that the accretion disc is eccentric and precess-ing. But with the exception of a direct image of the ellipti-cal disc, we can present a complete and coherent argument that this is the case. The disc has grown to tidal resonance, where the enhanced disc viscosity results in bright and vari-able rims of extra dissipation. We then observe crescents of extra dissipation at relatively low velocities, as expected. Given the viscous effects, it is predicted that the disc will receive a gravitational torque from the secondary, and begin to precess. The asymmetries introduced here shift the ve-locity center of disc emission away from the black hole, and we find that the disc is not centered on the black hole in velocity space. Furthermore, given the beat period between the precession and orbital motion, the regions of viscous dis-sipation should be modulated at roughly the orbital period. Modulation tomography reveals this to be the case.
In retrospect, knowing that portions of the disc are modulated on the orbital period, we look closer at the frac-tion of light contributed by the secondary star, and see that it is not well fit by ellipsoidal modulations for a system at the inclination of A0620. But if another component of the system was variable on the orbital period, as we have ob-served the disc to be, then there is no need for concern. The physical picture, a precessing elliptical disc torqued by the secondary star, predicts and produces all the phenomena we have discussed in our data, which are of high quality.
To put it another way, the eccentric disc hypothesis is nicely self-consistent. It explains why and how the accretion disc has changed, allows the disc to be large enough for the growth of eccentric modes, and predicts the phenomena that we observe. It is unfortunately not possible at this point to make an estimate of the disc eccentricity. Smith et al.
(2007) have shed a great deal of light on the evolution of disc eccentricity and energy dissipation with 3D SPH sim-ulations. They find that systems with q between 0.08 and 0.24 develop low-mass eccentric discs withsuperhumps; for q = 0.0526, the disc exhibits a short-lived superhump and decaying eccentricity. All mass ratios show enhanced dissi-pation in the disc from the thermal-tidal instability, even without the eccentric modes.
Since we have not observed a superhump, we cannot place A0620-00 in either category. If it falls in the more extreme group, the disc eccentricity is likely zero (reached after about 300 orbital periods) (Smith et al. 2007). In that case, the steady state is a massive disc. If the steady state is very long-lived, and the disc continues to grow, this could explain the enormous intensity of novae like A0620-00. If it fits among the less extreme mass ratios, the disc eccentric-ity is around 0.1–0.2, and a superhump should be observable with better photometry and a longer baseline (Smith et al. 2007). A0620-00 may also be at a transition between those cases, and its evolution might be somewhat more erratic, as suggested by the SMARTS data discussed earlier. For example, it may toggle between states of quiescence, super-humps, and variability (like what we have observed here). It might, then, be erroneous to interpret this recent increase in brightness as the build towards outburst.
While we have strong evidence that the accretion disc around the black hole has grown out to the tidal distortion radius, evolved into an eccentric disc, and started to precess, further study is required to verify our conclusion. Data from SMARTS, FLWO, and Spitzer will further quantify flicker-ing, and may reveal a superhump, or some new period con-sistent with our results, and future programs of tomography will track the evolution of the accretion disc. In anticipa-tion of the impending outburst, and in light of progress in simulations, we suggest that this well-studied system not be disregarded or ignored, for it affords us the opportunity to watch the evolution of an accretion disc from quiescence to outburst, and the chance to test models for disc instabilities in X-ray novae.
ACKNOWLEDGEMENTS
This research was supported by the NSF grant AST-0507637, the Harvard University Graduate School of Arts and Sciences (JN), and a SAO Clay Fellowship (DS). We wish to thank Cara Rakowski for help with the observations, Tom Marsh for use of his software packages, Jack Steiner for many useful discussions, and the reviewer for a number of constructive comments which improved the quality of the paper.
REFERENCES
Elvis M., Griffiths C.G., Turner M.J.L., Page C., 1975, IAU Circ, 2184
Frank J., King A., Raine D., 2002, Accretion Power in As-trophysics. Cambridge University Press, Cambridge, UK Foulkes S.B., Haswell C.A., Murray J.R., Rolfe D.J., 2004,
MNRAS, 349, 1179
Froning C.S., Robinson E.L., 2001, AJ, 121, 2212
Froning C.S., Robinson E.L., Bitner M.A., 2007, ApJ, in press
Gelino D.M., Harrison T.E., Orosz J.A., 2001, AJ, 122, 2668
Johnston H.M., Kulkarni S.R., Oke J.B., 1989, ApJ, 345, 492
Leibowitz E.M., Hemar S., Orio M., 1998, MNRAS, 300, 463L
Malaroda S., Levato H., Galliani S., 2001, VizieR On-line Data Catalog: III/216.
Marsh T.R., 2001, in Boffin H.M.J., Steeghs D., Cuypers J., eds, LNP Vol. 573, Astrotomography: Indirect Imaging Methods in Observational Astronomy. Springer-Verlag, Berlin, p. 1
Marsh T.R., Horne K., Schlegel E.M., Honeycutt R.K., Kaitchuck R.H. 1990, ApJ, 364, 637
Marsh T.R., Robinson E.L., Wood J.H., 1994, MNRAS, 266, 137 (MRW94)
McClintock J.E., Remillard R.A., 1986, ApJ, 308, 110 (MR86)
McClintock J.E., Horne K., Remillard R.A., 1995, ApJ, 442, 358
Paczynski B., 1971, ARA&A, 9, 183
Shahbaz T., Naylor T., Charles P.A., 1994, MNRAS, 268, 756
Shahbaz T., Bandyopadhyay R.M., Charles P.A., 1999, A&A, 346, 82
Shahbaz T., Hynes R.I., Charles P.A., Zurita C., Casares J., Haswell C.A., Araujo-Betancor S., Powell C., 2004, MNRAS, 354, 31 (S04)
Smith A.J., Haswell C.A., Murray J.R., Truss M.R., Foulkes S.B., 2007, MNRAS, 378, 785
Steeghs D., 2003, MNRAS, 344, 448 Steeghs D., Casares J., 2002, ApJ, 568, 273 Sterne T.E., 1941, PNAS, 27, 168