186 |
P a g e
PLANKTON DIVERSITY AND WATER QUALITY
ASSESSMENT OF TWO LAKES IN VELLORE
DISTRICT (TAMIL NADU, INDIA) WITH SPECIAL
REFERENCE TO PLANKTONIC INDICATORS
Shivani Shirke
1, Snehal Phand
2, Kruthika D L
3, Sesha Sai
4, Ch.
Venkatesh
Reddy
5, M. Chaithanya Sudha
61,2,3,4,5
M.Tech Energy and Environmental Engineering, Environment Division, School of Mechanical
and Building Sciences, VIT University, Vellore (India)
6
Assistant Professor, Environment Division, School of Mechanical and Building Sciences, VIT
University, Vellore (India)
ABSTRACT
The present study focuses on the limn biotic condition of two lakes of Vellore district using the physicochemical
and biological parameters, with due consideration to the planktonic species. The study was carried out during
the monsoon season for a period of five months from July to November 2013. The pollution levels of the lakes
were determined with the help of Palmer’s indices and were further supported by physicochemical parameters.
The plankton assessment (qualitative) was associated with the physicochemical parameters like pH, COD,
BOD, TDS, EC, alkalinity, TH, turbidity, calcium, magnesium, chlorides, DO, phosphates, nitrates and nitrites.
The Arakkonam Lake has low levels of dissolved oxygen (3.55 mg/L) and higher fluctuations of alkalinity
(218.18 mg/L), total hardness (300.91 ppm) and phosphates (7.264 mg/L) and showed a palmer pollution index
value of 26, which may be mainly due to the increased population growth in the surroundings and resulting rise
in the quantities of sewage disposal. Kavanoor Lake showed high levels of dissolved oxygen (3.59 mg/L) and
lower alkalinity (117.14 mg/L), total hardness (186.43 ppm) and phosphates (6.623 mg/L) when compared with
Arakkonam Lake. This may be due to the lesser anthropogenic influence and less urbanization impact of the
area encompassing the lake.
Keywords: - Arakkonam
Lake, Biological
Parameters, Kavanoor Lake, Physicochemical,
Pollution, Water Quality
I. INTRODUCTION
Freshwater ecosystems are considered as one of the most essential natural resources for all the living organisms
on the earth. The various freshwater ecosystems include, rivers, lakes, ponds, bogs, and wetlands etc. Among
these, lakes are found to be a part of ancient Indian tradition of storing local rainfall for later uses. They also
play an important role in ground water recharge, irrigation and domestic activities, prevention of flood, source
187 |
P a g e
systems depends upon the nature of the lake and also various environmental and anthropogenic factors
influencing it. In today’s time, the exponential growth of population, with the consequent rise of sewage
quantities has posed a big problem for its disposal. This has consequently led to the increase in pollution levels
of the water bodies, resulting in eutrophication of the lakes (Choudhary et al. 2010; Ravi Kumar et al. 2013). In
India, lakes are experiencing varying degrees of environmental degradation due to the haphazard urbanization
and expansion of the towns and cities. The lakes under the present study are more vulnerable to the development
process and increase in the human settlements around the lakes. It has deteriorated the health of these lakes
owing to the discharge of untreated sewage waters from the nearby settlements into them. Hence assessment of
water quality is very essential to control surface water pollution (Shuchun et al. 2010). Many studies have
reavealed that, phytoplankton and zooplankton can be used as indicators of water pollution (Kudari and
Kanamadi, 2008, Shanthala . et. al. 2008). When an aquatic system is considered, the planktons prove to be of
great importance as the changes in the environment can potray an instantaneous response of the planktons
(Thakur et. al 2013 and Malik et. al 2013). The plankton growth rate and development depends on various
biotic as well as abiotic factors like, light, temperature, available nutrients, hydronamics, predation, oxygen
concentration, pH etc (Dhar et. al 2012). The phytoplanktons form the basic trophic level and are succeeded by
the zooplanktons as the next level (Shanthala et. al 2008 and Malik et. al 2013). The population of zooplankton
is affected by physicochemical charachteristics of the water body, and it also changes according to the variation
in the seasons (Hulyal and Kaliwal 2007 and Kudari and Kanamadi 2007). The analysis of such indicator
organsims, both qualitative and quantitative, have resulted in an aiding option to integrate the effects of a
number of pollutants, unlike the physicochemical processes which have led to the identification of one pollutant
at a time. Further, the indices and other systems have been utilized to determine the current status of different
water bodies. The process of biomonitoring has become an essential part of water pollution studies and
contributes immensely towards the research in the filed of water quality assessment (Mahadev et. al. 2007). The
lakes under the present study are more vulnerable to the development process and increase in the human
settlements around the lakes. It has deteriorated the health of these lakes owing to the continuous discharge of
untreated sewage waters from the nearby settlements into them. Hence, the assessment of water quality in these
lakes has become very crucial to control the pollution of its water. The present study has been carried out to
evaluate the water quality of two lakes Kavanoor lake and Arakkonam lake, in Vellore district of Tamil Nadu,
India, by assessing physicochemical and biological parameters.
II. STUDY AREA
The current study deals with the assessment of water quality in two lakes (Fig 1) of Vellore district, namely,
Arakkonam and Kavanoor. The region has a semi-arid climate with high temperatures (average maximum: 39.5
degree Celsius and average minimum: 15.6 degree Celsius) throughout the year and relatively low rainfall. The
bulk rainfall is received during the months of October and November from the northeast monsoons. It
experiences an average annual rainfall of 795mm, out of which North East monsoon contributes to 535mm and
the south west monsoon contributes to 442mm. the following is a brief description of the two lakes that have
188 |
P a g e
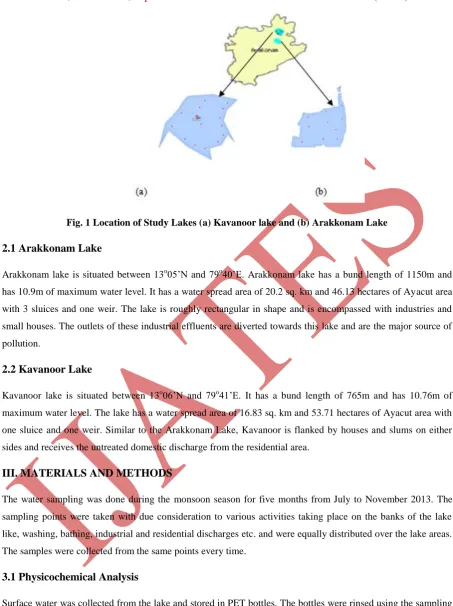
Fig. 1 Location of Study Lakes (a) Kavanoor lake and (b) Arakkonam Lake
2.1 Arakkonam Lake
Arakkonam lake is situated between 13o05’N and 79o40’E. Arakkonam lake has a bund length of 1150m and has 10.9m of maximum water level. It has a water spread area of 20.2 sq. km and 46.13 hectares of Ayacut area
with 3 sluices and one weir. The lake is roughly rectangular in shape and is encompassed with industries and
small houses. The outlets of these industrial effluents are diverted towards this lake and are the major source of
pollution.
2.2 Kavanoor Lake
Kavanoor lake is situated between 13o06’N and 79o41’E. It has a bund length of 765m and has 10.76m of maximum water level. The lake has a water spread area of 16.83 sq. km and 53.71 hectares of Ayacut area with
one sluice and one weir. Similar to the Arakkonam Lake, Kavanoor is flanked by houses and slums on either
sides and receives the untreated domestic discharge from the residential area.
III. MATERIALS AND METHODS
The water sampling was done during the monsoon season for five months from July to November 2013. The
sampling points were taken with due consideration to various activities taking place on the banks of the lake
like, washing, bathing, industrial and residential discharges etc. and were equally distributed over the lake areas.
The samples were collected from the same points every time.
3.1 Physicochemical Analysis
Surface water was collected from the lake and stored in PET bottles. The bottles were rinsed using the sampling
water and the water was collected with minimal disturbances in and around the collection points. The bottles
were filled with due care so as to avoid any bubbles to be entrapped and hamper the DO or BOD levels of the
water. The collected samples were then labeled and transferred to the Environmental laboratory, VIT University,
Vellore, for further analysis. Standard methods given by APHA were utilized to analyze the samples (APHA).
189 |
P a g e
conductivity (EC), Total dissolved solids (TDS), Turbidity, Alkalinity (ALK), Total Hardness (TH), Dissolved
Oxygen (DO), Calcium (Ca), Magnesium (Mg), Chlorides (Cl), Nitrates (NO3), Nitrites (NO2) and Phosphates
(PO4), Biochemical Oxygen demand (BOD) and Chemical Oxygen demand (COD).
3.2 Biological Analysis
Plankton nets made out of blotting silk with a wide mouthed bottle were utilized to collect the planktons. The
55 µm and 150 µm nets were used for the collection of samples. With a slow and steady horizontal motion the
nets were taken to a depth of aprroximately 0.5 m below the surface of the water in the lakes. The sieved water
was then collected in PET bottles of 250 ml capacity. These bottles were washed with sample water prior to
sample collection. These bottles were then transferred to the Microbiology laboratory, VIT University, Vellore
for further analysis. Within 24 hours, 5 ml of 4% formalin solution was added in every bottle of 250 ml sample.
The fixed samples were then stored at room temperature until further analysis. From each sample approximately
5 ml was taken and observed under an electronic microscope under varying magnifications of 10x, 40x and
100x. Following this qualitative analysis of the planktons, the Palmer indices were assigned to the genus that
was found in the lakes and pollution levels were determined.
3.3 Data Analysis
Descriptive Statistic was performed for physic chemical parameters verses lakes and correlation analysis was
carried out to interpret the relationship between the parameters by using SPSS version 10.0 (Sudha and Ravi
chandran 2013).
IV. RESULTS AND DISCUSSION
4.1 Physicochemical parameters
The average values of water quality parameters in the study lakes were shown in Table 1 and 2. Biological
Oxygen Demand (BOD5) is the amount of oxygen required for the organisms to oxidize all the organic matter
and indirectly implies the oxygen required for the respiration of microbes. The BOD levels are usually
calculated and utilized for pollution level determination. The current study shows that the BOD values for
Kavanoor and Arakkonam were 21.70 6.19 (12.57 - 35.67) and 24.21 8.89 (14.65 - 40.23) respectively in
milligrams per liter. The higher BOD values imply high amounts of decomposition of organic matter in the
water bodies (Sanap et. al. 2006). The BOD5 shows an inverse relation with the values of DO owing to the
consumption of dissolved oxygen for the process of decomposition (Mohan and Omana, 2007; Jindal and
Sharma, 2011).
During the study, the DO levels were 3.14 0.72 at Kavanoor and 3.44 1.00 in Arakkonam Lake. The
maximum value observed was 4.82 while the minimum value obtained was 1.54. The gradual reduction of
dissolved oxygen levels implies deteriorating quality of the lake waters and its increasing unsuitability for
190 |
P a g e
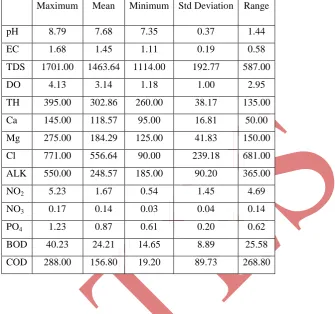
Table 1: Mean Values and Standard Deviation of Water Quality Parameters of Arakkonam Lake
Maximum Mean Minimum Std Deviation Range
pH 8.79 7.68 7.35 0.37 1.44
EC 1.68 1.45 1.11 0.19 0.58
TDS 1701.00 1463.64 1114.00 192.77 587.00
DO 4.13 3.14 1.18 1.00 2.95
TH 395.00 302.86 260.00 38.17 135.00
Ca 145.00 118.57 95.00 16.81 50.00
Mg 275.00 184.29 125.00 41.83 150.00
Cl 771.00 556.64 90.00 239.18 681.00
ALK 550.00 248.57 185.00 90.20 365.00
NO2 5.23 1.67 0.54 1.45 4.69
NO3 0.17 0.14 0.03 0.04 0.14
PO4 1.23 0.87 0.61 0.20 0.62
BOD 40.23 24.21 14.65 8.89 25.58
COD 288.00 156.80 19.20 89.73 268.80
Table 2: Mean Values and Standard Deviation of Water Quality Parameters of Kavanoor Lake
Maximum Mean Minimum Std Deviation Range
pH 9.60 7.50 6.16 0.74 3.44
EC 1.45 0.95 0.73 0.16 0.71
TDS 1460.00 959.89 741.70 158.47 718.30
DO 4.82 3.44 1.97 0.72 2.85
TH 335.00 203.33 100.00 56.78 235.00
Ca 150.00 83.33 40.00 24.85 110.00
Mg 210.00 120.00 30.00 48.96 180.00
Cl 654.00 358.44 40.00 162.51 614.00
ALK 420.00 168.89 90.00 104.87 330.00
NO2 0.74 0.11 0.02 0.18 0.72
NO3 0.17 0.15 0.08 0.03 0.10
PO4 5.74 0.87 0.35 1.23 5.40
BOD 35.67 21.70 12.57 6.19 23.10
191 |
P a g e
The nitrates found in Kavanoor and Arakkonam (mg/l) are 1.43 2.95 (0.12 10.10) and 20.06 2.15 (16.90
-24.30) respectively. The high amounts of nitrates and phosphates in the water bodies indicate higher levels of
eutrophication in both the lakes (Thakur et. al. 2013). These nitrates and phosphates prove to be the key to
excessive algal blooms in the water bodies, thus increasing the pollution levels. The major source of phosphates
is traced back to detergents and soaps used for household cleaning, while the nitrates are found as a result of
discharge of untreated domestic sewage water (Sylvester, 1961). The algal blooms can be observed at values
starting from 0.03 mg/l of phosphates in the water (Sheela et. al. 2011). The greenish blue waters observed by
the plain eye during sample collection also support the interpretation of excessive algal growth in these fresh
water lakes.
Throughout the investigation it was observed that the lakes showed very high amounts of TDS and alkalinity.
The reason behind this can be attributed to human influences and disturbances (Sharma et.al, 2010). The values
obtained for Kavanoor and Arakkonam lakes for TDS were 959.89 158.47 (741.70 - 1460.00) and
1463.64 192.77 (1114.00 - 1701.00) respectively. The values of alkalinity were also high and hence indicated
pollution in the lakes (Das et. al. 2009).
Chlorides content of the water was extremely high with a maximum of 771.00 mg/l in Arakkonam Lake. Such
high amounts of chlorides in the water are a confirmation of presence of eutrophication of the water body
(Verma et. al. 2011). Owing to the heavy domestic sewage discharges in the lakes, the chloride values are
tremendously on the higher side. Also, it might be the reasons behind the odorous conditions that prevail along
the perimeter of these two lakes.
4.2 Biological Parameters
The results showed that the different species of phytoplankton and zooplankton indicate different trophic status
of the lakes or water bodies that they are present in. The presence of planktons indicates the pollution status of
water bodies and is a reliable tool for assessment of fresh water bodies. In accordance with Palmer and his
indices, index number >20 indicates the presence of organic pollution, index number between 15 and 19
indicates probability of presence of organic pollution, index number <10 shows that water body is not polluted.
It can be clearly seen that, the pollution index that was observed in Arakkonam is 26 (Table 3), which indicates
that the lake has high levels of organic pollutants in it. On the other hand, the Kavanoor lake shows an index of
19, which indicates there is a probability of organic pollution in this lake.
4.2.1 Phytoplankton
Phytoplankton species observed in each lake, out of the total planktons found, 29 groups (genera) were
phytoplanktons, where as, 14 groups (genera) were zooplanktons. Amongst the genera found, Volvox,
Oscillatoria, spirogyra, Lyngbya, Cosmarium, Anabaena, and Cyclotella were observed to be abundant in the
phytoplankton group. The observation of these species of Euglena, Oscillatoria chalybea, Nitzschia, Phacus
longicauda etc indicates that the lakes have been organically polluted (S. S. Vutukuru et. al 2012). The bluish
green algae mainly consisted of Oscillatoria and Anabaena; while the diatoms consisted of Nitzschia, Navicula,
192 |
P a g e
green algae found in the lakes (S. N. Panigrahi et. al 2001). In the present study, the dominance of Oscillatoria,
Navicula, and Euglena signified the presence of pollutants of biological origin.
Table 3 Palmer Index Values and Index Score For the Study Lakes
Genus Arakkonam Kavanoor
Anabena - 1
Chlorella 3 -
Closterium - 1
Cyclotella 1 1
Euglena 5 5
Flagilaria - 1
Navicula 3 3
Nitzschia 3 -
Oscillatoria 3 3
Phacus 2 2
Scenedesmus 4 -
26 19
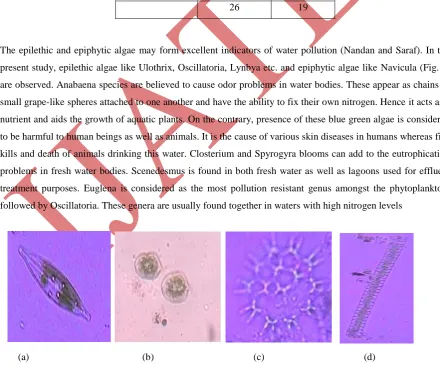
The epilethic and epiphytic algae may form excellent indicators of water pollution (Nandan and Saraf). In the
present study, epilethic algae like Ulothrix, Oscillatoria, Lynbya etc. and epiphytic algae like Navicula (Fig. 2)
are observed. Anabaena species are believed to cause odor problems in water bodies. These appear as chains of
small grape-like spheres attached to one another and have the ability to fix their own nitrogen. Hence it acts as a
nutrient and aids the growth of aquatic plants. On the contrary, presence of these blue green algae is considered
to be harmful to human beings as well as animals. It is the cause of various skin diseases in humans whereas fish
kills and death of animals drinking this water. Closterium and Spyrogyra blooms can add to the eutrophication
problems in fresh water bodies. Scenedesmus is found in both fresh water as well as lagoons used for effluent
treatment purposes. Euglena is considered as the most pollution resistant genus amongst the phytoplankton,
followed by Oscillatoria. These genera are usually found together in waters with high nitrogen levels
(a) (b) (c) (d)
Fig.2 Pollutant Tolerant Algal Taxa Identified In the Study Lakes (A) Navicula (B) Phacus (C)
193 |
P a g e
V. CONCLUSION
The Arakkonam Lake has low dissolved oxygen (3.14 mg/L) and higher fluctuations of alkalinity (248.57mg/L),
total hardness (302.86ppm) and phosphate (1.68mg/L), which may be mainly due to the increased population
growth in the surroundings, encroachments in and around the lake, leading to pollution of the lake through
discharge of untreated domestic sewage and municipal waste water. The inlet of sewage might increase the
nutrient levels considerably in the lake. Kavanoor Lake shows high dissolved oxygen (3.44mg/L) and lower
alkalinity (168.89mg/L), total hardness (203.33ppm) and phosphates (0.97mg/L) when compared with
Arakkonam Lake, this may be due to less anthropogenic influence and low urbanization of the area around it.
The presence of pollution indicating genera in both the lakes like Navicula, Phacus, Oscillatoria, Anabaena,
Euglena, Rotifera, Cyclops, etc. signifies the degraded quality of the lakes at present. The phytoplankton genera
found in Arakkonam was 12 whereas those found in Kavanoor was 12. According to Palmer, the pollution index
of more than 20 indicates a high level of organic pollution, those from 15 to 19 indicate a probability of organic
pollution while that below 15 low levels of organic contents in the water body. Arakkonam Lake has high levels
of organic pollution as it shows a pollution index of 26 as compared to 19 shown by Kavanoor Lake.
REFERENCES
[1] Banana Mandal, Arunava Mukherjee (2011) Diversity and Diel Variation of Zooplankton in Two Ponds at
Barrackpore, West Bengal. Proc Zool Soc. (July-Dec 2011) 64(2):132-136 DOI:
10.1007/s12595-011-0019-7
[2] C. Chattopadhyay (2013) Polyphenolics and Energy Content in Phytoplankton: Evidence from a
Freshwater Lake. Choudhary P, Routh J, Chakrapani GJ (2010) Organic geochemical record of increased
productivity in Lake Naukuchiyatal, Kumaun Himalayas, India Environ Earth Sci. 60:837–843. DOI:
10.1007/ s12665-009-0221-3
[3] Cude, C. G. (2001) Oregon water quality index: A tool for evaluating water quality management
effectivenes. Journal of American Water Resources Association, 37(1), 125–137.
[4] Debels, P., Figueroa, R., Urrutla, R., Barra, R., & Niell, X. (2005) Evaluation of water quality in the
Chillan River (Central Chile) using physicochemical parameters and modified water quality index
Environmental Monitoring and Assessment, 110, 301–322.
[5] Dojlido, J., Raniszewski, J., & Woyciechowska, J. (1994) Water quality index applied to rivers in the
Vistila River Basin in Poland Environmental Monitoring and Assessment, 33, 33 –42.
[6] Ismail Md. Mofizur Rahman, M,. Monirul Islam, M., Mosharraf Hossain, M. Shahadat Hossain, Zinnat A.
Begum, Didarul A. Chowdhury, Milan K. Chakraborty, M. Azizur Rahman, M. Nazimuddin, Hiroshi
Hasegawa (2010) Stagnant surface water bodies (SSWBs) as an alternative water resource for the
Chittagong metropolitan area of Bangladesh: physicochemical characterization in terms of water quality
indices, 173,669–68.
[7] Joydip Dhar, Randhir Singh Baghel, Anuj Kumar Sharma (2012). Role of instant nutrient replenishment
on plankton dynamics with diffusion in a closed system: A pattern formation Applied Mathematics and
194 |
P a g e
[8] Jonnalagadda, S. B., & Mhere, G. (2001) Water quality of the Odzi River in the eastern highlands of
Zimbabwe. Water Research, 35, 2371–2376
[9] M. Chaithanya Sudha, S. Ravichandran, R. Sakthivadivel (2013) Water Bodies Protection Index for
assessing the sustainability status of lakes under the influence of urbanization: a case study of south
Chennai, India Environ Dev Sustain
[10] Neetu Malik, A. K. Biswas, C. B. Raju (2013) Plankton as an Indicator of Heavy Metal Pollution in a
Freshwater Reservoir of Madhya Pradesh, India Bull Environ ContamToxicol (2013)90:725-729
[11] Pandit AK (2002) Topical evolution of lakes in Kashmir Himalaya. In: Pandit AK (ed) Natural resources
of western Himalaya Valley Book House, Srinagar J&K, 213–242
[12] Pandit AK, Yousuf AR (2002) Trophic status of Kashmir Himalayan lakes as depicted by water chemistry
J Res Dev 2:1–12
[13] Prakash Raj Kannel, Seockheon Lee, Young-Soo Lee, Sushil Raj Kanel, Siddhi Pratap Khan. (2007)
Application of Water Quality Indices and Dissolved Oxygen as Indicators for River Water Classification
and Urban Impact Assessment, 132, 93–110.
[14] R. K. Thakur, R. Jindal, UdayBhan Singh, A. S. Ahuwalia (2013) Plankton diversity and water quality
assessment of three freshwater lakes of Mandi (Himachal Pradesh, India) with special reference to
planktonic indicators Environmental monitoring Assessment (2013) 185:8355-8373
[15] Raveen R, Daniel M (2010) Spatial changes in water quality of urban lakes in Chennai (India)—a case
study J Environ Sci Eng 52(3):259–264
[16] Ravikumar P, Venkatesharaju K, Prakash KL, Somashekar RK (2011) Geochemistry of groundwater and
groundwater prospects evaluation, Anekal Taluk, Bangalore Urban District, Karnataka, India Environ
Monit Assess 179:93–112.
[17] Hulyal S.B., , B. B. Kaliwal (2007) Water quality assessment of Alamatti Reservoir of Bijapur (Karnataka
State, India) with special reference to zooplankton Environmental monitoring Assessment (2008)
139:299-306
[18] S. N. Panigrahi, B. B, Nayak, B. C. Acharya (2001) Plankton algae as water pollution index of Maipura
Esturai, East Coast of India J. mar. boil. Ass. India 43 (1 and 2)
[19] S. S. Vutukuru, S. S. Asadi, B. V. T. VasanthaRao, M. V. Raju (2012) Plankton biodiversity as indicators
of the ecological status of river Moosi, Hyderabad, India International journal of earth sciences and
engineering, vol. 5 no.3
[20] Shuchun Y, Bin X, Deyang K (2010) Chronology and nutrients change in recent sediment of Taihu Lake,
lower Changjiang River Basin, East China Chin Geogr Sci 20(3):202–208
[21] Vijaykumar A. Kudari, Ravishankar D. Kanamadi (2007) Impact of changed trophic status on the
zooplankton composition in six water bodies of Dharwad district, Karnataka state (South India)
Environmental monitoring Assessment (2008) 144:301-313
[22] Yu FC, Fang GH, Ru XW (2010) Eutrophication, health risk assessment and spatial analysis of water
quality in Gucheng Lake, China Environ Earth Sci 59:1741–1748.