6700
Exploring Energy Saving Strategy Using EDGE
Towards Of Green Building
Refinda Rahmadhani , Senot Sangadji ,S.A. Kristiawan
Abstract: Green Building is one of the concepts that emerged in supporting low carbon development through policies and programs to improve energy efficiency, water and building materials and increase the use of low carbon technology. The Green Building concept is one of the energy saving efforts that can be applied to a building. In an effort to increase energy savings in buildings, EDGE (Excellence Insign For Greater Efficiencies) is one of the technologies that can be used in saving energy. EDGE is a complementary element to the Greenship certification issued by GBCI which is oriented towards efficient resource saving for housing and commercial buildings. EDGE software was used to perfom the detailed energy simulations. The purpose of this ongoing research is to determine energy use, discuses the energy saving measures and simulation them in a building. Simulation and selection of energy saving scenarios are presented in this study. Evaluation on how efficient the selection of scenarios for energy saving is also described. Eventually, this study will also exhibit s the benefits, limitations and conclusions of the EDGE simulation results in energy savings.
Index Terms: strategy, energy saving, green building, EDGE, energy, water, material
————————————————————
1
INTRODUCTION
Green Building is existing concept to support development of low carbon that is through policy and program of efficiency improvement of energy, water, and building material and the improvement of using low carbon technology use. The implementation of Green Building not only gives ecologically benefits, but also economic one, by decreaing the operational cost and building maintenance. Environment-keeping buiding (green building) in accordance with regulation of Life Environment Minister Number 8 of 2010 about criteria and certification of Environment-keeping building, is a building that implements environment principle in planning, building, establishing, operating, and management as well as other important aspect to manage climate change impact. EDGE (Excellence In Design For Greater Efficiencies) is a certification for green building to market of the developing countries developed by IFC (International Finance Corporation), a division of World Bank which cooperates to Green Building Council Indonesia (GBC Indonesia) to prompt the growth of building establishment using efficient resources. EDGE is a complement for certification of Green ship issued by GBCI concering on the use resources efficiently for housing and commercial building. The efficient use are on the energy, water, and material resources on building (Akhmad, dkk., 2018: 73). Office building is the one having high dependence on the electrical energy to fulfill the operational needs. One of the office building used as public service center in Semarang is village district office of Sendang Mulyo Kota Semarang. To provide excellent service is an obligation for the officers of the building to facilitate public comfort using the building. The energy consumption, therefore, in operational implementation needs to attend. The recent study explores the use of efficient energy consumption applied in existing office building.
As the development of technology, the efficient use of energy can be implemented in office building. This study uses EDGE BUILDING software containing parameters to be alternatives of energy efficiency.
2
LITERARY
STUDY
2.1 Green building
a. The Notion of Green building
Green Building Council Indonesia/GBCI (2010) states that green building is a building which is from the planning, establishing, operating to operational maintenance show the aspect in protecting, saving, and reducing natural resources, keeping air quality in romms, and attending the people inside based on the rule of continuous building.
b. Concept and Basic Theory of Green Building
National Construction Service Development Association (Lembaga Pengembangan Jasa Konstruksi Nasional) (2007, in Ervianto, 2012: 33) mentions that Indonesia is a developing country and is establishing, has had blueprint for construction sector as grand design and grand strategy stated as Indonesia Construction 2030. The document states that Indonesia Construction must concern not to support the environment damage but the pioneer for repairing and improving environment quality in the entire habitant in Indonesia, settled by human and other creatures having mutualism symbiosis.
2.2 Simulation of Excellence In Design For Greater Efficiences (EDGE)
Energy simulation in this study is performed by using web-based simulation software that is EDGE (The excellent in design to the bigger efficiency) provided by IFC from World Bank group. This software is free for everyone creating user account of site: https://app.edgebuildings.com. The software provides measured way to reduce new material resource intensity, enforce the interest doer to determine the most effective-cost option for designing the efficient building resources. There are three features of main measurement for software: energy, water and material measurement. The software counts the saving utility and decrease the carbon trace on the basic case. The opportunity of saving energy is known by absorbing as much as information in the software and choosing the system and solution.
__________________________
• Author name is currently pursuing masters degree program in Infrastructure Maintenance and Rehabiitation Management, Civil Engineering Departement, Facuty of Engineering, Sebelas Maret
University, Surakarta, Indonesia. E-mail:
Co-Author name is currently teaching masters degree
6701
3
METHOD
3.1 Building Information
This study uses qualitative method by descriptive approach conducted in office building of village district of Sendang Mulyo Kota Semarang. To get data about criteria of green building based on certification system of EDGE (Excellence In Design for Greater Efficiencies). Data of energy consumption are collected and counted to get Energy Consumption Intensity score on initial counting. The existing building simulation is conducted to get score of energy saving. Then, comparative analysis is done for any scenario by considering the parameter used.
Building Information
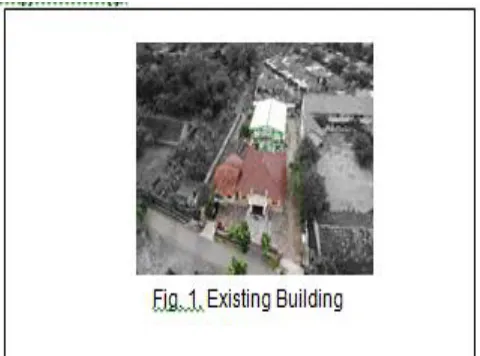
The main building used in this study is the service office or Hall of village district Sendang Mulyo. The office is situated at Jalan Raya Klipang no. 1, Kecamatan Tembalang, Semarang. The office building consists of waiting room, service room, district staff room, village chief room, 2 bathrooms and mosque by total building width is 347.28 m2. The office serves 255 RT and 29 RW. Next, the picture below is named figure 1. Existing Building.
3.2 IKE Calculation
To know the number of energy needs, it is conducted initial calculation. It is conducted to know whether the operational energy needs and facility included in efficient category. The data of monthly energy consumption needs the following.
3.3 Program of Simulation
EDGE software is used to simulate the use of energy, water and material. The EDGE software counts the utility saving and reduce the carbon trace of your green building toward casing. Your dashboard shows how much additional cost to build green and how short time needed to get back the money of operational saving.
3.4 Simulation Process
The following steps are in the simulation process:
Choose the building type used in research, in this case is the existing building included in official building type.
Enter data of building design going to use in the
calculation as presented in Table 1 below.
TABLE 1
Assumption of parameter score for building simulation
Parameter Nilai Asumsi
Cost of Electricity 1.467 Rp/kWh
Cost Of Water
Window to Wall Ratio 60% Solar Reflevtivity for Paint-Wall 30% Solar Reflevtivity for Paint - Roof 30%
Roof U-Value 1.28 W/m². K
Wall U-Value 2.80 W/m². K
Glass U-Value 5.80 W/m². K
Glass SHGC 0.60
Cooling System ASHRAE 90.1.2007 AC System Efficiency 2.66 COP
Heating System ASHRAE 90.1.2007 Heating System Efficiency 0.8 COP
Do existing building simulation on the three parameter which are the use of energy, water and material. Analyze the existing building simulation
3.5 Scenario
To get chance of maximal energy saving, it is done simulation scenario on the parameter of energy and water needs. There is no material needs simulation due to the building included in this study is post-construction building, in which the material selection replacement is very difficult and impossible to redone. 3 scenarios are simulated on energy needs and 2 scenarios are simulated on the water needs. The energy simulation are :
Scenario 1 : adding media reflector and shading 0FE04
Scenario 2 : changing color paint 0FE03 Scenario 3 : adding fan and ceiling 0FE10 Scenario 4 : using Solar PV (Photovoltaic) in the afternoon 0FE30
Water needs
Scenario 5 : adding urinary 0FW03
Scenario 6 : using rainwater harvesting system the existing building 0FW06
Energy and water needs
Scenario 7 : adding media reflector and shading, replacing paint color, adding fan and ceiling, using Solar PV (photovoltaic) in the afternoon, adding urinary, using rain chamber on the existing building 0FE03, 0FE04, 0FE10, 0FE30, 0FW03, and 0FW06
4
RESULT
AND
DISCUSSION
4.1 IKE
6702 TABLE 2
The comparison of space width on the building office of Sendangmulyo
AREA TOTAL
LUAS m² KETERANGAN GEDUNG 1 128.96 AC
GEDUNG 2 218.32 AC
TOTAL 347.28
Of the data, it shows the electrical cost in the building as follow:
Lighting cost = 1,042 Watt/day or 1.042 kW/day
HVAC cost = 6,000 Watt/day or 6 kW/day
Other cost = 4,643 Watt/day or 4.643kW/day Total electricity load = 11,677 kW/hari
It is assumed that the operational hour number daily is 24 hours and cost needs factor for 6 working days (24 days) is assumed to be 70%. Thus, it results the electrical cost utility in the building is: 11,677 x 24 x 0.70 = 196.2 kWh/day. It is multiplied by 24 (number of active day in a month), so the electrical energy consumption monthly is: 196.2 kWh 24 = 4708,2 kWh/ day. Thus the IKE score is 14 kWh/m2month.
4.2 Simulation of existing building
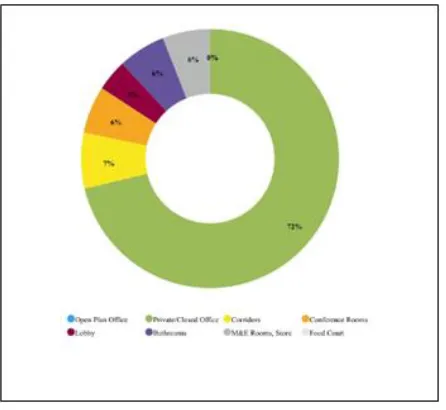
To hold simulation, standard score (main assumption) of the application use are in table 4. Besides, the parameter of monthly weather and temperature in Semarang is involved in the simulation. The annual rain fall in Semarang is 27,447 mm, with geographic position of 7oLS and 110oBT. Next, as shown in Figure 2. Base case for energy saving simulation.
Fig. 2. Base case for energy saving simulation
Based on the case condition of energy usage in the simulation building are shows in Picture 3, the chart resulted from the software. It is obvious that segment ―closed office‖, representing main rooms functioned for service activity needs significant energy portion. The base case condition of the energy usage, needs energy saving increased by simulating step parameter of energy efficiency.
4.3 Comparative Analysis in Different Scenario
Scenario 1
The additional of media reflector is done in this scenario. The existing building it is available the window at northern, southern, western, and eastern part of the building using media reflector situated horizontally with Dh=H/4. In this scenario, there are two choices to get score of efficient AASF. Beside the addition of the overhang depth, the addition of media reflector combination also has more efficient impact. It is conducted comparative study for AASF score between the addition of overhang depth to the addition of media reflector combination on the existing building Figure 3. Chart of comparison result between adding of reflector horizontal depth and Figure 4. Chart of comparison result of combined reflector depth.
Fig. 3. Chart of comparison result between adding of reflector horizontal depth
Fig. 4. Chart of comparison result of combined reflector depth
Scenario 2
6703 Fig. 5. Chart of Improvement SR score
By changing the existing building paint color by white can save energy of 6.68 %.
Scenario 3
The addition of fan and ceiling improves air circulation, so it can gives comfort to the people to stay there in case of sweat absorption during activity. By including 0FE14 the addition of fan on the ceiling gives energy saving of 23.84%.
Scenario 4
In this scenario, the comparative study of the simulation get 30 % of the Annual Electrical Usage. The existing building has energy measurement to add fan on the ceiling. By including parameter 0FE30 the solar PV use give energy saving of 33.84%.
Scenario 5
The attachment of low-urinary reduces water use to clean it. It makes sure the water use efficiently and high satisfaction to the rinsing performance. In this scenario, the comparative study is assumed the flush volume of 2 L. on the existing building, he water used for urinary is added. By including parameter 0FW03 the use of urinary in the toilet gives energy saving of 7.41%.
Scenario 6
The system of rainwater harvesting system can reduce the pure water intake in the city. EDGE automatically counts the estimation of maximum water volume collected by rain water harvest system using data of rain fall from the project location and roof area measurement. On the scenario, the comparative study of the simulation is assumed that the use rain water roof of 50%. On the existing building, the water measurement to use rain water chamber is not added. By including parameter 0FW06, the use of rain water system gives water saving of 100%.
Scenario 7
On the simulation, parameter of energy and water measurement of the comparative study is included simultaneously.
4.4 Analysis of using scenario EDGE
the scenario of comparative study on the office building can be seen in Table 3.
TABLE 3
Scenario of Comparative Study
Skenario
Energy Savings (MWh/Year)
Water Savings (m3/Year)
Carbon Emission tCO2/Year
Operational CO2 savings
(tCO2/Year)
0 128.07 73.25 61.7 106.3
1 135.15 73.25 55.9 112.17
2 129.26 73.25 60.8 107.28
3 143.35 73.25 49.1 118.98
4 155.32 73.25 39.1 128.92
5 128.07 104.1 61.7 106.3
6 127,89 416.38 61.9 106.15
7 160.94 416.38 34.5 133.58
As shown on the table, the energy and water consumption on each scenario shows different score. On scenario 1, the energy measurement shows ultimate energy of 5.6 kWh/month with energy saving of 135.15 MWh/year. Scenario 2 shows ultimate energy usage of 6 kWh/month with energy saving of 129.26 MWh/month. The score does not show the significant improvement of energy saving with EDGE simulation of the existing building. Scenario 3 shows the ultimate energy usage of 4.9 kWh/month with energy saving of 143.35 MWh/year. While, on scenario 4, the additional solar SV shows the high energy saving score compared to the three other scenario of energy saving. For water measurement, saving water energy on scenario 1 shows that the ultimate water usage is 37 m3/month with saving water of 104.01 m3/year. Scenario 2 shows the ultimate water usage of 0 m3/month with saving water of 416.38 m3/year. This mark gives great influence on the water usage in the building.
4.5 Saving energy cost from the proposed building scenario
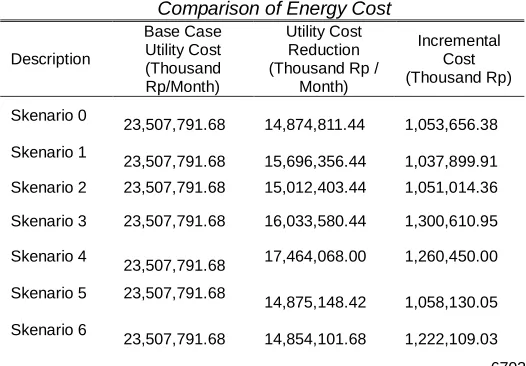
The result shows that energy performance of the proposed design on scenario 7 is much better than the previous addition of the proposed scenario, by 26 % reducing of monthly utility cost. As presented in Table 4 below.
TABLE 4
Comparison of Energy Cost
Description
Base Case Utility Cost (Thousand Rp/Month)
Utility Cost Reduction (Thousand Rp /
Month)
Incremental Cost (Thousand Rp)
Skenario 0 23,507,791.68
14,874,811.44
1,053,656.38
Skenario 1 23,507,791.68 15,696,356.44 1,037,899.91
Skenario 2 23,507,791.68 15,012,403.44 1,051,014.36
Skenario 3 23,507,791.68 16,033,580.44 1,300,610.95
Skenario 4 23,507,791.68 17,464,068.00 1,260,450.00
Skenario 5 23,507,791.68 14,875,148.42
1,058,130.05
Skenario 6 23,507,791.68
14,854,101.68
6704 Skenario 7 23,507,791.68 18,764,894.68 1,503,092.42
4.6 Saving energy consumption of the proposes building scenario
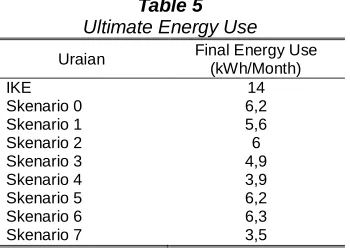
the saving energy consumption of the proposes building scenario on the office building can be seen in Table 5.
Table 5 Ultimate Energy Use
Uraian Final Energy Use (kWh/Month)
IKE 14
Skenario 0 6,2
Skenario 1 5,6
Skenario 2 6
Skenario 3 4,9
Skenario 4 3,9
Skenario 5 6,2
Skenario 6 6,3
Skenario 7 3,5
The calculation of energy consumption IKE achieves 14 kWh/month, this score is included in rather excessive criteria. While the smallest energy consumption is in scenario 7, which the number of consumption is 3.5 kWh/month, which belongs to very efficient energy consumption.
5
CONCLUSION
Saving energy in the existing building can be achieved by many ways, comparative analysis between energy consumption simulated and the use of actual use in the existing building can be done in this study. EDGE is the main software used in this simulation. The implementation of the energy saving refers to 6 increasing parameter : OFE3, OFE4, OFE10, OFE30, 0FW03 and 0FW06 by adding media reflector, changing paint color, adding fan and ceiling, adding photolytic sensor in the afternoon, adding urinary, rain chamber system by giving enery sabing of 79.82 % and 100% on the water saving. The implementation of the above steps will reduce the utility cost montly of about 26%. Analysis shows that the saving ultimate energy consumption achieves 3.5 kWh/month, which this score includes in criteria of very efficient energy consumption. In applying the scenario the value has reached the EDGE standard in achieving green buildings. The EDGE program overcomes gaps in the market for clear green building standards and low-cost assessment systems that outline the benefits for developers, owners and banks, to unblock the potential era of green development and development.
6
ACKNOWLEDGMENT
The authors are grateful to the Government of Semarang City for providing technical support.
REFERENCES
[1]. Akhmad, et al., ―Study of Implementation of Green Building in water conservation of the UNS Hospital Based on the EDGE Certification System,‖
(Excellence in Design for Greater Efficiencies. IJCEE, Vol. 4 No. 2, December 2018. pp. 70-81, 2018. [2]. Buildup.eu, ―Excellence in Design for Greater
Efficiencies (EDGE),‖ [Online]. Available: http://www.buildup.eu/en/learn/tools/excellencedesign
-greater-efficiencies-edge-0. 2016. [Accessed: 20Jul-2016].
[3]. W. Cai,, K. Lai, C. Liu, F. Wei, Ma, M., S. Jia, … Lv, L., ―Promoting sustainability of manufacturing industry through the lean energy-saving and emission-reduction strategy,‖ Science of The Total Environment, 2019.
[4]. E. Cuce, D. Harjunowibowo, & P.M. Cuce, ―Renewable and sustainable energy saving strategies for greenhouse systems: A comprehensive review,‖ Renewable and Sustainable Energy Reviews, 64, 34– 59, 2016.
[5]. M. Dubois & A. Blomsterbeg, ―Energy saving potential and strategies for electric in future North European, low wnwegy office buildings : A literature review,‖ Energy and Buildings, 43(10), 2572-2582, 2011. [6]. E. Tarigan,, ―Energy Saving Measures and Simulation
in the Library Building of University of Surabaya,‖ JTRA, vol. 3, No.1. 63-70, 2018.
[7]. H. Feng & K. Hewage, ―Energy saving performance of green vegetation on LEED certified buildings,‖ Energy and Buildings, 75, 281–289, 2014.
[8]. F. C. IFC, ―User Guide for Offices, Corresponds to EDGE software version 2.0.0, Version 2.0 Last [9]. Ifc.org, ―Why EDGE,‖ [Online]. Available:
http://www.ifc.org/wps/wcm/connect/Topics_Ext_ Content/IFC_External_Corporate_Site/EDGE/Why +Edge/. 2016. [Accessed: 20-Jun-2016].
[10]. M. J. Sorgato, A. P. Melo, and R. Lamberts, ―The effect of window opening ventilation control on residential building energy consumption,‖ Energy Build., vol. 133, pp. 1-13, 2016.
[11]. M. Ordenes, et al., ―The impact of building-integrated photovoltaics on the energy demand of multi-family dwellings in Brazil,‖ Energy and Buildings 39 (2007) 629–642. Modified 2016.07.07,‖ pp. 21-83, 2019. [12]. Y. Pan, R. Yin, & Z. Huang, ―Energy modeling of two
office buildings with data center for green building design,‖ Energy and Buildings, 40(7), 1145–1152, 2008.
[13]. RA. Laksmi, ―Green Building in Sustainable Development Energy Saving Concept Towards Green Building in Jakarta‖, Journal Kalibrasi, Vol. 13, 2018. [14]. R. Saidur, "Energy consumption, energy savings, and
emission analysis in Malaysian office buildings," Energy Policy, Elsevier, vol. 37(10), pages 4104-4113, 2009.
[15]. C. Yin, S. Dadras, X. Huang, J. Mei, H. Malek, & Y. Cheng, ―Energy-saving control strategy for lighting system based on multivariate extremum seeking with Newton algorithm,‖ Energy Conversion and Management, 142, 504–522, 2017.