1 Volume and Issues Obtainable at Center for Sustainability Research and Consultancy
Journal of Accounting and Finance in Emerging Economies
ISSN: 2519-0318 ISSN (E) 2518-8488 Volume 5: Issue 1 June 2019
Journal homepage: www.publishing.globalcsrc.org/jafee
Impact of Capital Structure on the Performance of Textilesector in Pakistan:
Examining the Moderating Effect of Liquidity
1
Adeel Akhtar , 2 Allah Bakhsh, 3 Mehak Ali, 4 Shazia Kousar
1
Assistant Professor, Department of Commerce, Bahauddin Zakariya University, Multan, Pakistan. Email: [email protected]
2
Assistant Professor, Department of Commerce, Bahauddin Zakariya University, Multan, Pakistan. Email: [email protected]
3
National College of Business Administration and Economics, Lahore, Pakistan. Email: [email protected]
4
Department of Management Sciences, Superior University, Lahore, Pakistan. Email: [email protected]
ARTICLE DETAILS ABSTRACT
History
Revised format: May 2019 Available Online: June 2019
Purpose: The basic aim of this study is to investigate how capital structure influences the performance of firms from textile sector listed at Pakistan Stock Exchange, taking liquidity of the firms as a moderator.
Methodology: Data of 30 listed textile firms is taken from their financial statementsfor a period of ten years from 2007 to 2016.Analysis has been conducted using the Ordinary least square (OLS) regression. Two measures of capital structure (debt ratio and debt-to-equity ratio) have been used to find out its impact on three performance measures (return on assets, return on equity, and earnings per share).
Findings: The variable, total debt ratio does not have any significant effect on all the three firm performance measures (return on asset, return on equity and earnings per share). Debt-to-equity ratio variable also does not have a significant impact on two firm performance measures (ROA and ROE). It however has a significant, negative impact on EPS. In case of liquidity as a moderator, it is found that liquidity acts as the significant moderator between the debt ratio and return on assets whereas liquidity factor is significant in case of relation between debt –to-equity variable and two performance variables return on assets and earnings per share..
Practical implications: Practically this study is important from managerial perspective as the appropriate decision for choosing a level of capital structure vis-à-vis total assets and total equity is essential for the better performance of the firms.
© 2019 The authors, under a Creative Commons Attribution-Non Commercial 4.0
Keywords
Capital Structure, Liquidity, Return On Assets, Return On Equity, Earnings Per Share JEL Classification: G3, G30, G32
Corresponding author’s email address: [email protected]
Recommended citation: Akhtar, A., Baksh, A., Ali, M. and Kousar, S. (2019).Impact of Capital Structure on the Performance of Textilesector in Pakistan: Examining the Moderating Effect of Liquidity. Journal of Accounting and Finance in Emerging Economies, 5 (1), 1-12
2
1. Introduction
1.1 Background of the study
Capital structure refers to the modes of financing through which the firm finances its operations. A firm usually adopts a mix arrangement of debt & equity in its capital structure. According toAkeem et al. (2014),capital structure can be said as an association of debt & equity and its effect on the firm’s performance seems to be very critical issue. From the tax perspective, debt seems to be less expensive when compared with the equity on the grounds that it usually provides tax relief as tax is levied on the income after interest payment. On the other hand, when a company is unable to availing the tax relief then tax is deducted before the dividend payment is made.In order to decide how a company will receive finances is managed by both the managers of the organization and fund providers. If finances are arranged by utilizing the inaccurate sequence of debt & equity then it creates a negative impact on the performance and optimal working capacity of the firm. Therefore, for enhancing the value of firm, there lies a need that managers should decide capital structure carefully. Due to fluctuations in the use of leverage from one firm to another firm it becomes complicated task to take appropriate decision. When a firm involves too much equity financing in its financing mix then there is more possibility of change in the ownership of the firm. Javed et al. (2014) express that when a firm heavily depends on the equity financing, it may damage the growth opportunities & liquidity concerns of the company. It is also essential for company managers to sustain minimum cost of capital as when cost of the capital becomes high; a company fails to take up new investment projects.
The concept of capital structure was primarily studied by the Modigliani & Miller (1958) and they stated in theirstudy that in case of perfect competition in capital market then, under such circumstances the capital-structure decisions did not put influence on the value of the firm. Rather, they indicated that the firm’s value could be determined exclusively by its fundamental earning power.
According to Shahzad et al. (2015), Pakistan is a developing economy where majority of the organizations rely on bank credits to finance their venture’s requirements. It is a fact that the textile industry is thought to be the backbone of the Pakistani economy due to which it requires a large number of capitals for their smooth operations. This sector contributes 8.5% to the GDP of Pakistan. The textile industry is not only the biggest industrial sector of the economy, it also has fundamental linkage with its agriculture sector being bread earner of more than half of its population. This sector is also the major contributor to the exports of the country and thus our external account is very much affected by its performance. The textile sector of Pakistan is selected because it demands for the attention of textile firm’s management & the policy makers to pursue such policies that will facilitate in choosing optimal capital structure for achieving optimal allocation of resources and which will augment the performance of the firms.
This studytherefore looks into the impact of capital structure on performance of textile firms of Pakistan which are listed on Pakistan stock exchange for the period of ten years i.e. 2007 to 2016. In this study,total debt to total assets (TDTA) and total debt to total equity(TDTE) are taken as proxies for capital structure as independent variableswhereas return on assets(ROA), return on equity(ROE) and earnings per share(EPS) are performance measures, adopted as dependent variables. Moreover, liquidity is used as the moderator in the relation between capital structure and financial performance of the sample firms.
2. Literature Review
2.1 Capital structure and Firm Performance
3
ratio. Kazempour & Aghaei, (2015)carried out a research to observing the impact of debt level on the firm's Tobin's Q as a measure of performance. They argued that there occurred a significant and direct correlation between the capital structure and firm’s overall performance. Tan & Hamid, (2016)investigated the impact of capital structure (short and long-term debt ratio, total debt to total asset ratio & total debtto total equity ratio)on organizational performance (ROE, ROA, GMS, PE, and EPS) and reported that capital structure is significantly important for increasing the organizational performance inMalaysia. Rouf, (2015) found a significant negative effect of capital structure of a manufacturing firm on its performance measured by ROA and ROS proxies. In Pakistan, study of Siddik et al., (2017)exposed that all the elements of capital structure i.e. total debt to total assets(TDTA), long-term debt to total assets (LTDTA), and short term debt to total assets (STDTA) adversely influence the financial performance measuredby ROA, ROE & EPS. Besides, it was also perceived that growth opportunities, size and inflation associated positively whether liquidity & GDP negatively associated with the bank’s performance in the evolving economy of Bangladesh. Mahmood et al., (2017) conducted their research on 15 listed textile firms of Pakistan and suggested that the negative connection existed between debt (short-tenure & long-tenure) and firm’s performance variables (ROE and ROA). Moreover, debt to equity ratio is positively associated with performance. Khodavandloo et al., (2017)worked out correlation between capital structure and performance of Malaysian firms during periods of financial crises and found that the firm’s performance indicators (ROE, ROA, & GPM, EPS & PE) had been negatively linked withits capital structure. Farooq & Jibran, (2017)argued that when small firms take more debts to finance its operations its profitability is affected badly, though for larger size organizations, this negative effect is found to be minimal. Shahid et al., (2016) found anegative linkage between profitability of textile firms & their capital structure in Pakistan. Pandey & Sahu (2017)interpreted that the capital structure influenced significantly and negativelythe accounting performance (return on asset & return on net-worth) of Indian manufacturing firms. It means that if these firmsresort to higher leverage, their performance may decrease Likewise, Awais et al., (2016) also showed that short-term & long-term debts caused decline in firms’ financial performance, whereas total debt ratio significantly associated with the firm performance. Ramadan & Ramadan, (2015) observed that the capital structure of Jordanian firms had significant and also negative effect on return on assets (ROA), the only measure of firms’ performance used in this study. Le & Bich,(2017) clarified that all debt ratios have altogether negatively association with the company performance.Jayiddin et al., (2017) investigated capital structure’s influence on the performance of Malaysian public listed companies which operate in the construction sector, within the time frame of 2010 to 2014. They witnessed that short- term debt ratios had significantly & negatively affected firm performance but long-term debt ratios did not.
2.2 Liquidity and Firm performance
4
EPS
ROA
Liquidity
ROE
Total Debt to
Total Assets
Total Debt to
Equity
liquidity level in its organization for attaining efficiency & effectiveness. Tuffour & Boateng, (2017) implied that the profitability performance of Ghana’s manufacturing firms was positively affected by the liquidity in the context of current ratio. It means that as more as the manufacturing firm has current assets to meet its current liabilities at the time of the need, the more it can able to earn high profit. Ahmad et al., (2015) detected that textile corporations ought to diminish such assets which can effortlessly releasable for the specific purpose to enhance its performance in terms of profitability. This means that when Textile Company keeps such assets in large quantity, it affects substantially & negatively their financial performance. Vintila & Nenu, (2016) identified the correlation between liquidity & Romanian company’s financial performance before & after the financial disaster i.e. from 2005 to 2014 and elaborated that decrease in the level of liquidity is not considered as the risk factor of Romanian firms. Hence there exists negative correlation between liquidity & company’s financial performance. Marozva, (2015) recognized that there lied negative significant correlation among marginal net interest, risk and liquidity. However, net interest margin seemed to be insignificantly related with the two determinants of liquidity. Yakubu et al., (2017) examined the connection amongst capital structure & the performance of Ghana’s commercial banks in the presence of control variables like liquidity and firm’s size and concluded that liquidity effects insignificantly & negatively on the bank’s performance.
Hence, by studying all the previous literatures regarding capital structure and firm performance , it can be said that many authors found positive effect of capital structure on firm’s performance (Basit & Hassan, 2017; Kazempour & Aghaei, 2015; Tan & Hamid, 2016).While, some studies found negative relationship of capital structure & firm’s performance(Ahmad et al., 2015; Khodavandloo et al., 2017; Rouf, 2015; Siddik et al., 2017). Also, some studies provide evidence of no correlation among capital structure & firm’s performance(Al-Taani, 2013; Chaudhuri et al., 2016; Chhapra &Asim, 2012).
On the other hand, some literature regarding liquidity and firm’s performance showed their positive impact on each other (Edem, 2017; Odalo & Achoki, 2016; Sheikhdon & Kavale, 2016; Tuffour & Boateng, 2017). Whereas, some authors observed negative relation among liquidity &firm’s performance (Ahmad et al., 2015; Njimanted et al., 2017; Vintila & Nenu, 2016).
2.3 Research Gap
After reviewing literature on the relationship between capital structure and firm’s performance it has been noted that studies like Muigai & Muriithi, (2017) and Salam et al., (2016)used firm size as a moderator to determine the performance of the firm but none of the study used liquidity as the moderator. In order to analyze the strength of relationship between capital structure and performance of textile firms in Pakistan,currentstudy uses liquidity as a moderator. Previously,Mahmood et al., (2017) studied 15 textile firms of Faisalabad for the period of five years i.e. 2011-2015 but this study has analyzed 30 textile firms listed on the Pakistan stock exchange for the period of ten years i.e. 2007-2016.
3. Conceptual Framework
3.1 Conceptual Frame Work
Capital structure Firm performance
5
Note: Fig 3.1 shows Capital structure variables are taken as independent variables and firm performance variables as dependent variables. Liquidity is moderator variable of the current study.
3.2 Empirical Model
Based on the previous literature we use the following empirical models:
ROAit = α0 + β1TDTAit + β2TDTEit +εit
ROAit = α0 + β1TDTAit * LQDTYit+ β2TDTEit * LQDTYit+εit
ROAit = α0 + β1TDTAit + β2TDTEit +εit
ROEit = α0 + β1TDTAit * LQDTYit+ β2TDTEit * LQDTYit+εit
EPSit = α0 + β1TDTAit + β2TDTEit +εit
EPSit = α0 + β1TDTAit * LQDTYit+ β2TDTEit * LQDTYit+εit
Where:
TDTA = Total Debt to assets
TDTE = Total Debt to equity LQDTY= Liquidity
ROA= Return on Assets
ROE= Return on Equity
EPS= Earnings per share
β = Regression coefficient of independent variables
α0 = Constant
εit = The error term
3.3 Hypothesis Development
H1a: total debt to total assets ratio has significant impact on return on assets (ROA).
H1b: total debt to total assets ratio has significant impact onreturn on equity (ROE).
H1c: total debt to total assets ratio has significant impact onearnings per share (EPS).
H1d: total debt to total equity ratio has significant impact on return on assets (ROA).
H1e: total debt to total equity ratio has significant impact on return on equity (ROE).
H1f: total debt to total equity ratio has significant impact on earningsper share (EPS).
H2a: liquidity acts as the moderator in the relationship between total debt to total assets (TDTA) ratio and return on assets (ROA).
6
H2c: liquidity acts as the moderator in the relationship between total debt to total assets (TDTA) ratio and earnings per share (EPS).
H2d: liquidity acts as the moderator in the relationship between total debt to equity (TDTE) ratio and return on assets (ROA).
H2e: liquidity acts as the moderator in the relationship between total debt to total equity (TDTE) ratio and return on equity (ROE).
H2f: liquidity acts as the moderator in the relationship between total debt to total equity ratio (TDTE) and earnings per share (EPS).
4. Research Methodology
4.1 Data CollectionMethod
The data used in this study is secondarytype taken from the audited financial statements of 30 textile firms that are listed in Pakistan stock exchange for a period of ten years (2007-2016). The data for all the variables was organized in the panels because Baltagi et al., (2005) suggested that the panel data is suitable for longitudinal analysis as it facilitates analysis of cross-sectional data and time series data both. Moreover, this data was analyzed by applying Unit root test, Hausman test, regression analysis, multi-collinearitytest and descriptive statistics through the software E-views 7.0.
4.2 Measurement of the study Variables 4.2.1 Dependent variable
The dependent variable of the study is the firm’s performance. In order to measure firm’s performance, three proxy variables are used ROA (return on assets), ROE (return on equity) and EPS (earnings per share) which were previously used by ( Khodavandloo et al., 2017; Siddik et al., 2017).
Return on asset (ROA) = Net profit (before taxes) / Total assets
Return on equity (ROE) = Net profit (before taxes) / Equity
Earnings per share (EPS) = Net income/number of outstanding shares
4.2.2 Independent Variables
Capital structure variables i.e. TDTA (total debt to total assets) and TDTE (total debt to total equity) are taken as the independent variables which were used previously by (Raghib et al., 2016; Salteh et al., 2012).
Total debt to assets (TDTA) = Total debt/Total asset
Total debt to equity (TDTE) = Total debt/shareholder’s equity
4.2.3 Moderating variable
This study uses Liquidity as a moderator which is measured by using the following formula i.e. Liquidity (LQDTY) = Current asset / Current liabilities. Such measure has been used recently by Siddik et al., 2017.
5. Results and Discusssions
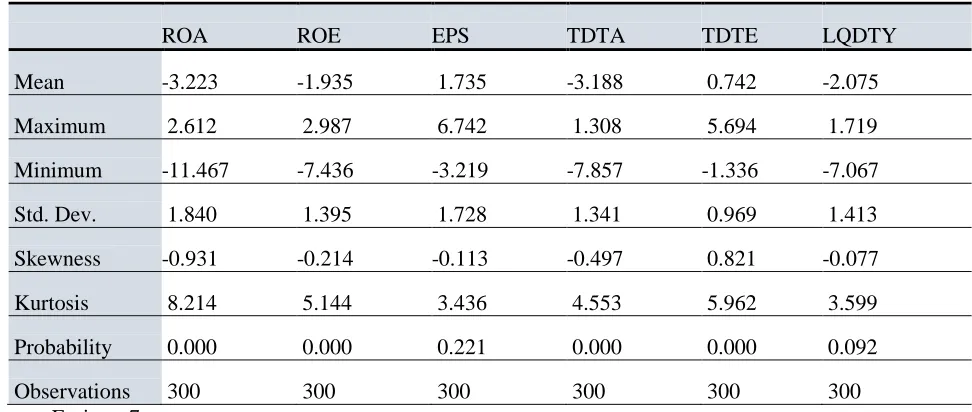
7 Table 1: Results of Descriptive statistics
ROA ROE EPS TDTA TDTE LQDTY
Mean -3.223 -1.935 1.735 -3.188 0.742 -2.075
Maximum 2.612 2.987 6.742 1.308 5.694 1.719
Minimum -11.467 -7.436 -3.219 -7.857 -1.336 -7.067
Std. Dev. 1.840 1.395 1.728 1.341 0.969 1.413
Skewness -0.931 -0.214 -0.113 -0.497 0.821 -0.077
Kurtosis 8.214 5.144 3.436 4.553 5.962 3.599
Probability 0.000 0.000 0.221 0.000 0.000 0.092
Observations 300 300 300 300 300 300
Source: E-views 7
Descriptive statistics make use of both numerical & graphical techniques for interpreting the data set patterns. It summarizes the information about a data set and represents this information in an easy and understanding way.This study depicts descriptive statistics of thirty textile companies in table-1 for all variables that are used in this study.
5.2 Correlation Matrix
Table 2: Correlation Coefficient Matrix
ROA ROE EPS TDTA TDTE LQDTY TDTA*LQDTY
TDTE*LQTD Y
ROA 1 0.024 -0.030 0.008 -0.041 0.193 -0.116 0.130
ROE 0.024 1 0.174 0.039 0.145 0.093 -0.089 -0.030
EPS -0.030 0.174 1 -0.070 -0.260 0.148 -0.083 0.181
TDTA 0.008 0.039 -0.070 1 0.058 0.064 -0.565 -0.007
TDTE -0.041 0.145 -0.260 0.058 1 -0.153 0.097 -0.761
LQDTY 0.193 0.093 0.148 0.064 -0.153 1 -0.790 0.509
TDTA*LQDTY -0.116 -0.089 -0.083 -0.565 0.097 -0.790 1 -0.411
TDTE*LQTDY 0.130 -0.030 0.181 -0.007 -0.761 0.509 -0.412 1
Source: E-views 7
Table 2 shows the matrix of correlation coefficients for all the dependent, independent & moderating variables. As per Wooldridge (2015), multi-collinearity occurs when the coefficient of correlation is higher than 0.7. Therefore, results of the above table indicate that there lies no high level of correlation among all the variables which signifies that multi-collinearity is not serious issue in the estimations of this study.
5.3 Test of Non-Stationarity
8
is the form of unit root test that mostly use for the larger & more complex set of time series models (Zubairi, (2010).
Table 3: ADF unit root test
Variables ADF (at level) ADF (1st difference) Probability
D(ROA) -
123.752 0.0000
D(TDTA)
- 105.102 0.0003
D(Liquidity) -
97.9604 0.0014
ROE
98.7185 - 0.0012
EPS
85.1520 - 0.0181
TDTE
81.9762 - 0.0313
Hence, as per the results of unit root test variables like Earnings per share (EPS), total debt to equity (TDTE) and return on equity (ROE) becomes significant at level which means that no stationarity exists. Whereas, variables i.e. return on assets (ROA), liquidity (LQDTY) and total debt to assets (TDTA) is significant at 1st difference. So, these variables are transformed on 1st difference. After log transformation of these variables conducted in order to handle the normality issues of panel data, this transformed variable are used in further analysis.
5.4 Hausman Test
Table 4:Results of Hausman Test (ROA as Dependent Variable
In order to decide that which panel effects (between fixed and random) provide better results, we carried out Hausman test for the specified panel regression model. Therefore, results of the Hausman test are as follows.
Table 4 shows that ‘p’ value for all independent variables i.e. TDTA, TDTE and the moderator variables i.e. TDTA*LQDTY and TDTE*LQDTY came to be insignificant that is greater than 0.05 which means null hypothesis is not rejected, which means that random effect model is appropriate. Wecan say that random effects model is suitable for conducting panel regression between dependent, independent and its moderating variables.
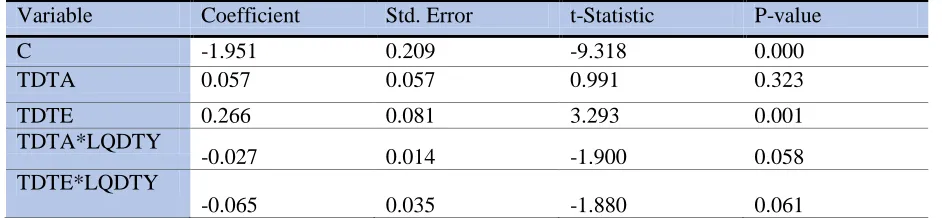
Table 5:Results of Hausman Test (ROE as Dependent Variable)
Variable Coefficient Std. Error t-Statistic P-value
C -1.951 0.209 -9.318 0.000
TDTA 0.057 0.057 0.991 0.323
TDTE 0.266 0.081 3.293 0.001
TDTA*LQDTY
-0.027 0.014 -1.900 0.058
TDTE*LQDTY
-0.065 0.035 -1.880 0.061
9
Table 5 shows that ‘p’ value for independent variable TDTA and the moderator variables i.e. TDTA*LQDTY and TDTE*LQDTY came to be insignificant that is greater than 0.05 which means null hypothesis is not rejected her as well . Hence, random effects model is appropriate for conducting panel regression.
Table6: Results of Hausman Test (EPS as Dependent Variable)
Source: Calculated by using E-views
Table 6 shows that ‘p’ value for independent variable i.e. TDTA and its moderating variable i.e. TDTA*LQDTY came to be insignificant that is greater than 0.05 which means null hypothesis is not rejected and random effects model is appropriate.
5.5 Ordinary Least square Regression
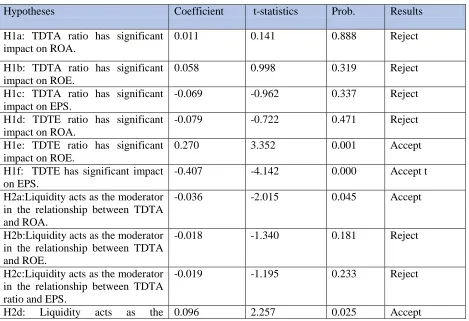
In order to measure the impact of capital structure on firm performance this study used ordinary panel -least-squares regression method for the analysis of panel data through E-views 7 software.
Table 7:Results of OLS Regression
Hypotheses Coefficient t-statistics Prob. Results
H1a: TDTA ratio has significant impact on ROA.
0.011 0.141 0.888 Reject
H1b: TDTA ratio has significant impact on ROE.
0.058 0.998 0.319 Reject
H1c: TDTA ratio has significant impact on EPS.
-0.069 -0.962 0.337 Reject
H1d: TDTE ratio has significant impact on ROA.
-0.079 -0.722 0.471 Reject
H1e: TDTE ratio has significant impact on ROE.
0.270 3.352 0.001 Accept
H1f: TDTE has significant impact on EPS.
-0.407 -4.142 0.000 Accept t
H2a:Liquidity acts as the moderator in the relationship between TDTA and ROA.
-0.036 -2.015 0.045 Accept
H2b:Liquidity acts as the moderator in the relationship between TDTA and ROE.
-0.018 -1.340 0.181 Reject
H2c:Liquidity acts as the moderator in the relationship between TDTA ratio and EPS.
-0.019 -1.195 0.233 Reject
H2d: Liquidity acts as the 0.096 2.257 0.025 Accept
Variable Coefficient Std. Error t-Statistic P-value
C
1.897 0.256 7.426 0.000
TDTA
-0.043 0.069 -0.615 0.539
TDTE
-0.404 0.099 -4.098 0.0001
TDTA*LQDTY
-0.002 0.018 -0.080 0.936
TDTE*LQDTY
10
moderator in the relationship
between TDTE ratio and ROA.
H2e: Liquidity acts as the
moderator in the relationship
between TDTE ratio and ROE.
-0.032 -1.019 0.309 Reject
H2f:Liquidity acts as the moderator in the relationship between TDTE and EPS.
0.099 2.559 0.011 Accept
6. Conclusion And Recommendations
This study empirically examined the impact of capital structure’s choice on the performance of textile firms that are operating in the Pakistan moderated by liquidity. By conducting the Ordinary least square (OLS) regression, it is concluded that capital structure variables (TDTA and TDTE) have insignificant effecton return on assets (ROA), which is consistent with the Akeem et al., (2014); Nassar, (2016) and FRED, (2015). Capital structure variable TDTA has insignificant effecton ROE & EPS, which is compatible with the studies of Tan& Hamid (2016) as well as of Hassan et al., (2014). Capital structure variable TDTE has significant effect on return on equity (ROE) which is compatible with the results of Tan & Hamid (2016) and Basit & Hassan (2017).Whereas, capital structure variable TDTE has significantnegative effect on earnings per share (EPS) which is in accordance with the study of Tan & Hamid, (2016).
A few previous literature on liquidity showed that as an independent variable, it had a significant and positive effect on the firm performance’s measures ROA, ROE & EPS (Banafa, 2016; Edem, 2017; Kahyani et al., 2016; Odalo & Achoki, 2016). Some studies depicted negative relationship of liquidity and firm’s performance (Ahmad et al., 2015; Njimanted et al., 2017; Vintila & Nenu, 2016).Hakeem & Bambale, (2016) used liquidity as the mediator and depicted that it acted as a mediator amongst dividend payout & financial performance of registered manufacturing companies of Nigeria.In this study, the liquidity is taken as the moderator andit is found that liquidity does not act as a moderator between capital structure variable total debt to total assets (TDTA) ratio and firm’s performance variables, return on equity (ROE) & earnings per share (EPS), while liquidity acts as a moderator between the capital structure variable total debt to assets (TDTA) ratio & firm performance variablereturn on assets (ROA). Moreover, liquidity acts as a moderator between the capital structure variable total debt to equity (TDTE) ratio and firm’s performance variables return on assets (ROA) & earnings per share (EPS), whereas liquidity does not act as the amoderator between capital structure variable total debt to equity (TDTE) and return on equity (ROE).
This study used only textile sector of Pakistan whereas future researchers may use other sectors of economyand a larger data set withdifferent time period in order to get further insights.
References
Ahmad, W., Ahmed, T., & Shabbir, G. (2015). Determinants of Textile Firms’ Profitability in Pakistan. Forman Journal of Economic Studies, 11, 87–101.
Akeem, L. B., Terer, E., Kiyanjui, M. W., & Kayode, A. M. (2014). Effects of Capital Structure on Firm’s Performance: Empirical Study of Manufacturing Companies in Nigeria. Journal of Finance and Investment Analysis, 3(4), 39–57.
Awais, M., Iqbal, W., Iqbal, T., Khursheed, A., & Campus, M. (2016). Impact of Capital Structure on the Firm Performance : Comprehensive Study of Karachi Stock Exchange, 28(1), 501–507.
Basit, A., & Hassan, Z. (2017). Impact of Capital Structure on Firms Performance: A Study on Karachi Stock Exchange (KSE) Listed Firms in Pakistan. International Journal of Management, Accounting and Economics, 4(2), 118–135.
Besley, S., & Brigham, E. (2007). Essentials of managerial finance. Cengage learning.
Bibi, N., & Amjad, S. (2017). The Relationship between Liquidity and Firms’ Profitability: A Case Study of
Karachi Stock Exchange. Asian Journal of Finance & Accounting, 9(1), 54.
https://doi.org/10.5296/ajfa.v9i1.10600
11
Edem, D. B. (2017). Liquidity Management and Performance of Deposit Money Banks in Nigeria (1986 –
2011): An Investigation. International Journal of Economics Finance and Management Sciences, 5(3), 146–161. https://doi.org/10.11648/j.ijefm.20170503.13.
Farooq, U., & Jibran, A. Q. (2017). Firm Size as Moderator to Non-Linear Leverage-Performance Relation: An Emerging Market Review. Binus Business Review, 8(2), 99. https://doi.org/10.21512/bbr.v8i2.1711
Hakeem, S. A., & Bambale, A. J. (2016). Mediating Effect of Liquidity on Firm Performance and Dividend Payout of Listed Manufacturing Companies in Nigeria o Title. Journal of Economic Development, Management, IT, Finance and Marketing, 8(1), 15–35.
Islam, S. Z., & Khandaker, S. (2015). Firm leverage decisions: Does industry matter? North American Journal of Economics and Finance, 31, 94–107. https://doi.org/10.1016/j.najef.2014.10.005
Javed, T., Younas, W., & Imran, M. (2014). Impact of Capital Structure on Firm Performance: Evidence from Pakistani Firms. International Journal of Academic Research in Economics and Management Sciences, 3(5). https://doi.org/10.6007/IJAREMS/v3-i5/1141
Jayiddin, N. F., Jamil, A., & Roni, S. M. (2017). Capital Structure Influence on Construction Firm Performance. SHS Web of Conferences, 36, 25. https://doi.org/https://doi.org/10.1051/shsconf/20173600025
Kahyani, S., & Pooya, Karimi, Reza, M. (2016). The effect of firm’s performance on the stock liquidity (Empirical evidence: Tehran Stock Exchange). Scinzer Journal of Accounting and Management, 2(4), 11–15. Retrieved from 10.21634/SJAM.2.4.1115
Kanwal, M., Shahzad, S. J. H., ur Rehman, M., & Zakaria, M. (2017). Impact of Capital Structure on Performance of Non-Financial Listed Companies in Pakistan, (June).
Kazempour, M., & Aghaei, M. A. (2015). Capital structure and firms performance: Evidence from Tehran stock exchange. International Journal of Management, Accounting and Economics, 2(2), 149–152. https://doi.org/10.5539/ijef.v7n12p1
Khodavandloo, M., Zakaria, Z., & Nassir, A. (2017). Capital Structure and Firm Performance During Global Financial Crisis, 7(4), 498–506.
Le, T. P. V., & Thi Bich, N. P. (2017). Capital structure and firm performance: Empirical evidence from a
developing country. Research in International Business and Finance, 42, 710–726.
https://doi.org/10.1016/j.ribaf.2017.07.012
Mahmood, B., Iqbal, M., Zafar, M., & Khalid, B. (2017). Textile Industry Socializing, Economic Gains and Capital
Structure: A Case Study of Faisalabad, Pakistan. Journal of Applied Environmental and Biological
Sciences, 7(9), 1–7.
Marozva, G. (2015). Liquidity And Bank Performance. International Business & Economics Research Journal (IBER), 14(3), 453. https://doi.org/10.19030/iber.v14i3.9218
Modigliani, F., & Miller, M. H. (1958). The Cost of Capital, Corporation Finance and the Theory of Investment. American Economic Review, 48(3), 261–297. https://doi.org/10.4013/base.20082.07
Njimanted, G. F., Akume, A. D., & Aquilas, N. A. (2017). Modelling the Impact of Liquidity Trend on the Financial Performance of Commercial Banks and Economic Growth in Cameroon. International Journal of Financial Research, 8(3), 121. https://doi.org/10.5430/ijfr.v8n3p121
Odalo, S. K., & Achoki, G. (2016). Relating Company Size and Financial Performance in Agricultural Firms Listed in the Nairobi Securities Exchange in Kenya. International Journal of Economics and Finance, 8(9), 34. https://doi.org/10.5539/ijef.v8n9p34.
Pandey, K. D., & Sahu, T. N. (2017). an Empirical Analysis on Capital Structure , Ownership Structure and Firm Performance : Evidence From India. Indian Journal of Commerce and Management Studies, VIII(2), 63– 73. https://doi.org/10.18843/ijcms/v8i2/09
Raghib Zafar, M., Zeeshan, F., & Ahmed, R. (2016). Impact of Capital Structure on Banking Profitability. International Journal of Scientific and Research Publications, 6(3), 186–193.
12
Rehman, M. Z., Khan, M. N., & Khokhar, I. (2015). Investigating Liquidity-Profitability Relationship : Evidence
from Companies Listed in Saudi Stock Exchange (Tadawul).
Journal of Applied Finance & Banking, 5(3), 159–173.
Rouf, A. (2015). Capital Structure and Firm Performance of Listed Non-Financial Companies in Bangladesh. The
International Journal of Applied Economics and Finance, 9(1), 25–32.
https://doi.org/10.3923/ijaef.2015.25.32
Safdar, M. Z., Awan, M. Z., Ahmed, Z., Qureshi, M. I., & Hasnain, T. (2016). What does matter? Liquidity
or profitability: A case of sugar industry in Pakistan. International Journal of Economics and
Financial Issues, 6(3), 144–152.
Shabahang, R. (2011), Accounting theories, 1st volume, Auditing Organization, Tehran.
Shahid, H., Akmal, M., & Mehmood, S. (2016). Effect of Profitability and Financial Leverage on Capital Structure in Pakistan Textile Firms. Arabian Journal of Business and Management Review, 6(4), 4–7. https://doi.org/10.4172/2223-5833.1000222
Shahzad, S. J. H., Ali, P., Ahmad, T., & Ali, S. (2015). Financial leverage and corporate performance: Does financial crisis owe an explanation? Pakistan Journal of Statistics and Operation Research, 11(1).
Sheikhdon, A. A., & Kavale, S. (2016). Effect of Liquidity Management on Financial Perfomance of
Commercial Banks in Mogadishu, Somalia. International Journal for Research in Business,
Management and Accounting, 2(5), 101–123.
Siddik, M., Kabiraj, S., &Joghee, S. (2017). Impacts of Capital Structure on Performance of Banks in a Developing
Economy: Evidence from Bangladesh. International Journal of
Financial Studies, 5(2), 13. https://doi.org/10.3390/ijfs5020013
Tan, S. ., & Hamid. (2016). Capital Structure and Performance of Malaysia Plantation Sector. Journal of Advanced Research in Social and Behavioural Sciences, 3(1), 34–45.
Tuffour, J. K., & Boateng, J. A. (2017). Is Working Capital Management Important? Empirical Evidence from Manufacturing Companies in Ghana. Review of Innovation and Competitiveness, 3(1), 5–20.
Vintila, G., & Nenu, E. A. (2016). Liquidity and Profitability Analysis on the Romanian Listed Companies. Journal of Eastern Europe Research in Business & Economics, 8.