Consensus Report: Diabetes Performance Measures:
Current Status and Future Directions
Patrick J. O’Connor, MD, MPH,1 Noni L. Bodkin, PhD,2 Judith Fradkin, MD,3 Russell E. Glasgow, PhD,4 Sheldon Greenfield, MD,5 Edward Gregg, PhD,6 Eve A. Kerr, MD, MPH,7 L. Gregory Pawlson, MD, MPH,8
Joseph V. Selby, MD, MPH,9 John E. Sutherland, MD,10 Michael L. Taylor, MD,11 and Carol H. Wysham, MD12 This article was reprinted with permission from the July 2011 issue of Diabetes Care, vol. 34, p. 1651–1659,
doi:10.2337/dc11-073. Copyright 2011, American Diabetes Association, Inc.
OVERVIEW: Just as treatment
guidelines for diabetes care were at the forefront of medical guideline development,1 diabetes has been a prominent focus of performance measurement and quality improve-ment initiatives for well over a decade. However, the constraints of pre-electronic health records (EHRs) data systems have consistently limited the clinical scope and sophistication of current diabetes quality measures. The U.S. health care system is nearing a tipping point in the use of more sophisticated EHR-based informa-tion systems, and widespread use of these systems will usher in a new era for diabetes quality measurement. New information system capabilities will enable improvements to existing measures and enable development of much more sophisticated measures that can accommodate personal-ization of clinical goals, patient preferences, and patient-reported data, thus moving both guidelines and measures toward personalization based on sophisticated assessment of the risks and benefits of certain clinical actions for a given patient at a given clinical encounter.
To facilitate discussion of the future of performance measure-ment in diabetes in this era of rapid transition to EHRs, the American Diabetes Association (ADA) con-vened a consensus development conference in December 2010.
Participating experts identified and discussed the following questions: 1. What is the evidence that
measur-ing quality, benchmarkmeasur-ing, and providing feedback or incentives improve diabetes care?
2. What are the limitations, burdens, and consequences (intended or unintended) of diabetes quality measures as currently structured? 3. What should be the role of shared
decision making, patient prefer-ences, and patient-reported data in quality measures?
4. What is the future of quality measurement in diabetes? 5. How can quality monitoring be
integrated into population surveil-lance efforts?
This report summarizes the con-sensus meeting and represents the expert opinion of its authors and not the official position of the ADA or any other participating organization.
1. What is the evidence that measuring quality, benchmarking, and providing feedback or incentives improve diabetes care?
The first national effort to develop a set of performance measures for diabetes was convened by the Center for Medicare and Medicaid Services (CMS), the National Committee on Quality Assurance (NCQA), and the ADA in 1995.2 Evidence showed that complications of diabetes can be reduced by controlling
elderly patients for whom limited life span may preclude the need to screen for complications if they have not already appeared.
During the past decade, the proportion of patients receiving these processes of care has increased across a range of settings.5–7 For sev-eral measures, including A1C, LDL cholesterol, and microalbuminuria testing, proportions are approaching 90%, at least in commercial health maintenance organizations and Veterans Administration popula-tions. However, quality of care improvements with performance measurement does not seem to generalize to aspects of care beyond diabetes. For example, the U.S. Department of Veterans Affairs, which implemented aggressive measurement and quality improve-ment strategies in the 1990s, has been shown to have better quality of diabetes care than the private sector, but has care comparable to the private sector in clinical domains without performance measures.8,9
Several studies demonstrate that although it is relatively easy to improve performance for simple processes of care, improvements in important intermediate outcomes such as A1C, blood pressure, and LDL cholesterol do not necessar-ily follow.10,11 Some care systems with intense disease management programs have improved processes of care but not necessarily interme-diate outcomes,12 and correlations between system-level performance for processes of care and for inter-mediate outcomes such as risk factor control are weak.13 This disconnect between processes and outcomes of care raises the question of whether process measures are valid indica-tors of quality and point to the need to emphasize intermediate outcomes or to develop alternative process
indicators more closely linked to intermediate outcomes of care.
Indicators of intermediate outcomes of care (control of blood pressure, A1C, and LDL cholesterol) were also among the original DQIP measures and have been included in most subsequent diabetes qual-ity measurement sets. Unlike simple process measures, adequate con-trol of these risk factors is related to improved clinical outcomes including cardiovascular events, microvascular complications, and mortality. Assuming that safe, evi-dence-based treatments are used,14 it is likely that populations with better risk factor control or greater improvements in risk factor control over time are receiving better quality care and are benefiting clinically. In fact, as process measures and measures of risk factor control have improved in the U.S., a concomitant reduction in several major adverse outcomes (kidney failure, amputa-tion) has been documented among the population with diabetes.6,15–17
Are these measurable improve-ments due, at least in part, to initiatives related to performance measurement, quality assessment, and quality improvement? A num-ber of small randomized controlled trials of performance measurement suggest that measurement and feedback can lead to improvements in some quality indicators. This effect is more evident with process measures than with risk factor control, and observed improve-ments generally wane over time, especially once feedback ceases.18 Pay for Performance (PfP) initiatives have been implemented in multiple systems, and their effect on quality of care remains controversial.19,20 “Real world” data suggest that the aggressive U.K. PfP initiative mark-edly improved control of glucose and cholesterol for several years after its implementation.21 However,
once targets were reached, further improvements in quality of diabe-tes care slowed, and quality of care for conditions with no incentives declined. In the Kaiser Permanente system, financial incentives for diabetic retinopathy screening increased screening rates modestly from 85 to 88%. However, when financial incentives and other care supports were removed, retinopathy screening rates fell by 3% per year to levels below baseline (80%).22 In a cluster-randomized trial, incentives and feedback linked to EHR-based diabetes clinical decision support modestly improved glucose and blood pressure control, but effects waned after incentives and feedback were removed, even though the clini-cal decision support continued.23
In summary, various combina-tions of performance measurement, feedback to clinicians, quality improvement programs, public reporting, and financial incentives have been associated with sustained improvements in some aspects of diabetes care in many settings. These strategies tend to change specific aspects of care that are being measured and/or paid for, and improvements, which are difficult to maintain, do not necessarily extend to other aspects of care.
2. What are the limitations, burdens, and consequences (intended or unintended) of diabetes quality measures as currently structured? Dichotomous quality measures based
on thresholds for continuous variables.
and LDL cholesterol are appealing because these risk factors predict clinical outcomes, but this approach presents measurement complexities and challenges. Control of these risk factors is influenced not only by provider actions, but also by factors such as patient behaviors, comorbid-ity, and concerns about medication safety and cost. Current performance measures identify thresholds for A1C, blood pressure, and LDL cholesterol control and usually dichotomized performance measures based on these threshold levels. The use of thresholds is easily understood and simple to report, but selection of an appropriate threshold is difficult, especially in the light of recent clinical trial results and subsequent guideline recommenda-tions to individualize clinical goals for A1C and blood pressure.25–29
Dichotomous threshold-based measures suggest that all patients above the threshold need addi-tional pharmacologic or lifestyle intervention. Setting high threshold goals (such as A1C < 9% or systolic blood pressure [sBP] < 160 mmHg) reduces poor quality care and can be appropriately applied to all patients eligible for the measure. However, in most care systems, only a small frac-tion of patients will fail to meet such a high threshold. As threshold goals are lowered, an increasing propor-tion of patients require addipropor-tional treatment to reach the more strin-gent threshold goals. However, the marginal benefits of increased treat-ment diminish as patients approach the goal, while the likelihood of treatment-related side effects and costs of treatment typically increase.
If the risks associated with more intensive treatment are substan-tive, then setting low thresholds for accountability measures (such as A1C < 7% or sBP < 130 mmHg) may actually do more harm than good for many patients—clearly an undesirable situation.30 Lack
of benefit or unintended harm is possible, especially for those above the accountability threshold but already on high dose therapy, those with terminal illness or limited life expectancy, and those susceptible to serious side effects of aggressive therapy such as hypoglycemia or hypotension.31–34 In the past, some guidelines have adopted blood pressure or A1C goals more strin-gent than those validated in clinical trials.25,35 While low blood pressure or A1C levels may benefit some subsets of patients, incorporating low threshold goals in accountability measures is problematic.36 Finally, aiming for stringent targets in every patient ignores patient preferences.37
Since 2008, many diabetes clinical guidelines recommend individualization of A1C and blood pressure goals. In response, some quality measures now include a complex set of exemptions and exclu-sions that may remain challenging to implement even when EHRs data are available. Alternative approaches discussed below are to increase the accountability threshold to a value that is appropriated for nearly all patients, to move from goal-based to risk-based measures, or to imple-ment new “clinical action” measures, which are more tightly linked to out-comes than some current measures.
Composite diabetes quality measures.
Composite performance scores have been widely adopted and may improve the reliability of performance measurement and ranking compared with single measures.38–40 However, various approaches to combining indicators (averaging by indica-tor, averaging by patient, or simply measuring all indicators across all patients) may yield somewhat differ-ent rankings.41 Composite measures convey less granular clinical informa-tion and should be supplemented by providing individual measure data
to the physicians. Current composite scores typically weight each indica-tor equally, so that simple process measures contribute as much to the score as having risk factors in con-trol. This problem can be remedied by weighting the components of a composite measure based on clinical importance.
One variant of the composite score is the “all-or-none” score, which is the proportion of patients for whom all of a set of process indi-cators are met. It has been suggested that the all-or-nothing approach is the best way to drive toward excel-lence.42 However, because the score reduces a set of indicators to a single dichotomous score for each patient, all-or-none measures discard a large amount of information. Consequently they lack sensitivity for distinguishing between plans or physicians and tend to have poor reliability.41 All-or-none measures may be more useful for evaluating a multistep process (e.g., diagnosing and treating pneumonia), in which each step is necessary to achieve a successful outcome. They have less to offer in assessing or improving the parallel and often independent processes of diabetes care, especially since not all care components are of equal importance to individual patients.
3. What should be the role of shared decision making, patient preferences, and patient-reported data in quality measures?
informa-tion may be useful to identify patient preferences and goals, decision making, action plans and follow-up, behavioral risk factors, psychosocial functioning and distress, self-care behaviors, and to assess specific aspects of care such as aspirin use, influenza vaccinations, foot examina-tions, and comorbid conditions such as depression.34,44–47
Patient-reported information could be derived in part from elec-tronic medical records, and in part through surveys or other evolv-ing technologies. Patient-reported information could also be used to assess other aspects of care qual-ity, including care experiences, care transitions, continuity of care,47 patient-provider interactions, as well as some adverse events, such as hypoglycemic episodes.48 Patient decisions not to follow provider advice can be documented and may provide an opportunity for the provider to understand the reasons and respond in a mutually satisfac-tory way. Health literacy, numeracy, out-of-pocket costs, and social environment, which may mediate health disparities by influencing patient preferences and adherence to treatment, may serve as case-mix adjusters for quality measures.
The British National Health Service (NHS) has pioneered the use of patient-reported outcomes of care by having all patients under-going certain elective surgeries fill out pre- and postsurgery reports of their health status, functional status, and other information. In the U.S., the Health Outcomes Survey (HOS) and Consumer Assessment of Healthcare Providers and Systems (CAHPS) survey include a number of performance measurements, functional assessments, and other patient-reported measures (PRMs). Collecting PRMs via efficient and user-friendly modalities (e.g., kiosks, cell phones, Internet, automated
phone systems) may facilitate use of a standardized set of behavioral and psychosocial PRMs with high clini-cal value that could be incorporated in the EHR and then be extracted as performance measures.49
Methodological considerations in selecting PRMs that merit further research include reliability, valid-ity, sensitivity to change, feasibilvalid-ity, importance to clinicians, importance to public health, actionability, and user friendliness.50 The National Institutes of Health (NIH)-funded Patient Reported Outcomes Measurement Information System (PROMIS) initiative is an important example of the potential of PRMs. PROMIS uses analytic techniques such as item response theory to cre-ate and validcre-ate very brief measures that assess a range of symptoms and quality of life–related issues.51 In summary, changing technology, including broader use of EHRs, will likely usher in a new era in patient-reported performance measures, which will broaden the scope and usefulness of existing performance measure sets.52–54
4. What is the future of quality measurement in diabetes?
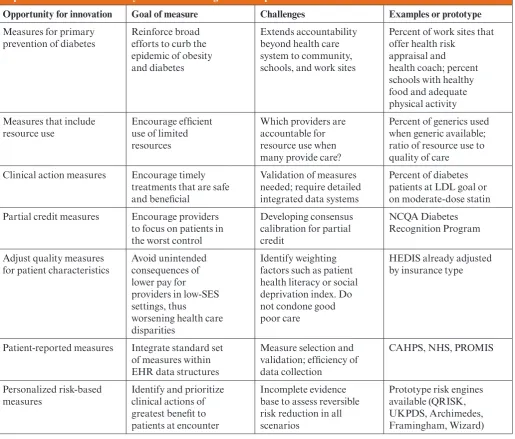
The advent of EHR technology will open new options for diabetes quality measurement, as already noted. Several of the new opportunities that deserve further attention are highlighted below, and Table 1 briefly outlines some of the advantages and challenges of selected innovations.
Clinical action measures. One
pos-sible refinement of dichotomous intermediate outcome measures is the clinical action measure. Clinical action measures are of two types:
1) those that combine a threshold measure for an intermediate outcome with a process of care for those above the threshold, and 2) those that suggest a high-benefit evidence-based
clinical action in certain clinical circumstances.55,56 Examples of these measures include prescribing moderate-dose statins to patients with diabetes over age 40 years, or prescribing an ACE-inhibitor or angiotensin receptor blocker to patients with albuminuria. Clinical action measures could take exclusions into account by removing patients for whom care may be contraindicated or not beneficial from the denominator (e.g., women of childbearing potential, patients with end-stage renal disease). By focusing on the clinical treatment (e.g., statins) rather than only a threshold intermediate outcome value (e.g., LDL cholesterol
< 100 mg/dL), these measures are less likely to motivate treatment with nonevidence-based treatments (e.g., ezetimibe) in order to reach a clinical threshold.14,57
For example, clinical action measures may credit the clinician for appropriate care if 1) the threshold is met (e.g., blood pressure below the measure threshold), or 2) the pro-vider takes an appropriate clinical action (e.g., starting or increasing the dose of an appropriate medication) for a patient above threshold, or 3) the risk factor returns to below the threshold within a given time frame without changes in therapy, or 4) the patient has a contraindication to further therapy intensification (e.g., a very low diastolic blood pressure) or is already on high-dose therapy despite an elevated risk factor level.
unin-tended consequences related to overtreatment. Finally, they take known variation in measurement into account by giving credit for values that return to target within a specified time period. Because many clinical action measures require access to detailed clinical data, they depend on evolved electronic data systems.56,58,59
Weighted quality measures. Some have
expressed concern that
threshold-based performance measures could focus clinician attention inordinately on patients currently just above the target and away from those who are further from the target and may benefit more.60 Others are concerned that performance thresholds could also increase health disparities because vulnerable patients are often further from control, although one recent study allays this concern.61 In general, current use of threshold measures may discard important
information compared with considering the full distribution of values in physician or health plan populations.62
If an A1C threshold measure for “good care” is set at 7%, a provider could get full credit for moving a patient from 7.1 to 6.9%, but no credit for improving con-trol in another patient from 8.8 to 7.1%, despite the fact that the latter patient’s risk has been reduced much more than the former’s.63,64
Table 1 . Summary of Selected Opportunities for New or Improved Diabetes Performance Measures Based on Increasingly Sophisticated Electronic Data Systems and Including Patient-Reported Measures
Opportunity for innovation Goal of measure Challenges Examples or prototype
Measures for primary prevention of diabetes
Reinforce broad efforts to curb the epidemic of obesity and diabetes
Extends accountability beyond health care system to community, schools, and work sites
Percent of work sites that offer health risk
appraisal and health coach; percent schools with healthy food and adequate physical activity Measures that include
resource use
Encourage efficient use of limited resources
Which providers are accountable for resource use when many provide care?
Percent of generics used when generic available; ratio of resource use to quality of care
Clinical action measures Encourage timely treatments that are safe and beneficial
Validation of measures needed; require detailed integrated data systems
Percent of diabetes patients at LDL goal or on moderate-dose statin Partial credit measures Encourage providers
to focus on patients in the worst control
Developing consensus calibration for partial credit
NCQA Diabetes Recognition Program
Adjust quality measures for patient characteristics
Avoid unintended consequences of lower pay for providers in low-SES settings, thus
worsening health care disparities
Identify weighting factors such as patient health literacy or social deprivation index. Do not condone good poor care
HEDIS already adjusted by insurance type
Patient-reported measures Integrate standard set of measures within EHR data structures
Measure selection and validation; efficiency of data collection
CAHPS, NHS, PROMIS
Personalized risk-based measures
Identify and prioritize clinical actions of greatest benefit to patients at encounter
Incomplete evidence base to assess reversible risk reduction in all scenarios
These concerns and others may be somewhat allayed by giving “par-tial credit” to clinicians or systems for treatment efforts, even when a patient does not reach the target.
Credit is assigned based on predicted clinical benefit gained by moving patients from prior poor control to a more favorable clini-cal level. This requires specifying a threshold for poor control (e.g., A1C > 8%) above which no credit is given, and a threshold for good control (e.g., A1C < 7%) at which point full credit is given. Some experts have suggested that benefits be quantified using quality-adjusted life-years saved.65 Other methods to assign partial credit have also been proposed and deserve careful consideration.66
Personalized risk-based quality
measures. The use of risk-based
prediction models can extend the concept of risk and benefit in performance measurement by considering each patient’s calculated risk for an adverse outcome and defining the benefit a patient is likely to obtain from a specific clinical action based on the UK Propective Diabetes Study (UKPDS), QRISK, Framingham, or other risk engines.67–69 Depending on known evidence, the selected risk engine integrates age, comorbidity, other risk factors (e.g., smoking), and current treatments to predict the patient’s risk for a poor outcome. This approach facilitates a patient-specific performance measurement across the continuum of benefit and risk. Such performance measures might assess
1) whether patients above a certain threshold of high risk (where benefit of therapy would clearly outweigh potential harms of treatment) received the therapy in question; 2) whether those below a certain threshold of low risk (where benefit is lower than potential harms) did not receive the
therapy; and 3) whether those in between the two thresholds had a documented discussion of risk and benefit of the therapy and engaged in shared or informed decision making.70 Before this approach is ready for prime time, more work needs to be done to assure that the risk and benefit estimates provided by the risk engines are accurate and based on evidence from intervention trials whenever possible. At present, some risk engines overestimate benefits by relying too heavily on epidemiological rather than clinical trial evidence.
Measures of overtreatment. While the
suggestions outlined above are likely to maximize appropriate care and minimize unintended consequences of performance measures,60,71–76 an additional fruitful area lies in constructing and testing direct measures of potential overtreatment, inappropriate treatment, or harm.74,77 Creating and reporting such measures could serve to counter any pressure to intensify therapy inappropriately in the name of performance improvement. Such measures might identify suboptimal practices such as further intensification of therapy for patients with low diastolic blood pressure and moderate sBP levels (e.g., < 140/65 mmHg); use of glyburide among the elderly or those with impaired renal function; falls or episodes of hypoglycemia severe enough to require emergency care or hospitalization in patients on complex glucose-lowering regimens or insulin; or on high doses of blood pressure medications. Patient-reported data regarding symptoms and treatment burden may enhance our future ability to quantify overtreatment or potential harm.
Quality measures for primary
pre-vention of diabetes. Currently,
diabetes quality measures focus on the treatment of those with diagnosed
diabetes. The Diabetes Prevention Program (DPP) demonstrated that either intensive lifestyle change leading to 7% weight loss or use of metformin substantially reduced the incidence of type 2 diabetes in a diverse U.S. population with impaired glucose tolerance.78 Both interventions were cost-effective from the perspective of the health system and society as delivered in the DPP,79 and similar weight loss and exercise outcomes have been achieved when the DPP lifestyle intervention is implemented in a much less costly form in community settings.80 New performance measures could be designed to assess 1) appropriate implementation of diagnostic tests to identify those at high risk of diabetes,
2) appropriate referral to lifestyle programs and/or metformin therapy, and 3) relative quality and efficacy of lifestyle programs designed to achieve weight loss. Such measures would not only foster the implementation of proven interventions of tremendous public health significance, but would be important models of measuring community-based public health initiatives designed to address weight management, healthy eating, and physical activity.
Incorporating measures of adherence
into performance measures. An
both prescription and medication dispensing data, and 3) a sparse body of research on interventions to improve medication adherence.85 As information systems evolve and more effective interventions to improve adherence are identified, quality measures related to medication adherence may catalyze new efforts to improve adherence and patient health outcomes.
Incorporating costs into quality
measurement. Patients with diabetes
generate medical care costs that are on average two to three times higher than age- and gender-matched patients without diabetes. Cardiovascular complications remain the principal driver of high diabetes care costs; medication costs are also rising more rapidly than overall inflation.86–88 Diabetes and other medical expenditures vary greatly across care systems in relation to the benefits achieved, and a substantial portion of expenditures does not appear to provide any net benefit to the patient.89 These services are usually labeled as wasteful, inappropriate, or inefficient.
NCQA has recently developed diabetes relative resource use mea-sures at the plan level and is testing them at the group practice level. These measures are designed to look at resource use in diabetes care and, when combined with quality measures, can provide an overview of efficiency (high resource use–low quality vs. low resource use–high quality). Barriers to expanding such measures include the need for large sample sizes, the difficulty of accurately quantifying expen-ditures, and the need for accurate risk adjustment. A measure of total expenditures per patient is now available within the Medicare pro-gram and is based on administrative claims data. The information can be further categorized as hospital
inpatient, outpatient, or pharmacy-related (medications). Expenditures can be compared with a set of outcome-related quality measures as an initial step toward trying to define the value (benefit per unit of expen-diture) of care in diabetes.
Over the short term, we need more analysis and understanding of which elements of resource use have positive or negative correlations with measures of quality and outcomes of care. Currently most diabetes perfor-mance measures only assess whether tests or examinations are being underused. Development of mea-sures that look at overuse of tests, examinations, procedures, or tech-nology may be useful in evaluating and maximizing efficiency of care. Measures that encourage the use of generic medications, when available, may also conserve resources. Care provided by various subspecialties for patients with advanced compli-cations of diabetes may be variably efficient or inefficient. With further refinement of both quality and cost-related measures, diabetes could become the poster child for efficient and effective health care.
Using performance measurement to reduce, not worsen, health disparities.
As with many chronic diseases, diabetes is marked by disparities in both treatment and outcomes. Such disparities are primarily based on socioeconomic status (SES), race, and ethnicity, but also exist by sex and age. Because patients of lower SES often have more barriers to self care and worse control of risk factors, clinicians who provide care to many such patients may have lower quality-of-care scores publicly reported, or lose income or incentives related to unadjusted measures of clinical performance. Currently, the HEDIS data are grouped by Medicare, Medicaid, and commercial insurance. In the future, quality measures could
be adjusted in more sophisticated ways to account for variation in patient SES, health literacy, or other factors related to disparities in care. Possible methods include geo-coding, case-mix adjustment, or use of other metrics for SES. On the other hand, “overadjusting” for race/ethnicity and SES could mask real differences in quality of care provided to different groups; such disparities can only be corrected if they are identified.
5. How can quality monitoring be integrated into population surveillance efforts?
Population surveillance of quality of diabetes care provides a crucial com-plement to health system monitoring (e.g., HEDIS) by assessing care in the full population, including persons with limited or no health insurance. Appropriately selected performance measures may serve well as measures for population-based diabetes care surveillance and enable more detailed examination of geographic and other disparities in patterns of care. In addition, surveillance systems are important to monitor risks, adverse events, and resource use in the population, and to guide the design and implementation of strategies to improve quality and outcomes of care.
of the Healthy People Objectives for 2010 and 2020. Other systems such as the National Ambulatory Medical Care Survey (NAMCS) and the National Hospital Discharge Survey (NHDS) provide additional population data on costs and out-comes of care. With the exception of the Dartmouth Health Atlas and selected metropolitan area surveys and laboratory-based registries in New York and Vermont, there is limited population-based data in the U.S. today within smaller geo-graphic areas.90,91
Expansion of existing surveil-lance systems to include measures of risk factor control, patient characteristics and behaviors, risk preferences, indicators of primary prevention, and other measures could serve several useful purposes such as 1) permit more accurate assessment of care quality for patients at different levels of risk, insurance, and SES, and to assess geographic variations in care; 2) pro-mote monitoring of patient safety, drug safety, costs, adverse outcomes, and unintended consequences (e.g., hypoglycemia and polyphar-macy), and medication adherence;
3) prove useful within networks of Patient Centered Medical Homes or Accountable Care Organizations; and 4) facilitate systematic assess-ment of prevention efforts. Some of these innovations could be based on the modification of current popula-tion-based surveys. Others, such as clinical action measures, weighted quality measures, or risk-based quality measures may require funda-mentally new surveillance systems.
Integration with health system– based data could augment the depth of public health systems and extend the representativeness of health system–based data. The growing use of EHRs presents an opportunity to assess variation in intensity and quality of diabetes care. Prototypes
for the use of EHRs data for national surveillance include surveillance systems for vaccine safety, selected infectious diseases, and bioterrorism threats. Diabetes care surveillance might be carefully expanded in phases, perhaps with a “sentinel” system or a distributed data system as initial steps.92 An essential step is to develop and validate a common set of diabetes quality measures. Key data elements might include labora-tory results, pharmaceutical use, utilization of services, and selected patient characteristics and experi-ences of care, including elements collected by patient self-report.
Conclusions and Recommendations
The growing availability of sophisti-cated electronic health data systems will revolutionize diabetes perfor-mance measurement. The use of a rich set of clinical, patient-reported, and claims data will strengthen exist-ing measures and enable development and efficient use of new measures that much more closely mirror the clini-cal care of patients, accommodate the need to customize care based on individual patient risk and benefit profiles, and incorporate assessment of resource use and patient experience of care. For example, development of measures that encourage clinicians to take into account individual patients’ risk status and the relative benefits of various treatments would support clinicians’ efforts to make the right decision for a particular patient while minimizing risk of overtreatment or other unintended consequences. Wider recognition of the importance of patient preferences is also impor-tant, especially when the clinical benefit associated with clinical actions is small or uncertain. Several of the newer approaches to quality measurement outlined here could be implemented in the near term, while others need some additional intermediate-term development prior
to wide-scale dissemination.
ACKNOWLEDGMENTS
The consensus development conference was supported by an unrestricted grant from sanofi-aven-tis. The company had no input into the content of the report. No other potential conflicts of interest relevant to this article were reported.
The contributions to this manu-script by Noni Bodkin (Centers for Medicare and Medicaid Services, Baltimore, Maryland) were carried out in her personal capacity.
REFERENCES
1American Diabetes Association.
Standards of medical care for patients with diabetes mellitus (Position Statement).
Diabetes Care 12:365–368, 1989
2Fleming BB, Greenfield S, Engelgau
MM, Pogach LM, Clauser SB, Parrott MA. The Diabetes Quality Improvement Project: moving science into health policy to gain an edge on the diabetes epidemic. Diabetes Care
24:1815–1820, 2001
3Bell RA, Camacho F, Goonan K, et al.
Quality of diabetes care among low-income patients in North Carolina. Am J Prev Med
21:124–131, 2001
4Quenan L, Remington P, Gohre F, Zapp
P. The Wisconsin Collaborative Diabetes Quality Improvement Project. WMJ
99:48–52, 2000
5Kerr EA, Fleming B. Making
per-formance indicators work: experiences of US Veterans Health Administration. BMJ
335:971–973, 2007
6Saaddine JB, Cadwell B, Gregg EW,
et al. Improvements in diabetes processes of care and intermediate outcomes: United States, 1988-2002. Ann Intern Med 144:465– 474, 2006
7Saaddine JB, Engelgau MM, Beckles
GL, Gregg EW, Thompson TJ, Narayan KMV. A diabetes report card for the United States: quality of care in the 1990s. Ann Intern Med 136:565–574, 2002
8Kerr EA, Gerzoff RB, Krein SL, et al.
Diabetes care quality in the Veterans Affairs Health Care System and commercial man-aged care: the TRIAD study. Ann Intern Med
141:272–281, 2004
9Asch SM, McGlynn EA, Hogan MM, et
al. Comparison of quality of care for patients in the Veterans Health Administration and patients in a national sample. Ann Intern Med
141:938–945, 2004
10Landon BE, Hicks LS, O’Malley AJ,
disease at community health centers. N Engl J Med 356:921–934m 2007
11Jamtvedt G, Young JM, Kristoffersen
DT, O’Brien MA, Oxman AD. Does telling people what they have been doing change what they do? A systematic review of the effects of audit and feedback. Qual Saf Health Care 15:433–436m 2006
12Mangione CM, Gerzoff RB, Williamson
DF, et al.; TRIAD Study Group. The associa-tion between quality of care and the intensity of diabetes disease management programs.
Ann Intern Med 145:107–116m 2006
13Ackermann RT, Thompson TJ, Selby
JV, et al.; Translating Research into Action for Diabetes (TRIAD) Study Group. Is the number of documented diabetes process-of-care indicators associated with cardiometabolic risk factor levels, patient satisfaction, or self-rated quality of diabetes care? The Translating Research into Action for Diabetes (TRIAD) study. Diabetes Care
29:2108–2113m 2006
14Krumholz HM, Lee TH. Redefining
quality—implications of recent clinical trials.
N Engl J Med 358:2537–2539, 2008
15Beaulieu N, Cutler D, Ho K, et al. The
business case for diabetes disease manage-ment for managed care organizations. Forum Health Econ Policy 9:Article 1, 2007
16Centers for Disease Control and
Prevention. Centers for Disease Control and Prevention: National Diabetes Surveillance System [Internet], 2008. Available from http:// www.cdc.gov/diabetes/statistics/index.htm. Accessed 4 March 2011
17Burrows NR, Li Y, Geiss LS. Incidence
of treatment for end-stage renal disease among individuals with diabetes in the U.S. continues to decline. Diabetes Care 33:73–77, 2010
18Tierney WM, Overhage JM, Murray
MD, et al. Can computer-generated evidence-based care suggestions enhance evidence-based management of asthma and chronic obstructive pulmonary disease? A randomized, controlled trial. Health Serv Res
40:477–497, 2005
19Ryan AM, Blustein J. The effect of the
MassHealth hospital pay-for-performance program on quality. Health Serv Res
46:712–728, 2011
20Serumaga B, Ross-Degnan D, Avery
AJ, et al. Effect of pay for performance on the management and outcomes of hyperten-sion in the United Kingdom: interrupted time series study. BMJ 342:d108, 2011
21Oluwatowoju I, Abu E, Wild SH, Byrne
CD. Improvements in glycaemic control and cholesterol concentrations associated with the Quality and Outcomes Framework: a regional 2-year audit of diabetes care in the UK. Diabet Med 27:354–359, 2010
22Lester H, Schmittdiel J, Selby J, et al.
The impact of removing financial incentives from clinical quality indicators: longitudinal analysis of four Kaiser Permanente indica-tors. BMJ 340:c1898, 2010
23O’Connor PJ, Sperl-Hillen JM, Rush
WA, et al. Impact of electronic health record
clinical decision support on diabetes care: a randomized trial. Ann Fam Med 9:12–21, 2011
24Selby JV, Swain BE, Gerzoff RB, et al.;
TRIAD Study Group. Understanding the gap between good processes of diabetes care and poor intermediate outcomes: Translating Research into Action for Diabetes (TRIAD).
Med Care 45:1144–1153, 2007
25Gerstein HC, Riddle MC, Kendall DM,
et al.; ACCORD Study Group. Glycemia treatment strategies in the Action to Control Cardiovascular Risk in Diabetes (ACCORD) trial. Am J Cardiol 99:34i–43i, 2007
26Cushman WC, Evans GW, Byington
RP, et al.; ACCORD Study Group. Effects of intensive blood-pressure control in type 2 diabetes mellitus. N Engl J Med 362:1575– 1585, 2010
27Patel A, MacMahon S, Chalmers J,
et al.; ADVANCE Collaborative Group. Intensive blood glucose control and vascular outcomes in patients with type 2 diabetes. N Engl J Med 358:2560–2572, 2008
28American Diabetes Association.
Standards of medical care in diabetes—2011.
Diabetes Care 34 (Suppl. 1):S11–S61, 2011
29Institute for Clinical Systems
Improvement. Health Care Guidelines: Diabetes Mellitus in Adults, Type 2; Diagnosis and Management of (Guideline) [Internet], 2010. Available from http:// www.icsi.org/guidelines_and_more/ gl_os_prot/other_health_care_conditions/ diabetes_mellitus__type_2/diabetes_mel-litus__type_2__management_of___6.html. Accessed 17 November 2010
30Zoungas S, Patel A, Chalmers J, et al.;
ADVANCE Collaborative Group. Severe hypoglycemia and risks of vascular events and death. N Engl J Med 363:1410–1418, 2010
31Choe HM, Bernstein SJ, Standiford CJ,
Hayward RA. New diabetes HEDIS blood pressure quality measure: potential for over-treatment. Am J Manag Care 16:19–24, 2010
32Hayward RA. Performance
measure-ment in search of a path. N Engl J Med
356:951-953, 2007
33Kerr E. Assessing Quality of Care for
Diabetes: Conference Final Report [Internet], 2008. Rockville, MD, U.S. Department of Health and Human Services, Agency for Healthcare Research and Quality. Available from http://www.ahrq.gov/qual/diabetescare. Accessed 15 January 2011
34Greenfield S, Billimek J, Pellegrini F,
et al. Comorbidity affects the relationship between glycemic control and cardiovascular outcomes in diabetes: a cohort study. Ann Intern Med 151:854–860, 2009
35Cushman WC, Grimm RH Jr, Cutler
JA, et al.; ACCORD Study Group. Rationale and design for the blood pressure interven-tion of the Acinterven-tion to Control Cardiovascular Risk in Diabetes (ACCORD) trial. Am J Cardiol 99:44i–55i, 2007
36Pogach L, Engelgau M, Aron D.
Measuring progress toward achieving
hemo-globin A1c goals in diabetes care: pass/fail or partial credit. JAMA 297:520-523, 2007
37Sox HC, Greenfield S. Quality of
care—how good is good enough? JAMA
303:2403–2404, 2010
38Kaplan SH, Griffith JL, Price LL,
Pawlson LG, Greenfield S. Improving the reliability of physician performance assess-ment: identifying the “physician effect” on quality and creating composite measures.
Med Care 47:378–387, 2009
39Scholle SH, Roski J, Adams JL, et al.
Benchmarking physician performance: reli-ability of individual and composite measures.
Am J Manag Care 14:833–838, 2008
40National Committee for Quality
Assurance. NCQA Recognition Directory [Internet], 2003. Available from http:// recognition.ncqa.org/PSearchResults. aspx?state=MN&rp=3. Accessed 15 May 2007
41Reeves D, Campbell SM, Adams J,
Shekelle PG, Kontopantelis E, Roland MO. Combining multiple indicators of clinical quality: an evaluation of different analytic approaches. Med Care 45:489–496, 2007
42Nolan T, Berwick DM. All-or-none
measurement raises the bar on performance.
JAMA 295:1168–1170, 2006
43Sequist TD, Schneider EC, Anastario
M, et al. Quality monitoring of physicians: linking patients’ experiences of care to clini-cal quality and outcomes. J Gen Intern Med
23:1784–1790, 2008
44Glasgow RE, Christiansen S, Smith
KS, Stevens VJ, Toobert DJ. Development and implementation of an integrated, multi-modality, user-centered interactive dietary change program. Health Educ Res 24:461–471, 2009
45National Institutes of Health.
Patient Reported Outcomes Measurement Information System [Internet]. Available from http://www.nihpromis.org/default.aspx. Accessed 23 February 2011
46Glasgow RE, Peeples M, Skovlund SE.
Where is the patient in diabetes performance measures? The case for including patient-centered and self-management measures.
Diabetes Care 31:1046–1050, 2008
47Parchman ML, Burge SK; Residency
Research Network of South Texas
Investigators. Continuity and quality of care in type 2 diabetes: a Residency Research Network of South Texas study. J Fam Pract
51:619–624, 2002
48Fisher L, Glasgow RE, Mullan JT, Skaff
MM, Polonsky WH. Development of a brief diabetes distress screening instrument. Ann Fam Med 6:246–252, 2008
49Krist AH, Woolf SH. A vision for
patient-centered health information systems.
JAMA 305:300–301, 2011
50Fisher EB, Fitzgibbon ML, Glasgow
RE, et al. Behavior matters. Am J Prev Med
40:e15–e30, 2011
51Boers M. Standing on the
Information System. J Clin Epidemiol
63:1167–1168, 2010
52Society of Behavioral Medicine. The
public health need for patient-reported measures and health behaviors in electronic medical records: a policy statement of the Society of Behavioral Medicine [article online], 2010. Available from http://www.sbm. org/policy/patient-reported_measures.pdf. Accessed 23 February 2011
53Fernald DH, Froshaug DB, Dickinson
LM, et al. Common measures, better out-comes (COMBO): a field test of brief health behavior measures in primary care. Am J Prev Med 35 (Suppl.):S414–S422, 2008
54McCormack LA, Williams-Piehota PA,
Bann CM, et al. Development and validation of an instrument to measure resources and support for chronic illness self-management: a model using diabetes. Diabetes Educ
34:707–718, 2008
55Kerr EA, Krein SL, Vijan S, Hofer TP, Hayward RA. Avoiding pitfalls in chronic disease quality measurement: a case for the next generation of technical quality mea-sures. Am J Manag Care 7:1033–1043, 2001
56Kerr EA, Smith DM, Hogan MH, Hofer TP, Krein SL, Hayward RA. Building a bet-ter quality measure: are some patients with poor intermediate outcomes really getting good quality care? Med Care 41:1173–1182, 2003
57Hayward RA. All-or-nothing treatment
targets make bad performance measures. Am J Manag Care 13:126–128, 2007
58Persell SD, Kho AN, Thompson JA,
Baker DW. Improving hypertension quality measurement using electronic health records.
Med Care 47:388–394, 2009
59Rodondi N, Peng T, Karter AJ, et al.
Therapy modifications in response to poorly controlled hypertension, dyslipidemia, and diabetes mellitus. Ann Intern Med 144:475– 484, 2006
60Moscucci M, Eagle KA, Share D, et al.
Public reporting and case selection for percu-taneous coronary interventions: an analysis from two large multicenter percutaneous coronary intervention databases. J Am Coll Cardiol 45:1759–1765, 2005
61Bainbridge KE, Cowie CC, Rust KF,
Fradkin JE. Mitigating case mix factors by choice of glycemic control performance mea-sure threshold. Diabetes Care 31:1754–1760, 2008
62Guthrie B. Measuring the quality of
healthcare systems using composites. BMJ
337:a639, 2008
63CDC Diabetes Cost-effectiveness
Group. Cost-effectiveness of intensive glyce-mic control, intensified hypertension control, and serum cholesterol level reduction for type 2 diabetes. JAMA 287:2542-2551, 2002
64Vijan S, Hofer TP, Hayward RA.
Estimated benefits of glycemic control in microvascular complications in type 2 diabe-tes. Ann Intern Med 127:788–795, 1997
65Pogach LM, Rajan M, Aron DC.
Comparison of weighted performance measurement and dichotomous thresholds
for glycemic control in the Veterans Health Administration. Diabetes Care 29:241–246, 2006
66Vogt TM, Feldstein AC, Aickin M, Hu
WR, Uchida AR. Electronic medical records and prevention quality: the prevention index.
Am J Prev Med 33:291–296, 2007
67D’Agostino RBVR Sr, Vasan RS,
Pencina MJ, et al. General cardiovascular risk profile for use in primary care: the Framingham Heart Study. Circulation
117:743–753, 2008
68Eddy DM, Schlessinger L. Archimedes:
a trial-validated model of diabetes. Diabetes Care 26:3093–3101, 2003
69UK Prospective Diabetes Study Group.
UKPDS Risk Engine [Internet], 2004. Available from http://www.dtu.ox.ac.uk/ riskengine. Accessed 9 March 2011
70McNutt RA. Shared medical decision
making: problems, process, progress. JAMA
292:2516–2518, 2004
71Boyd CM, Darer J, Boult C, Fried LP,
Boult L, Wu AW. Clinical practice guidelines and quality of care for older patients with multiple comorbid diseases: implications for pay for performance. JAMA 294:716–724, 2005
72Burack JH, Impellizzeri P, Homel P,
Cunningham JN Jr. Public reporting of surgi-cal mortality: a survey of New York state cardiothoracic surgeons. Ann Thorac Surg
68:1195-1200, 1999; discussion 1201-1192, 1999
73Casalino LP. The unintended
conse-quences of measuring quality on the quality of medical care. N Engl J Med 341:1147–1150, 1999
74Snyder L, Neubauer RL; American
College of Physicians Ethics, Professionalism and Human Rights Committee. Pay-for-performance principles that promote patient-centered care: an ethics manifesto.
Ann Intern Med 147:792–794, 2007
75Wachter RM, Flanders SA, Fee C,
Pronovost PJ. Public reporting of antibiotic timing in patients with pneumonia: lessons from a flawed performance measure. Ann Intern Med 149:29–32, 2008
76Werner RM, Asch DA, Polsky D. Racial
profiling: the unintended consequences of coronary artery bypass graft report cards.
Circulation 111:1257–1263, 2005
77Pogach L, Aron D. Balancing
hypogly-cemia and glycemic control: a public health approach for insulin safety. JAMA 303:2076– 2077, 2010
78Knowler WC, Hamman RF, Edelstein
SL, et al.; Diabetes Prevention Program Research Group. Prevention of type 2 diabetes with troglitazone in the Diabetes Prevention Program. Diabetes 54:1150–1156, 2005
79Herman WH, Hoerger TJ, Brandle M,
et al.; Diabetes Prevention Program Research Group. The cost-effectiveness of lifestyle modification or metformin in preventing type
2 diabetes in adults with impaired glucose tolerance. Ann Intern Med 142:323–332, 2005
80Ackermann RT, Marrero DG. Adapting
the Diabetes Prevention Program lifestyle intervention for delivery in the community: the YMCA model. Diabetes Educ 33:69, 74–65, 77–68, 2007
81Cramer JA, Benedict A, Muszbek
N, Keskinaslan A, Khan ZM. The signifi-cance of compliance and persistence in the treatment of diabetes, hypertension and dyslipidaemia: a review. Int J Clin Pract
62:76–87, 2008
82Lau DT, Nau DP. Oral
antihyper-glycemic medication nonadherence and subsequent hospitalization among indi-viduals with type 2 diabetes. Diabetes Care
27:2149–2153, 2004
83Ho PM, Rumsfeld JS, Masoudi FA, et
al. Effect of medication nonadherence on hospitalization and mortality among patients with diabetes mellitus. Arch Intern Med
166:1836–1841, 2006
84DiMatteo MR, Giordani PJ, Lepper
HS, Croghan TW. Patient adherence and medical treatment outcomes: a meta-analysis.
Med Care 40:794–811, 2002
85Parchman ML, Pugh JA, Romero RL,
Bowers KW. Competing demands or clinical inertia: the case of elevated glycosylated hemoglobin. Ann Fam Med 5:196-201, 2007
86Selby JV, Ray GT, Zhang D, Colby CJ.
Excess costs of medical care for patients with diabetes in a managed care population.
Diabetes Care 20:1396–1402, 1997
87Gilmer TP, O’Connor PJ, Manning WG,
Rush WA. The cost to health plans of poor glycemic control. Diabetes Care 20:1847–1853, 1997
88Gilmer TP, O’Connor PJ, Rush WA, et
al. Predictors of health care costs in adults with diabetes. Diabetes Care 2005;28:59–64
89Orszag PR, Ellis P. The challenge of
rising health care costs—a view from the Congressional Budget Office. N Engl J Med
357:1793–1795, 2007
90Chamany S, Silver LD, Bassett MT, et
al. Tracking diabetes: New York City’s A1C registry. Milbank Q 87:547–570, 2009
91Maclean CD, Gagnon M, Callas P,
Littenberg B. The Vermont diabetes informa-tion system: a cluster randomized trial of a population based decision support system.
J Gen Intern Med 24:1303–1310, 2009
92Brown JS, Holmes JH, Shah K, Hall K,
Lazarus R, Platt R. Distributed health data networks: a practical and preferred approach to multi-institutional evaluations of com-parative effectiveness, safety, and quality of care. Med Care 48 (Suppl.):S45–S51, 2010
From the Health Partners Research Foundation,1 Minneapolis, Minnesota;
the Centers for Medicare and Medicaid Services,2 Baltimore,
Diabetes and Digestive and Kidney Diseases,3 Bethesda, Maryland;
the National Cancer Institute,4
Rockville, Maryland; the University of California–Irvine,5 Irvine, California;
the Centers for Disease Control and Prevention,6 Atlanta, Georgia; the
University of Michigan, 7 Ann Arbor,
Michigan; the National Committee for Quality Assurance,8 Washington,
D.C.;Kaiser Permanente Northern California,9 Oakland, California;the
Northeast Iowa Medical Education Foundation,10 Waterloo, Iowa;
Caterpiller, Inc.,11 Peoria, Illinois; and
the University of Washington School of Medicine,12 Spokane,Washington.
Corresponding author: Patrick J. O’Connor, patrick.j.oconnor@ healthpartners.com.
DOI: 10.2337/dc11-0735
The views and opinions expressed in this article are those of the authors and do not reflect those of the American Diabetes Association, the U.S. Centers for Disease Control and Prevention, the U.S. Department of Veterans
Affairs, the Centers for Medicare and Medicaid Services, the U.S. Department of Health and Human Services, the U.S. government, or other organizations with which particular authors are affiliated.