ORIGINAL ARTICLE DOI 10.1007/s10086-005-0729-4
M. Yasumura (*)
Faculty of Agriculture, Shizuoka University, 836 Ohya, Shizuoka 422-8529, Japan
Tel. +81-54-237-1111; Fax +81-54-237-3028 e-mail: [email protected] T. Kamada
NODA Corporation, Shizuoka 424-0906, Japan Y. Imura · M. Uesugi
Miyazaki Prefecture Wood Utilization Technical Center, Miyazaki 885-0037, Japan
L. Daudeville
Laboratoire 3S, Université Joseph Fourrier, Grenoble 38041, France
Part of this article was presented at the 53rd Annual Meeting of the Japan Wood Research Society, Fukuoka, March 2003, the 2003 Annual Meeting of Architectural Institute of Japan, Nagoya, September 2003, and meeting thirty-six of CIB-W18, Colorado, August 2003
Motoi Yasumura · Takahisa Kamada · Yutaka Imura Motoi Uesugi · Laurent Daudeville
Pseudodynamic tests and earthquake response analysis of timber structures
II: two-level conventional wooden structures with plywood sheathed
shear walls
Received: April 20, 2004 / Accepted: March 22, 2005 / Published online: February 1, 2006
Abstract Pseudodynamic (PSD) tests were conducted on
two-level timber structures with plywood-sheathed shear walls, which each had an opening of different configuration, to study the effects of the mechanical properties of the first and second levels on the earthquake response of the structure. The specimens had two-level conventional post and beam frames that were 3 m wide, 3 m deep, and 6 m high with plywood sheathings nailed on one face of the structure. The first and second levels had different opening configurations of window, door, or slit. Lateral forces were applied at the top of the first and second levels, calculating step by step the next displacement based on the North-South (NS) components of the 1940 El Centro earthquake. The test results were compared with those of the time– history earthquake response analysis using the lumped mass model and hysteresis model presented in the companion article (part I). The experimental and simulated results showed that the simulation by means of the lumped mass time–history earthquake response analysis predicted quite well the response of the first level, but tended to underesti-mate the response of the second level, and that the PSD tests of an individual wall system with the mass supported by that particular wall generally show a conservative esti-mate of the response.
Key words Computer on-line control · Lumped mass
model · Dynamic analysis · Two-level structures · Plywood sheathing
Introduction
Pseudodynamic (PSD) testing is a useful method for understanding and estimating the seismic performance of timber structures.1
To conduct the PSD tests of lateral-resisting elements such as shear walls, we need to determine the mass that is the most sensitive to the earthquake re-sponse. In general, we consider the lateral-resisting element of the first level of a structure and apply the mass supported by that particular element. However, the effects of the mechanical properties of the upper level may not be negli-gible on the response of the first level. Most PSD tests that have been conducted on conventional wooden
struc-tures and light-frame wooden strucstruc-tures2–5
are related to simple shear walls or single level wall systems with openings. Therefore, we conducted PSD tests on two-level timber structures with plywood-sheathed shear walls, which each had an opening of different configuration, to study the effects of the lateral stiffness and strength of the first and second levels on the response of the entire structure.
Time–history earthquake response analysis is another effective method to evaluate the seismic performance of timber structures. A good model for the hysteresis of lat-eral-resisting elements is required to predict the response. A hysteresis model used in part I of this study5
Method and materials
Specimens
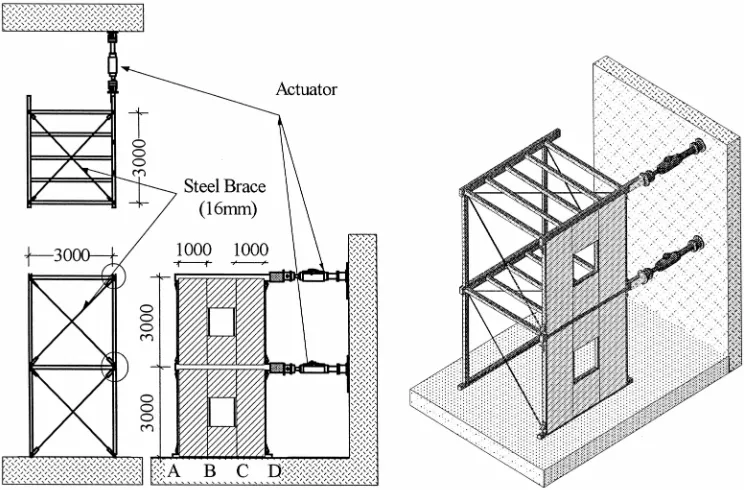
Figure 1 gives a general representation of the specimen and the test setup. Specimens had two-level conventional post and beam frames that were 3 m wide, 3 m deep, and 6 m high. Plywood sheathings were nailed on only one face of the structure.
The specimens consisted of 105 ¥ 105 mm posts and sills
and 105 ¥ 210 mm beams of spruce (Picea spp.) glued
lami-nated timber. Posts placed every 1000 mm were connected to the sill and the beam with a steel pipe of 26.5 mm
diam-eter and hold-down connections (HD-B15).6
Two hold-down connections were attached at the foot of the first-level posts and one at the top connected to another hold-down connection at the foot of the second-level posts. Sills were attached tightly to a steel base frame with 16-mm-diameter bolts. Lauan plywood (7.5 mm thick, JAS Grade I) was nailed on one side of the frame with N50 common nails at intervals of 150 mm. Steel braces of 16 mm diameter were attached in vertical and horizontal frames perpendicular to the loading direction. No lateral-resisting elements were attached in the vertical frame opposite the frame sheathed with plywood. The wall panels had an opening, which was one of three different configurations, at the center of the wall. Wall system W had an opening that was 1000 mm wide and 1000 mm high, wall system D an opening with dimen-sions of 1000 mm wide and 2000 mm high, and wall system (S) had an opening that was 1000 mm wide and continued from the sill to the top beam.
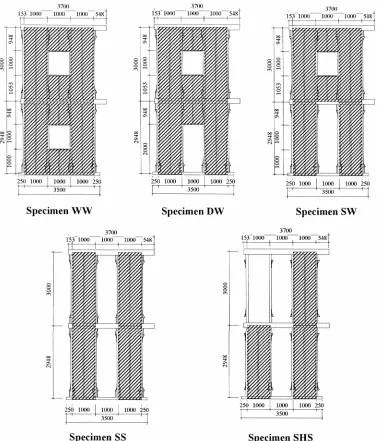
The specimens had vertical combinations of the wall sys-tems (W, D, and S) as shown in Fig. 2. Specimens WW, DW, and SW each had a wall system with a window opening (W)
on the second level, and that with an opening of window (W), door (D), and slit (S) configuration on the first level, respectively. Specimen SS had a wall system with openings of slit configuration (S) on the first and second levels. Speci-men SHS had a wall system with a slit opening (S) on the first level and a single shear wall of 1000 mm width on the second level.
Test methods
The lateral PSD “loads” were applied at the top of both the first and the second levels as shown in Fig. 1. An on-line computer system (Saginomiya ATC-20) was used for the PSD tests. A mass of 2.5 t was assumed for each level so that the first level supports a mass of 5 t in total, taking into account the wall coefficient of plywood-sheathed shear walls of 2.5. The accelerogram used for the PSD tests and dynamic analysis was the North-South (NS) components of the 1940 El Centro earthquake linearly scaled up to have a maximum acceleration of 0.4 g. Horizontal displacements of beams and sills and the vertical displacements of each post were measured by electronic transducers. The strain of the bolts connecting the hold-down bolts was also measured to obtain the tensile force at the bottom of the posts.
Dynamic analysis
Lumped mass time–history earthquake response analysis was conducted on the tested structures. The force–displace-ment relationships of the first and the second levels were modeled individually with the hysteresis model as shown in part I of this study.5
The average values of parameters of wall systems W, D, and S for C4 to C9 (C4= 0.221, C5= 0.599,
Fig. 1. Overall representation of
C6= 0.123, C7= 0.319, C8= 0.0281, C9= 0.823) were used for
all wall systems regardless of the configuration to simplify the simulation. This procedure simplifies the modeling of more complicated structures composed of the same types of wall systems. For the parameters P0, C1, C2, and C3, the same
values as the corresponding wall systems were used except for the wall system of the second level of the specimen SHS. The parameters P0, C1, C2, and C3 of the wall system (S)
were divided by two for those of the wall system of the second level of the specimen SHS, while the other param-eters C4 to C9 were kept the same as those of the other wall
systems.
Results and discussion
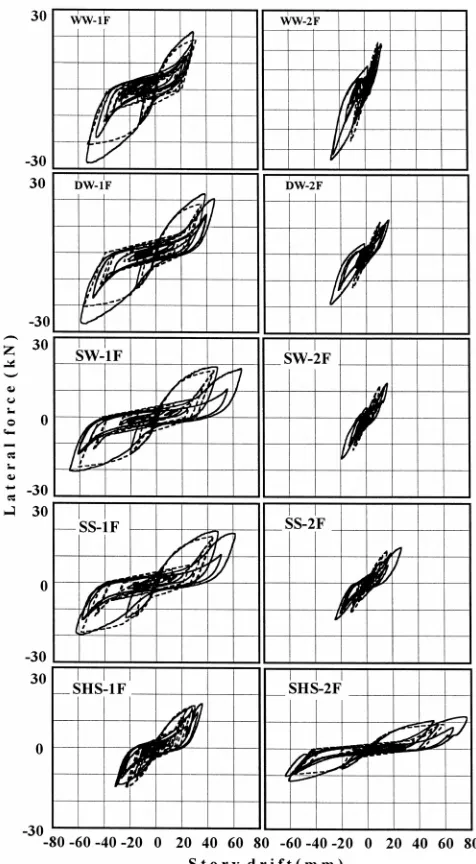
Figure 3 shows the comparison of the simulated time– history displacement response at the top of the first and second levels with the experimental results. Figure 4 shows the comparison of the simulated lateral force–displacement relationships at the first and second levels with the experi-mental results. The simulated maximum displacement re-sponses are also compared with the experimental results in Table 1. The parenthetic values under the responses in the table are the time occurrences of the maximum displace-ments in seconds. These results show that the simulated displacement responses of the first level agreed quite well with the experimental results, while the simulated responses of the second level were approximately 50% smaller than the experimental results except for specimen SHS. This is probably because the displacement responses of the second Fig. 2. Configurations of
Fig. 3. Comparison of the
simu-lated time–history displacement responses in the first (1F) and second levels (2F) with the ex-perimental results. Solid lines, experimental results; broken lines, simulation. See text for definition of specimen types
level were much smaller than those of the first level except for SHS and the influence of the slips at the hold-down connections connecting the upper posts of the second level and lower posts of the first level is not negligible. In speci-men SHS, as the lateral force was concentrated on the second level because of the low stiffness, the effect of the slips at the connections between the first and second levels may be negligible. The time occurrences of the maximum displacements were almost the same between the experi-ments and the simulation except for the second level of specimen SHS.
Figure 5 shows the ratio of the maximum displacement responses of the first level (D1) of two-level structures to
those of the corresponding wall system (D0) with the same
configuration presented in part I of this study.5
Fig. 4. Comparison of the simulated force–displacement relationships
in the first and second levels with the experimental results. Solid lines, experimental results; broken lines, simulation
Table 1. Maximum displacement response of the first and the second levels
Specimen Maximum displacement response of Maximum displacement response of
the first level (mm) the second level (mm)
Experiment Simulation Ratio Experiment Simulation Ratio
WW 53.95 53.39 1.01 27.23 11.53 2.36
(2.21) (2.24) (2.24) (2.24)
DW 58.88 56.58 1.04 28.57 11.16 2.56
(2.22) (2.24) (2.26) (2.24)
SW 68.03 61.17 1.11 19.47 10.59 1.84
(2.29) (2.28) (2.26) (2.26)
SS 62.70 58.73 1.07 -26.71 -16.09 1.66
(2.28) (2.28) (2.83) (2.82)
SHS -35.52 -28.44 1.25 -76.58 60.06 1.28
(2.92) (2.94) (2.84) (2.34)
Parenthetic values are the time occurrences of the maximum displacements (s)
Fig. 5. Ratio of the maximum displacement responses of the first
level of two-level structures (D1) to those of the corresponding wall system with the same configuration (D0) in pseudodynamic tests and simulation
The response of the first level of specimen SHS was much smaller than that of wall system S. This means that the PSD tests of the individual wall system may give a conservative estimate of the response of the first level if the stiffness and strength of the second level are small.
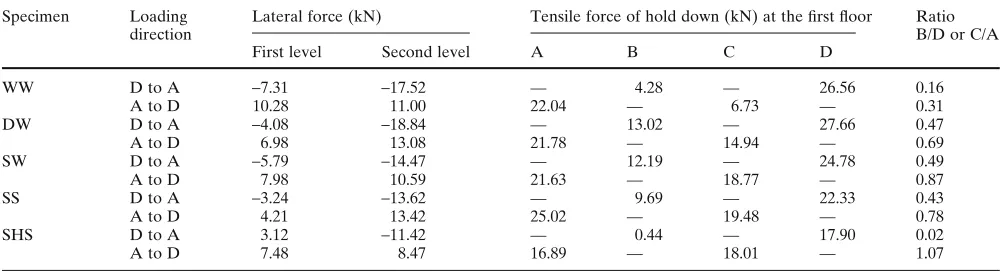
speci-men SHS, the tensile force of post B was somehow very small in the positive loading direction (D to A) and that of post C was very large (107% of post A) in the negative loading direction (A to D). This is because the tensile force of the post of the second level was transmitted to the post of the first level with the hold-down connections connecting the foot of the posts of the second level to the top of those on the first level.
Conclusions
The following conclusions were made from the experimen-tal and analytical studies:
1. PSD tests of an individual wall system with the mass supported by that particular wall generally show conser-vative estimates of the response. It is supposed that this method is appropriate to evaluate the seismic perfor-mance of the shear walls of the first level, which is the most critical during the earthquake.
2. The simulation by lumped mass time–history earthquake response analysis using the hysteresis model and the pa-rameters shown in part I of this study5
predicted quite well the response of the first level, but tended to under-estimate the response of the second level. Further stud-ies may be necessary to predict the seismic response of entire structures, considering such local deformation as the connection between the first and the second levels.7
3. The tensile forces were concentrated on the corner post near the loading points and showed similar values within the range of 22 to 28 kN regardless of the opening configuration, except for specimen SHS. The tensile
force of the third posts (C or B) varied from 4 to 19 kN according to the different opening configuration. Because the effects of reducing the tensile force of the joints at the foot of inner posts are negligible, they should be considered in the design of joints connecting the posts to the sill.8
Acknowledgments The research was supported by Grants-in-Aid for
Scientific Research “Category C” of Monbu Kagakusho and Japan Society for the Promotion of Science (JSPS).
References
1. Shing PB, Nakashima M, Bursi OS (1996) Application of pseudodynamic test method to structural research. Earthquake Spectra 12:29–56
2. Kamiya F, Sugimoto K, Mii N (1996) Pseudo dynamic test of sheathed wood walls. In: Proceedings of the 1996 IWEC, New Orleans, USA, Omnipress, Madison, vol 2, pp 2.187–2.194 3. Kawai N (1998) Pseudo-dynamic test on shear walls. In: Proceedings
of the 1998 WCTE, Montreux, Switzerland, Press Polytechniques et Universitaires Romandes, pp 412–419
4. Yasumura M (2001) Evaluation of damping capacity of timber structures for seismic design. In: Proceedings of the 34th CIB-W18, Venice, Italy, paper 34-15-3, pp 1–9
5. Yasumura M, Yasui S (2006) Pseudodynamic tests and earthquake response analysis of timber structures I: plywood-sheathed conven-tional wooden walls with opening. J Wood Sci DOI 10.1007/s10086-005-0728-5
6. HOWTEC (2003) Standard for mechanical joints (Z-mark connec-tors) (in Japanese), Housing and Wood Technical Center of Japan, Tokyo
7. Richard N, Yasumura M, Davenne L (2003) Prediction of seismic behavior of wood-framed shear walls with openings by pseudo-dynamic test and FE model. J Wood Sci 49:145–151
8. Andreason S, Yasumura M, Daudeville L (2002) Sensitivity study of the finite element model for wood-framed shear walls. J Wood Sci 48:171–178
Table 2. Tensile force of the hold-down connections at the foot of the posts of the first level for the maximum horizontal displacement at the top
of the specimens
Specimen Loading Lateral force (kN) Tensile force of hold down (kN) at the first floor Ratio direction
First level Second level A B C D
B/D or C/A
WW D to A -7.31 -17.52 — 4.28 — 26.56 0.16
A to D 10.28 11.00 22.04 — 6.73 — 0.31
DW D to A -4.08 -18.84 — 13.02 — 27.66 0.47
A to D 6.98 13.08 21.78 — 14.94 — 0.69
SW D to A -5.79 -14.47 — 12.19 — 24.78 0.49
A to D 7.98 10.59 21.63 — 18.77 — 0.87
SS D to A -3.24 -13.62 — 9.69 — 22.33 0.43
A to D 4.21 13.42 25.02 — 19.48 — 0.78
SHS D to A 3.12 -11.42 — 0.44 — 17.90 0.02
A to D 7.48 8.47 16.89 — 18.01 — 1.07