Implications of Computerised
Prescribing in Hospitals in the UK
A Thesis submitted for the degree o f M aster o f Philosophy Faculty o f Pharmacy
School o f Pharmacy University o f London
ProQuest Number: U063719
All rights reserved
INFORMATION TO ALL USERS
The quality of this reproduction is dependent upon the quality of the copy submitted. In the unlikely event that the author did not send a complete manuscript and there are missing pages, these will be noted. Also, if material had to be removed,
a note will indicate the deletion.
uest.
ProQuest U063719
Published by ProQuest LLC(2016). Copyright of the Dissertation is held by the Author. All rights reserved.
This work is protected against unauthorized copying under Title 17, United States Code. Microform Edition © ProQuest LLC.
ProQuest LLC
789 East Eisenhower Parkway P.O. Box 1346
Abstract
In a computerised prescribing system (CPS), doctors would
prescribe on computer terminals on wards and outpatient
departments. The prescribing information would be
transmitted electronically to the pharmacy department.
The introduction of CPS to hospitals in the UK will
change the current practices of prescribing, dispensing,
drug administration and the pharmacy profession
significantly.
This thesis looks at the potential advantages and
disadvantages of CPS and how CPS may fit into the current
health services information requirement. It describes
observations made at four hospital pharmacy departments in the USA. It was found that prescribers' support was
vital for the success of CPS.
Structured face to face interviews were conducted with 3 9
doctors at two London hospitals to examine doctors'
attitudes towards CPS. Most of the interviewees had not
heard about C P S . Their main concerns were system
reliability and the time that might take to prescribe on
computer terminals.
Computers are used in hospital pharmacies for labelling
individual patient medication. Since the labelling
prescribing system, the time taken to produce a label for
dispensing gives an idea of prescribing time for a text-
input prescribing system.
Labelling time was measured by direct observation at four
combinations of London hospitals and computer systems.
The time to produce 2167 labels was measured and 59
operators were observed. There were significant
differences in the average labelling time between the
studied hospitals/systems (16.6 to 39.3 seconds); with a
general trend that labelling time decreased with
increasing operator experience. This would have an
important training implication on CPS, especially for
locums and junior doctors.
The thesis concluded that CPS could potentially offer
many advantages to its users. However its success will
depend critically on the software design and the method
Acknowledgements
There are many people without whose help and support this thesis would never get finished.
I am most grateful to Mr Alan Willson for enabling this thesis to happen; Professor Nick Barber, my supervisor, for his patience, constant support, guidance and
encouragement.
I would like to thank the staff at the Hammersmith
hospital, London, especially Ms Ann Jacklin and the Drug Information department, for their help and support.
I would like to acknowledge the North West Thames Region for funding my visits to the four US hospitals, the
Regional Drug Information department for helping me with the literature search. Dr Felicity Smith and Peter Clark for their advice on interview schedules and statistical matters respectively. I would also like to thank all the staff who have participated in the two studies at the five hospitals.
List of Contents
CHAPTER 1 I N T R O D U C T I O N... 16
1.1 History of current standard UK drug charts 16
1.2 Potential problems in the current
prescribing process ... 19
1.2.1 L e g i b i l i t y ... 19
1.2.2 Completeness and accuracy of
prescriptions ... 19
1.2.3 Transcription errors ... 20
1.2.4 Availability of information at point
of p r e s c r i b i n g ... 21
1.2.4.1 Drug and cost information . . . . 21
1.2.4.2 Laboratory r e s u l t s ... 21
1.2.4. 3 Prescribing protocols , policies
and g u i d e l i n e s ... 22
1.2.5 Lag time between prescribing and drug
administration ... 23
1.2.6 Timeliness and accuracy of discharge
l e t t e r ... 24
1.3 Initiatives by p h a r m a c y ... 25
1.3.1 Formularies and prescribing
g u i d e l i n e s ... 25
1.3.2 Drug use review (DUR) ... 26
1.3.3 Clinical pharmacy ... 27
1.4 Current development of pharmacy computer
s y s t e m s ... 2 9
1.5 Health Service Computing ... 30
1.5.1 Resource management ... 31
1. 5.1.1 B a c k g r o u n d ... 31
1.5.1.2 Information implication of
resource management ... 33
1.5.1.3 Implications for pharmacy . . . . 34
1.5.1.4 Methods investigated under RM . 35
1.5.1.5 Other developments ... 37
1.5.1.6 Brunei report ... 3 8
1.5.2 Medical a u d i t ... 3 9
1.5.2.1 The role of pharmacy in medical
a u d i t ... 41
1.5. 2.2 Information Technology need of
a u d i t ... 43
1.5.3 Internal M a r k e t ... 43
1.5.4 Common Basic Specification (CBS) . . . 45
1.6 Advantages and disadvantages of
computerised prescribing ... 49
1.6.1 A d v a n t a g e s ... 4 9
1.6.2 Potential disadvantages ... 55
1.6.3 Computerised prescribing in general
CHAPTER 2 PHARMACY COMPUTER SYSTEMS IN THE USA . 63
2.1 Background to v i s i t s ... 63
2.2 O b s e r v a t i o n s ... 66
2.2.1 P r e s c r i b i n g ... 68
2.2.2 Treatment protocols ... 70
2.2.3 Prescribing review ... 70
2.2.4 Discharge summary ... 71
2.2.5 Transfer of prescription information to p h a r m a c y ... 71
2.2.6 Resource management and private patient costing ... 72
2.3 D i s c u s s i o n ... 73
2.4 C o n c l u s i o n ... 75
CHAPTER 3 DOCTORS' ATTITUDES TO COMPUTERISED PRESCRIBING SYSTEMS ... 77
3.1 I n t r o d u c t i o n ... 77
3.2 Aims and objectives of s t u d y ... 78
3.3 Study D e s i g n ... 79
3.3.1 S u b j e c t s ... 79
3.3.2 Analysis of R e s u l t s ... 82
3.4 R e s u l t s ... 82
3.4.1 Computing experience ... 84
3.4.2 Expectations and c o n c e r n s ... 84
3.4.3 Would there be any legal implications in C P S ? ... 87
3.4.4 Would CPS affect workload? ... 87
3.4.5 What information should be available on screen to aid prescribing? . . . . 88
3.4.6 Would CPS affect patients, doctor- patient relationship or relationship with other departments? ... 88
3.4.7 Practical aspects of C P S ... 90
3.4.8 Rating s c a l e ... 92
3.5 D i s c u s s i o n ... 92
CHAPTER 4 STUDY ON TIME TAKEN TO PRODUCE COMPUTER LABELS FOR DISPENSING . . . . 98
4.1 I n t r o d u c t i o n ... 98
4.2 M e t h o d s ... 101
4.2.1 Statistical Methods ... 104
4.3 R e s u l t s ... 106
4.3.1 Effect of e x p e r i e n c e ...109
4.3.2 Effect of i n t e r r u p t i o n s ... 109
4.3.3 Differences between hospitals/systems 118
4.3.4 Number of keystrokes to produce
standard labels ... 121
4.3.5 Total time spent and annual cost . . . 125
4.4 D i s c u s s i o n ... 127
4.4.1 Sites with same s y s t e m ... 127
4.4.2 Sites with different system ... 128
4.4.3 Effect of interruptions and
e x p e r i e n c e ... 13 0
4.4.4 Implications for computerised
prescribing system ... 132
CHAPTER 5 DISCUSSION ... 13 5
R E F E R E N C E S... 149
PUBLICATIONS RESULTING FROM THE THESIS ... 175
APPENDIX 1 Interview schedule to assess doctors'
attitudes towards computerised
prescribing system ... 176
APPENDIX 2 Rating scale to assess doctors'
attitudes towards computerised
List of Tables
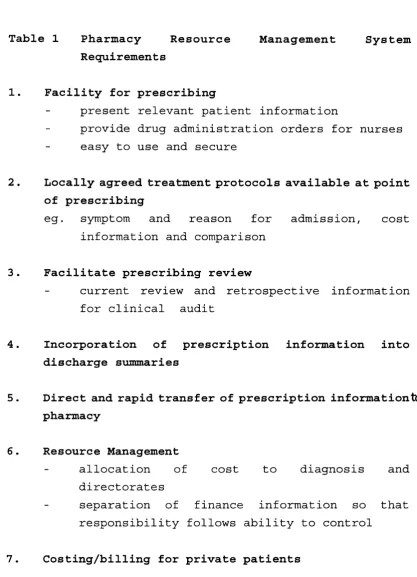
Table 1 Pharmacy Resource Management System
Requirements ... 64
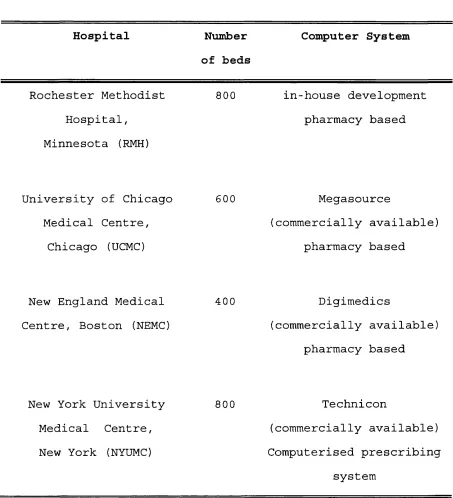
Table 2 The four US hospitals visited ... 67
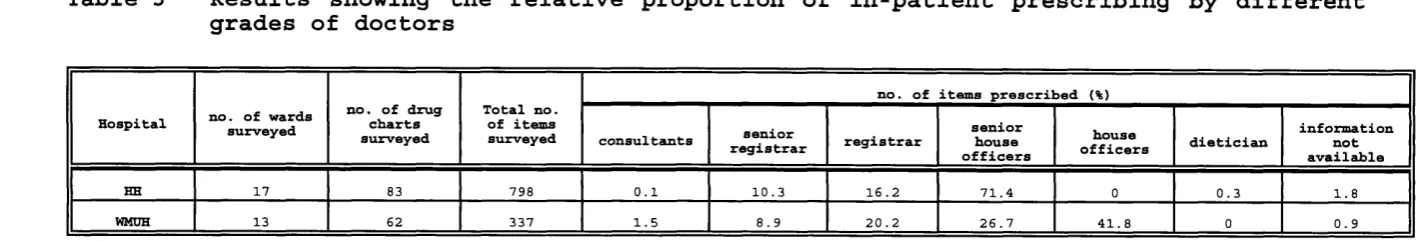
Table 3 Results showing the relative proportion of
in-patient prescribing by different grades
of d o c t o r s ... 80
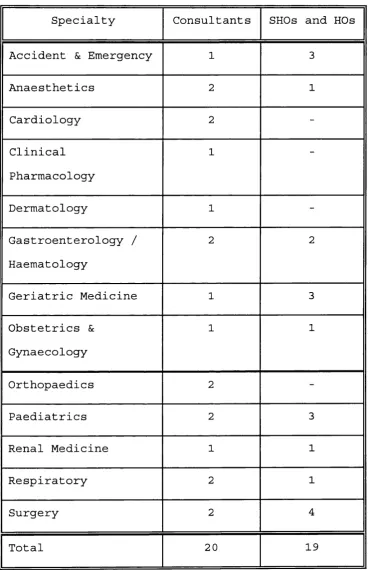
Table 4 Specialties of doctors interviewed . . . 83
Table 5 Potential advantages of C P S ... 85
Table 6 Potential disadvantages of C P S ... 86
Table 7 Information suggested for display
in CPS 89
Table 8 Results of doctors' rating scale . . . . 93
Table 9 Information required for prescribing and for
labelling ... 100
Table 10 Analysis of variance r e s u l t s ... 108
Table 11 Mean labelling time, analysed by
hospital/system, experience, types of
labels, interruptions and names . . . . 110
Table 12 Number of labels produced by staff of
different experiences at different sites 114
Table 13 Effect of interruptions on labelling time 117
Table 14 Interruptions analysed by level of
operator experience ... 119
Table 15 Labelling time - analysis by
experience and interruptions ... 120
Table 16 Labelling time - analysis by type of
prescription by hospital/system ... 122
Table 17 Number of keystrokes required to
produce four standard labels ... 124
Table 18 Estimated time and cost of labelling
per year ... 126
List of Figures
Figure 1 Current prescribing, dispensing, drug
administration process ... 18
Figure 2 CBS data model showing the general
relationship between a patient, what is
prescribed to treat the patient and who
is responsible for the prescribing. . . 47
Figure 3 Comparison of computerised prescribing
with conventional prescribing-dispensing
process 50
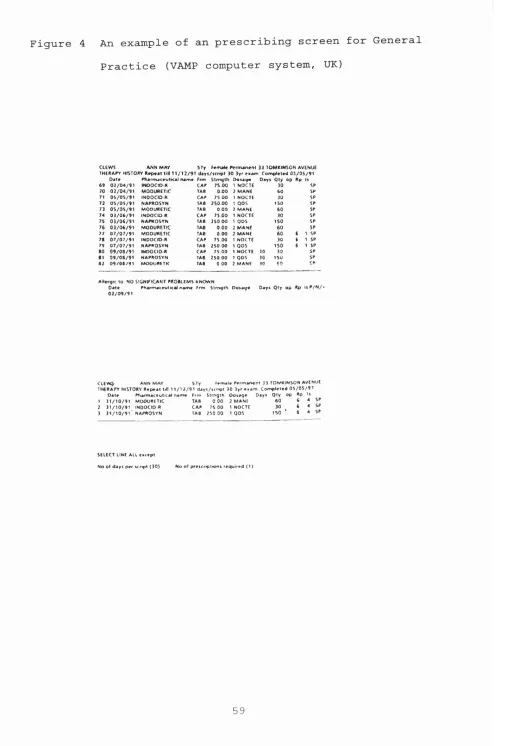
Figure 4 An example of an prescribing screen for
General Practice (VAMP computer
system, UK)... ... 59
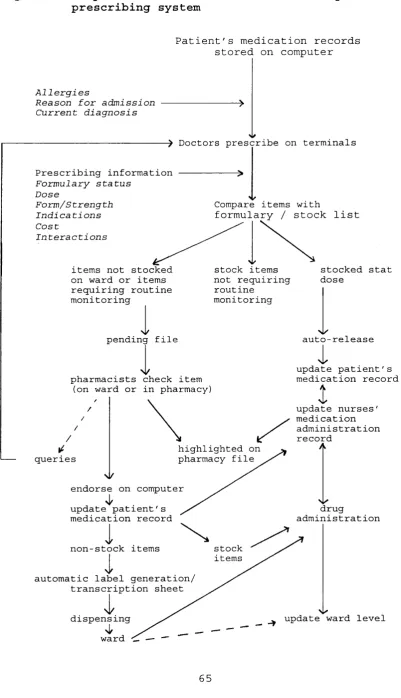
Figure 5 Proposed core features of a computerised
prescribing system ... 65
Figure 6 Standard prescriptions used for assessing
number of keystrokes required for
labelling... ... 105
Figure 7 Effects of hospital and system on
labelling time with 95% confidence
intervals... ... Ill
Figure 8 Effects of experience on labelling time
with 95% confidence i n t e r v a l s ... 112
Figure 9 Effects of interruptions, type of
prescriptions and typing of names on
labelling time with 95% confidence
intervals ... 113
Figure 10 Effects of experience and interruptions
on labelling time with 95% confidence
intervals ... 115
Figure 11 Relationships between typing of names,
interruptions and labelling time with 95%
confidence intervals ... 116
Figure 12 Relationships of hospital/system, type of prescriptions and labelling time with 95%
confidence intervals ... 123
Abbreviations
ANOVA Analysis of Variance
CBS Common Basic Specification
CPS Computerised Prescribing System
CX Charing Cross hospital, London
DoH Department of Health
DRG Diagnosis Related Groups
DUR Drug Use Review
GP General Practitioner
HH Hammersmith hospital, London
HIS Hospital Information System
HO House Officer
IMG Information Management Centre
IMIS Integrated Medical Information System
IP In-patient
ICU Intensive Care Unit
IV Intravenous
MAR Medication Administration Record
NEMC New England Medical Centre, Boston
NET North East Thames Regional System
NHS National Health Service
NYUMC New York University Medical Centre, New York
OP Out-patient
PAS Patient Administration System
RM Resource Management
RMH Rochester Methodist Hospital, Minnesota
SHA Special Health Authority
SHO
SM
TDS
TPN
TTO
UCH
UCMC
UDD
WMUH
Senior House Officer
St. Mary's hospital, London
Technicon Data Systems
Total Parenteral Nutrition
discharge medicine to take out
University College hospital
University of Chicago Medical Centre, Chicago
Unit dose drug distribution system
West Middlesex University hospital, London
CHAPTER 1
INTRODUCTION
In a fully computerised prescribing system (CPS), doctors
would prescribe on computer terminals placed on wards and
out-patient departments in the hospital. The prescribing
information would be passed on electronically to the
pharmacy department. The resultant prescription would
exist as a computer file which could be accessed by any
authorised user through terminals in the hospital and
possibly in the community.
CPS has been available in the USA for nearly twenty years
and is now being introduced and developed in the UK. Such
a system will substantially change the traditional
prescribing process and the ways in which pharmacy is practised. Its success will depend greatly on users'
acceptance of the system. In order to consider the
implications of CPS in hospitals in the UK, it is first necessary to understand the current prescribing process
and some of its potential problems.
1.1 History of current standard UK drug charts
In the early 1960s the in-patient drug chart was a
written order from doctors to nurses for administration
of drugs to patients. When a drug was not available on
the ward, the doctor's order was taken physically to
pharmacy for supply and might be left in the pharmacy for
some time. In order to administer drugs meanwhile, nurses
would transcribe a daily "medicine list". These lists
were a prime source of drug administration error (Vere,
1965; Crooks et al, 1965; Calder, 1965). To overcome
this, the drug chart was redesigned (Aberdeen General
Hospitals, Pharmaceutical Services Committee, 1967) and
pharmacists started to visit wards daily so that drug
charts would be able to stay on wards (Baker, 1967;
Calder and Barnett, 1967; Hill and Wigmore, 1967). The
prescription chart, together with the patient's
appearance and surroundings, end-of-bed charts and case
notes, supply the basic information for drug monitoring
by clinical pharmacists (Batty and Barber, 1991).
The drug chart is collectively used by doctors to
prescribe drugs, nurses to record their administration and pharmacists to supply them, to clarify instructions
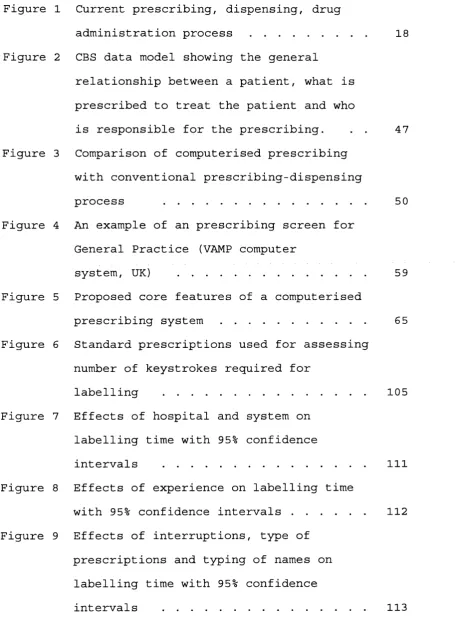
and to monitor therapies. A simplified flow diagram of
the current prescribing and drug administration process
is shown in figure 1. The drug chart usually bears the
following information:
Patient details - patient's name, age and sex
location drug allergy
Medication details - drug name
dose
route
frequency of administration
Figure 1 Current prescribing,
administration process
dispensing. drug
PRESCRIBING DOCTORS prescribe on drug charts
DRUG MONITORING & SUPPLY
DISPENSING
ADMINISTRATION
PHARMACISTS visit wards, screen drug charts, transcribe non-stocked drugs onto transcription sheet
Information of drugs entered into pharmacy computer
Label production
Dispensing and checking
Drugs taken to wards
NURSES administer drugs to patients
duration of medication
signature of prescriber
Nurses administer medications according to the
instructions in the prescription chart, usually at fixed
'them
drug rounds, and record on the chart. Any missed
doses, which may be due to refusal by patient, drug
unavailable on ward, patient "nil by mouth" or presence
of side effects, are also recorded together with the
reason. This information may be useful in monitoring the â
supply function of^pharmacy or the appropriateness of a
fo r
patient's current therapy. However, the reason pf missed
doses may not always be recorded.
1.2 Potential problems in the current prescribing
process
1.2.1 Legibility
One of the main problem of a written medication order is
illegibility. This is not uncommon and is potentially
dangerous (Shaw, 1991; Kurth et al, 1990) and may be
fatal (Faber et al, 1991). Doses may also be missed while
nurses try to ascertain the intended drug.
1.2.2 Completeness and accuracy of prescriptions
In a study by Jenkins et al (1993) it was found that for
regular prescriptions, 71% of oral and intravenous
antibiotic prescription entries were without any
specification of valid period and, depending on the type
of prescription, between 12% and 32% of entries were not
prescribed by approved names while 4 to 10% were
illegible or ambiguous. In some of the entries,
information such as dose and frequency had been omitted or the route of administration was ambiguous. In another
study carried out by a research group in the North West
Thames region, 3,273 patient specific drug related
potential problems were identified. Of these, 29% were
related to dose or frequency; 14% related to
administration, formulation or route; 9% of prescriptions
were illegal, illegible or incomplete and 5% had
interaction or incompatibility (Batty and Barber, 1992).
1.2.3 Transcription errors
Since a drug chart has limited space, doctors usually
have to rewrite charts every two to four weeks. It might
be argued that this provides a chance for doctors to
review the patient's medication and also to identify existing errors or ambiguities; but very often, doctors
simply transcribe the previous drug regimes to the new
chart. This transcription itself may be a source of error: treatment may be left out, doses or frequency of
drugs may be altered unintentionally. This problem is
particularly seen on discharge medication. In a study
carried out by Batty and Barber (1992), 10% (339) of the
prescription monitoring incidents identified were related
to discharge medications.
1.2.4 Availability of information at point of
prescribing
1.2.4.1 Drug and cost information
Over the past 2 0 years, the information on new drugs has
increased tremendously. It is difficult for doctors to
keep up with all the prescribing information and to
decide what is the best choice of therapy for their
patients. Inadequate knowledge and confused motives may
result in inappropriate prescribing (Editorial, 1978;
Spector and Roberts, 1983). In this cost conscious
environment, the cost-effectiveness of a drug has to be
taken into consideration; yet this cost information is
not easily available. Doctors may get information about new drugs from the pharmaceutical industry through the
drug representatives. However information obtained this
way may be biased and may not coincide with the local
prescribing policy.
1.2.4.2 Laboratory results
Patients' laboratory data play an important role in the
choice and monitoring of drug therapies. Results are
traditionally printed on paper and suffer from many
drawbacks. They are easily lost, may take a long time to
reach the patient's notes and can only be in one place at
a time. This may cause delay in initiating effective and
appropriate therapies or changing inappropriate ones, and
may subsequently prolong patients' stays in hospitals
(Browne et al, 1987). An example would be that "blind"
treatments with antibiotics may not be followed up when
the microbiological information becomes available (Volger
et al, 1988).
In some hospitals in the UK and many in the USA, on-line
laboratory results are presented on computer terminals
and can be simultaneously viewed by physicians,
pharmacists and other health workers in different places (Moore et al, 1984; Dotson, 1986; Larson and Blake, 1988;
Bleich et al, 1985; Faulkner et al, 1987). This increases
the timely and effective use of such information and
should lead to improved patient care. However these
results are not usually linked on-screen to the patient's
drug treatment.
1.2.4.3 Prescribing protocols , policies and guidelines
Prescribing policies and protocols are widely used in the
choice of anti-microbial agents and in therapies where a
is
combination of drugs are used, such as in the treatment
of cancer and in bone marrow transplantation. With the
relatively rapid turnover of junior medical staff, who
are responsible for most of the prescribing, these
guidelines might not be followed. Periodic re-education
and follow-up monitoring are necessary to reinforce
policies (Volger et al, 1988). An effective way to
communicate this information to prescribers, and to feed
back to consultants any deviation through an audit cycle,
would help to standardise treatment.
1.2.5 Lag time between prescribing and drug
administration
In the UK, the majority of in-patient medication is
supplied as ward stock items. Drugs that are expensive or
less often used on the ward are usually individually
dispensed. Orders for the latter are picked up by
pharmacists visiting the ward, the frequency of visits varying from once a week to once or twice a day. If a new
drug is prescribed between the pharmacist's visits, a
nurse may still need to take the drug chart to pharmacy
for supply, causing the drug chart to be temporarily
unavailable on the ward and wasting valuable nursing
time. Alternatively, the nurse may wait for the
pharmacist's ne#t visit; this may cause a delay in
treatment and may subsequently increase length of bed
stay. There has not been any large study on missed dose
due to this problem and so its significance cannot be evaluated. However Ridge (personal communication) and
Dean (1993) had estimated that about 1.2 to 1.5 percent
of all drugs that should be administered on drug rounds
could not be given because they were unavailable on the w ards.
1.2.6 Timeliness and accuracy of discharge letter
When patients are discharged from hospitals, they often
need to be followed up by their general practitioners
(GPs). Information about a patient's hospital stays is
essential to the GP for the continuation of care. In the
UK a discharge letter is usually issued at the time of
patient discharge, followed by a more detailed discharge
summary. The discharge letter may be posted to the GPs
directly or patients be asked to take them to their GPs. Various studies (Penney, 1988; Mageean, 1986) have shown
that there were usually considerable delays before either
form of information reached the GPs and in some cases
there was no communication at all. Mageean (1986) found
that the content of the communications was variable and
important information such as diagnosis and treatment were not always stated. When a discharge note which
doubled as a prescription for discharge medicines was
used, it took less time to reach the GPs (Kendrick and Hindmarsh, 1989). This was probably because doctors had
to prescribe the discharge medication before the patient
left the hospital.
1.3 Initiatives by pharmacy
1.3.1 Formularies and prescribing guidelines
In order to rationalise prescribing and to control drug
expenditure, many hospitals have developed local
guidelines on prescribing or a list of drugs available
locally, known as the formulary. The question of
prescribing freedom has been raised (Editorial, 1978;
Bolt, 1984; O'Dowd and Wilson, 1991) but with the recent
changes in clinical management structure and the
devolvement of clinical budgets, clinicians generally now
accept that formularies are an effective way of
controlling drug costs. This is further supported by the
Department of Health. The health circular 'The Way
Forward for Hospital Pharmaceutical Services' (Department
of Health, 1988) stated that 'experience has demonstrated
that an effective way in which cost containment of
expenditure on medicines can be achieved is through the
implementation of formulary management systems'. Many
hospitals have reported successes with the use of
etal
,formularies (Baker et al, 1988; Lewis* 1989). However 6S
these succès^ may be short-lived unless accompanied by
continuous education and peer review (Feely et al, 1990)
and constant policing by pharmacy staff.
There is evidence that by incorporating a formulary into
a computerised prescribing process the formulary may be followed more closely. At the Medical College of Virginia
Hospitals USA, when doctors called up the menu to
prescribe, drugs in the formulary were presented first
(Schroeder and Pierpaoli, 1986). The selection of a non
formulary drug took longer. Screens describing various
protocols developed jointly by the infectious diseases
division and the pharmacy and therapeutics committee were
also available. The authors reported that in an informal
study, it was shown that after the computer system was
implemented, dosing protocols were followed more often
and there was a decrease in the rate of non-formulary
drug requests.
1.3.2 Drug use review (DUR)
Another method of rationalising drug treatment is by DUR.
Pharmacists have been actively involved in DUR and have
shown successes in reducing drug costs. There are two
aspects of drug usage addressed by DUR: quantitative and qualitative. The quantitative arm is concerned about how
often, how much and where a drug is used. This
information may be obtained from purchasing information
or from drug issues data. Most pharmacy systems can
provide sophisticated quantitative information (Simpson,
1987; Jacklin and Willson, 1991).
The qualitative aspect concerns how and why a drug is
used. For this, drug use data must be linked to diagnosis and possibly laboratory results to provide meaningful
information. The manual collection of this information is
tedious and very time consuming. With computerised prescribing, this would be easily achieved.
1.3.3 Clinical pharmacy
One of the aims of clinical pharmacists is to promote the
safe, effective and economic use of medicine while
maintaining quality of life for the patients (Department
of Health, 1988; Barber, 1991). Prescription monitoring
is one of the principal ways to achieve this.
The incorrect prescribing of drugs is common and may lead
to adverse drug reactions. In a study of the nature of adverse events of hospitalized patients, drug
complications were the most common type of adverse events
(19%); of these, 18% were preventable (Leape et al,
1991). Prescribing errors can be prevented by
pharmacists, as is reported in several studies (Batty and Barber, 1992; Eadon, 1992; Folli et al, 1987; Hawkey et
al, 1990) .
The role played by pharmacists in the UK has usually been
a reactive one. Most interventions are made after an error is committed by prescribers. However, the role of
pharmacists is changing. With the ever-increasing
information about new drugs and a constraint on resources, pharmacists as drug experts can provide
valuable advice on the selection of drug treatment. Part
of this role is already present via formularies,
prescribing guidelines and DUR. But increasingly
pharmacists may be seen attending ward rounds with
clinicians, taking part in clinical audit and teaching
junior doctors and nurses. All these duties require
substantial time from clinical pharmacists.
Prescribing errors in "take home" medicine, if not
detected, may be subsequently perpetuated by GPs when
patients are discharged. In a regional study by Batty and Barber (1992), 10% of all interventions performed by
pharmacists were related to discharge prescriptions. In a
survey by Orme et al (1990) interventions by pharmacists were necessary before 19% of discharge prescriptions
could be dispensed. Most interventions concerned either
unintentional differences between drugs prescribed for patients in hospital and on discharge or unintentional
changes in dosage regimens of medication administered.
With computerised prescribing, these sorts of errors
might disappear. Lists of discharge medications based on
patients' current regimes would be automatically
available on screen for doctors and changes intended by
prescribers would be explicitly noted. This would reduce
queries from pharmacy.
1.4 Current development of pharmacy computer
systems
To meet the increasing demand for cost and management
information, integrated pharmacy computer systems have
been developed in the UK which incorporate sophisticated
modules on purchasing and stock control (Stainton et al,
1983; Downie, 1984; Editorial, 1987; Longshaw et al, 1983), distribution and in some cases clinical
applications such as drug interaction and dosage checking
(Hudson, 1985; Darby, 1983; Jackson, 1982; Craig and
Benrimoj, 1985; Duckworth and Bailie, 1986).
Most of the pharmacy systems are designed for stock
control and costing to centres, rather than patients, and do not incorporate prescribing systems. These systems
record issues of stock items and makes order compilation
easier by printing picking lists and packing notes.
Costing information is collected at ward or departmental level. In such a distribution system, ward pharmacists
are substantially relieved of the drug supply and manual
information collection functions and can concentrate on
clinical activities. Most such departmental pharmacy
systems have been designed specifically for pharmacy
practice and the cost of system implementation and staff
training is relatively low. However, the current method
of drug distribution and cost capture still has several drawbacks; it is labour intensive and time consuming,
duplicates written information, involves staff moving
around the hospital and prolongs lapse times between
initial prescribing and non-stock drug supply. The
information collected is not yet patient specific and may
be inadequate for use in the NHS initiatives such as
resource management and clinical audit.
To meet the information needs of the NHS and the changing
role of pharmacists, a new generation of pharmacy
computer system is required (Rowbotham, 198 9) . A
computerised prescribing system may be expensive to
implement and maintain but it can remove problems of
and
illegibility, decrease errors of omission/\ transcription
and reduce the need to contact prescribers about trivial
errors. Up to date treatment and formulary information would be available to prescribers at time of prescribing.
Patient information such as reason for admission,
diagnosis, discharge medication and the GP's address could be stored in the computer and formatted into a
discharge letter when the patient is discharged. This
should ensure completeness and timeliness of
communication between secondary and primary care. All
these would in turn improve inter-professional
relationships as well as safety of drug treatment to
patients.
1.5 Health Service Computing
Within the past ten years, there have been several
initiatives within the NHS which required cost and
treatment information at individual patient level. These
initiatives include Resource Management (RM), medical audit and the provider-purchaser split of service. Any
development in the NHS and in health care computing would
need to comply with these initiatives. Computerised
prescribing is one of the options which provides some of
the information required.
1.5.1 Resource management
1.5.1.1 Background
Management budgeting was introduced to the NHS in 1984 as
an attempt to control the increasing expenditure in the
health services. It tried to make clinicians more
responsible for the resources they use by allocating budgets to a clinical specialty rather than by function
(Editorial, 1985). However management budgeting was not
successful as there was a lack of involvement of
clinicians in the management structure and the level of
reporting was too superficial ('Clinicus', 1985; Kerr,
1988). A way to relate hospital events to individual
patients would be necessary before clinicians could
effectively allocate their resources.
In 1986, management budgeting was revised and re
introduced as Resource Management (RM) which was a drive
to improve the collection of data on the cost of treating
patients with different conditions (Purkiss, 1991). The
aim of Resource Management is to enable the NHS ^to give
a better service to its patients, by helping clinicians and other managers to make better informed judgments
about how the resources they control can be used to the
maximum effect' (Department of Health and Social
Security, 1986). This necessitates a change in the NHS
management culture and mechanisms to cost all treatment
and services to individual patient level where feasible.
Six pilot sites were initially chosen by the Department
of Health in late 1986 to look at different approaches
towards RM. These were: Royal Hampshire County hospital
in Winchester (Hewett, 1989), Guy's hospital in London
(Rea, 1989), Pilgrim hospital in South Lincolnshire (North, 1990), Arrowe Park hospital in Wirral (Bagnall,
1989), Royal Infirmary in Huddersfield and Freeman
hospital in Newcastle upon Tyne (Canning, 1989) .
Learning from the lessons of management budgeting and
following the recommendation of the Griffiths report (NHS
Management Inquiry, 1983), clinicians were actively
involved in the RM. The first, and probably most popular
management model, was that of the formation of clinical
directorates, first developed in the UK at Guy's
hospital, London. In this model, clinical services in
acute hospitals are divided into directorates (e.g
Haematology, Neurology, Paediatric Medicine), each
responsible for the management of their own services and
controlling a substantial proportion of their own
expenditure, including the cost of drug treatment (Rea, 198 9; Horne, 1991).
1.5.1.2 Information implication of resource management
Information technology has been widely employed in the
NHS to provide the data required by RM. The information
core of RM is the "case mix management system". The
system contains a patient-specific database linking all
the events, including cost of treatment, for each patient
with a diagnosis code (Rea, 1989), The use of various
coding frames such as diagnosis related groups (DRG)
(Catterall, 1988; Benson, 1990; McKee, 1990) and Read
codes (Chisholm, 1990; Radford and Wallace, 1990) is still being explored. The pilot sites had either
developed their own feeder systems, each of which was
able to transfer data to the case mix database, or had
developed an integrated operational system with a network of terminals in wards and departments, which had a single
interface with the case-mix database. By providing
detailed information on each patient and comparing this
against a standard profile of care for that type of
patient, clinicians hope to review their own use of
resources and have a basis of discussion with their
p e e r s .
1.5.1.3 Implications for pharmacy
To contribute to resource management, pharmacy
departments needed to provide clinicians with information
about the cost of drug treatment down to individual
patient level (Ashford, 1991; Rowbotham, 1989). This
posed a particular challenge for pharmacy departments in
the UK. Traditionally, the bulk of in-patient drugs are
issued to wards as stock items and cannot be costed to
individual patients. New methods to capture cost of drug
treatment at patient level are necessary. The number of
bed days occupied by patients had been used to apportion
ward stock costs to different consultants. However, a
study by Miller and Ashford (1988) suggested that this method is inaccurate. An alternative would be to dispense
individual patient medication with no or very few ward
stock items. In such a system, the medication may be
dispensed as multiple doses or as a unit dose.
Unit dose dispensing is widely employed in the USA to reduce medication errors and because of the need to
charge patients for the drug treatment (Schwartau and
Sturdavant, 1961; Simborg and Derewicz, 1975; Barker and
McConnell, 1962; Appleby et al, 1983; Lee et al, 1992).
An automated computer-driven unit dose distribution
system has also been installed and reported at two UK
hospitals, Hope and Watford General (Clark et al, 1990;
Editorial, 1989). Although cost capture by dispensing
individual patient medication, either by multiple doses
or unit doses, may overcome the problem of costing stock
items, this method has not been considered as a solution
for RM because it is very labour intensive and requires
extensive support by pharmacy staff, which is unlikely to
be available with the current and predicted pharmacy
manpower situation in the UK (Counsell et al, 1981;
Barber et al, 1992).
1.5.1.4 Methods investigated under RM
At the six pilot RM sites, various methods of drug cost
capture had been explored (Editorial, 1990) . Three main
approaches were adopted: cost capture by computerised
prescribing, capture at time of drug administration, or
retrospective recharging from patient records.
The first option, computerised prescribing, has been
adopted at four of the six sites. The Royal Hampshire hospital and Arrowe Park hospital had installed an
American computer system called Technicon Data Systems
(TDS). TDS is an integrated hospital system which allows
doctors to prescribe and nurses to record drug
administration on computer terminals using menus and
light-pens. Computer screens replace the traditional
patient drug charts; orders raised on wards for non-stock
items and discharge drugs are printed out in the pharmacy
departments. At the Royal Hampshire hospital, attempts
are being made to link the TDS with the pharmacy
departmental system. At Arrowe Park, the system had been
criticised as unsuitable for UK practice and substantial
modification is still being made.
The Pilgrim hospital in South Lincolnshire and Guy's
hospital in London are also moving towards computerised
prescribing. The Pilgrim hospital has designed a
specification for its own system, which should offer
potential benefits for doctors, nurses, pharmacists,
patients and managers, but the system is still being
developed. At Guy's hospital an in-house developed
computerised prescribing system was being tested on a few
wards (Horne, 1991), however work has now ground to a
ha l t .
At the Freeman hospital, drug cost data was collected at
the time of drug administration. Nurses use light pens to
read bar codes into hand-held Psion organisers on drug trolleys. This information is subsequently fed into a
microcomputer (Berns et al, 1991).
Drug cost information at the Royal Infirmary in
Huddersfield is captured by pharmacy staff from drug
charts retrospectively. The data are entered into the
pharmacy computer and then downloaded into the hospital's
resource management computer system. This method does not
require costly development of new computer systems.
However it is labour intensive, poses an extra
operational step, is insensitive (Miller and Ashford,
1988, Jenkins, 1990) and offers little prescribing
information which would be useful for clinical audit.
1.5.1.5 Other developments
The development of pharmacy RM systems is not restricted
only to the six RM pilot sites. A computerised ward drug
administration system which uses bar codes for data
capture is currently under test at the Morriston hospital
in Swansea (Editorial, 1991; Fisher, 1991). In this
system, the patient, the patient's prescription chart and
the drugs in the trolley are all bar coded. Doctors
prescribe on a computer built into a drugs trolley. A bar
coded prescription is then printed out. Using a scanner, a nurse can check that patient, prescription and drug all
match up. Drug administration is then recorded on the
prescription sheet which is laid over a computer
keyboard. Pressure sensitive keys under the prescription
sheet allow the feeding of that information into the
computer.
At the Royal Brompton hospital, London, an intensive care
unit (ICU) system is being implemented (personal
communication). This system will allow recording of drug
9
administration on^flowsheet on computer screens and a
prescribing module is also being developed. At Greenwich
hospital, London, there are plans to incorporate a CPS as part of the Hospital Information System (Fames, 1989) .
Companies who currently supply dedicated hospital
pharmacy computer systems are also looking at their
feasibility.
1.5.1.6 Brunei report
The Health Economics Research Group (HERO) at Brunei
University was commissioned by the Department of Health
(DoH) in May 1988 to undertake a three year evaluation of
the costs and benefits of RM in the six acute hospitals
(Packwood et al, 1989). Its final report was published at
the beginning of 1991 (Health Economics Research Group,
1991). The evaluation exercise was found to be difficult and the report concluded that 'it was not possible to
provide a definitive assessment of RM as an ongoing
working process for hospital management.'
The research group estimated the cost of implementing RM
at the six pilot sites to range from £354,000 at Arrowe Park (where the main computer systems were still being
implemented at the end of the study) to £2.6m at Guy's.
The cost of implementation was more than double the
maximum expected by the DoH when RM was formally
announced (Robinson, 1991).
With the introduction of the latest NHS reforms, RM has
become an approved policy and is to be adopted in some
form in all NHS hospitals. RM involves changes in culture
and information technology is essential for its success.
Although no definite solution to drug cost capture has
been provided by any of the six RM pilot sites, it seems that the trend is towards the development of
computerised prescribing systems. The Brunei Report
showed that this could be an expensive exercise.
Hospitals which are going down this path must be aware of
this and should consider clearly how the undoubted
benefits are balanced against the possible cost.
1.5.2 Medical audit
In the White Paper "Working for Patients" (Secretaries of
State for Health, 1989) the Government attaches great
importance to the development of a comprehensive system
of medical audit covering both Primary Health Care and
the Hospital and Community Health Services. It aimed to
secure medical audit in all NHS hospitals, including self-governing hospitals, by April 1991.
Medical audit is defined by the DoH as 'the systematic,
critical analysis of the quality of medical care,
including the procedures used for diagnosis and
treatment, the use of resources, and the resulting
outcome and quality of life for the patient' (Department
of Health, 1989a). The term clinical audit is sometimes
used to include multidisciplinary input, such as
pharmacists and nurses. The principal aim of audit is to
improve patient care. Clinicians were to be actively
involved in the random retrospective review of case
notes, prospective collection of information on outcomes,
the application and monitoring of guidelines and the
design and introduction of computerised clinical
information system for audit. A number of guidelines have
been laid down on how audit could be set up (Ellis &
Sensky, 1991; Shaw and Costain, 1989) .
Audit is a continuous cycle, involving observing
practice, setting standards, comparing practice with standards, implementing change, and observing the new
practice. The importance of completing this feedback loop
has been emphasised (Smith, 1990; Moss and Smith, 1991; McKee et al, 1989)
In order to perform audit, information which relates to
individual patients, patient groups and patients'
demographic details would be needed. Data would be
collected by different disciplines; an integrated information system in which data are collected
operatively may improve the quality of information.
Although audit is not dependent on computerised databases
(McKee et al, 1989; Crombie and Davies, 1991), computers
can be used for storing, retrieving and correlating
information to facilitate audit activity (Hamlyn, 1991;
Allen, 1990; Department of Health, 1990a). Some of the
data and facilities required for medical audit may be
found within the case-mix system or clinical information
systems; these systems had been developed in some
hospitals to enable detailed information to be captured
and be used in medical audit (Allen, 1990; Jones, 1990) .
For audit to be successful, it is important to complete
the feedback loop. In a review by Mugford et al (1991) it
was observed that information feedback is likely to have
a more direct effect on practice if presented close to
the time of decision making. Five of the studies reviewed
by Mugford evaluated the effects of some form of online
prompt to practitioners by computerised recording or
ordering systems. The results of these studies all
suggested that concurrent reminders of costs or protocols for treatment increased compliance with agreed standards,
and on-line computers may be an effective medium for
influencing practice. This method may also be used to
monitor any deviation of prescribing from the standard agreed.
1.5.2.1 The role of pharmacy in medical audit
The monitoring of patients' drug treatment and sometimes
its outcome, has long been performed by pharmacists. This
may take the form of prescription screening by
pharmacists during ward visits and while dispensing, or
may be in the more organised setting of Drug Use Review.
In these ways the use of drug treatment on patients and
its outcome may be monitored, analysed and critically
assessed. However, in most cases, due to the lack of
explicit standards and difficulties in closing the feedback loop, such monitoring so far cannot be
considered as true audit.
Pharmacy departments can provide valuable information on
drug usage such as costs and trends of prescribing and
choice of therapy (Simpson, 1987). This information can
be used for audit. In some hospitals, pharmacy
departments are actively involved in the medical audit
etal,
process (Davies, 1989; Eccles^ 1992) and the role of
pharmacists in medical audit in hospitals has been
explored (Harris et al, 1993; Cotter et al, 1993) . The
quantity and quality of information available may be
enhanced by well-designed pharmacy computer systems. Currently drug treatment audits are mostly performed on
specific patient cases or on specific groups of drugs. In
the future it is likely that audit would be performed on patients or patient groups receiving a particular drug or
treatment regimes. This would require more extensive drug
treatment information relating to individual patients.
Such information would be difficult and time consuming to
collect manually. A computerised prescribing system which
records all drug treatment on individual patients would
be able to provide the necessary information and provide
a powerful tool for audit.
1.5.2.2 Information Technology need of audit
Medical audit is probably one of the least controversial
issues of the NHS reforms. Unlike resource management, it
does not rely directly on information technology.
However, medical audit and resource management have much
in common. The data required for both overlap
considerably and the information derived from each is
relevant to the other (Ellis and Sensky, 1991; Ellis et
al, 1990). As the volume and complexity of medical audit
activity increase, information systems will become a key tool in audit. It is important that the information needs
of medical audit are integrated into corporate
information strategies.
1.5.3 Internal Market
One of the most significant changes introduced by the white paper "Working for patients" may be the setting up
of the 'internal market', in which hospitals and District
Health Authorities are divided into purchasers and providers of healthcare (Department of Health, 1989b;
Gilby, 1991) . From April 1, 1991, services from provider
hospitals and community units may be bought by District
Health Authorities or general practitioner fund holders
through arrangement of contracts. The decision may be
based on the cost of the operation or the size of waiting
list. Providers would need to set prices for the services
they provide and set up contracts with buyers.
There are mainly three types of contracts. The first one
is the "block contract" which states that a provider will
make available a certain facility at a given price. This
is the easiest method but providers carry much of the
risk if demand exceeds that originally agreed.
The second type is the "cost and volume" in which a
predicted volume of work is specified, with an agreed
price. Should the number of patients rise above this
level, then extra money will be provided, and some
payment would be withheld if the number of patients falls
below the target.
The last type is "cost per case" payments. This method is
probably the most satisfactory one in theory; however
this would required the costing of every episode to individual patient level, including drug treatment.
It can be anticipated that as the 'internal market'
becomes more refined, there would be a move towards the
"cost per case" type of contract. A RM system may help to
provide information about the cost of individual patient treatment and the use of a computerised prescribing
system can provide an accurate cost of drug treatment for
each patient. As purchasers become more sophisticated in
contracting, such systems will be playing their part in a
complementary growth in sophistication of costing and
pricing.
1.5.4 Common Basic Specification (CBS)
The Common Basic Specification (CBS) is a set of
activities and supporting data requirements for the NHS.
It describes what the NHS does and the information needed
to do it. It is produced by the NHS information
management centre (IMC) and was first published in
September 1990 and is regularly expanded and revised. The
rationale behind CBS was that the design specification of
a hospital computer system should essentially be the same
for any hospital in the country (Dallimore, 1990) .
CBS looks at the underlying similarity between areas
normally treated separately but makes no attempt to
identify who should do tasks or how they should be done
(Bailey et al, 1991). The CBS covers a large area of
subjects, ranging from pathology and audit to pharmacy. One of the advantages of using CBS to design a system
would be that all systems based on the CBS should be able
to integrate successfully and share common data
(Dallimore, 1990) . This would reduce the cost of
producing new systems and may also offer long term
savings since new elements may be introduced without the
need to substantially rewrite the whole system.
The pharmacy CBS (Bailey et al, 19 91) is one of many
commissioned by the NHS information management centre.
The project was completed in April 1991. The purpose of
the project was to "provide an input to the NHS CBS by
analysing the information needs of a Hospital Pharmacy
service and its interfaces and subsequently specifying a
system to meet those requirements". It is hoped that this
generic model would provide the basis for developing,
procuring and implementing pharmacy systems throughout
the NHS and, potentially, outside the NHS.
The pharmacy CBS covers the data entry, storage,
manipulation and enquiry functions necessary to
accomplish the pharmacy tasks and to provide the required
interfaces with other systems. It has also included
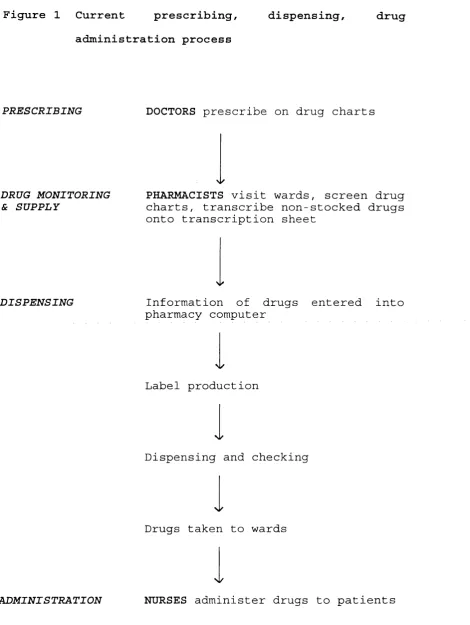
prescribing as part of the process. Figure 2 illustrates
the relationships between different data items or
entities in a prescribing process, such as prescriber,
patient and prescribed items. For example, a
"prescription" may contain zero, one or many
"prescription lines"; however, a "prescription line" will
always relate to just one "prescriber" and one
"prescription", and the "prescription" will only relate to just one "patient". The "prescriber" and "patient" are
related through the "prescription line". Any development
or procurement of a computerised prescribing system
should therefore follow the CBS model to ensure
compatibility with other developing computer systems,
such as the HISS and Resource Management system, which
use the NHS data model.
F i g u r e 2 CBS data m o d e l s h o w i n g the general r e l a t i o n s h i p b e t w e e n a patient, w h a t is p r e s c r i b e d to treat the p a t i e n t a n d w h o is r e s p onsible for the pres c r i b i n g , (extracted from Pharmacy CBS Project, Information Management Centre, 1991)
fs t fm*
■CR PRODUCT
PRESCRIPTION LINE
DOSE RECirE ROUIE
PRODUCT
C o n v e n t i o n s :
A B
For a ny one occur r e n c e of A, there will be zero, one or m a n y occu r r e n c e s of B. For a ny one o c c u r r e n c e of B , there will be only one o c c u r r e n c e of A.
D e s c r i p t i o n s shown by the side of r e l a t i o n s h i p lines d e s c r i b e the m a s t e r - d e t a i l relationship.
The IMC encourages authorities and their suppliers to
develop relevant information systems from the CBS models
(Department of Health, 1990b). This will help ensure
compatibility and consistency of systems and information
within the NHS which may be essential for the future
development of audit and for contracts' handling between
the provider and purchaser units. Thus any development or
selection of computer systems should be consistent with
the CBS while considering the need for more detailed
information used locally.
1.5.5 Discussion
There is an increasing need in the NHS to capture data
regarding individual patient episodes. Initiatives such
as resource management, medical audit and the purchaser/provider split of services all require
treatment information to individual patient level.
Pharmacy departments would need to develop strategies to
meet such demand. While the sense of clinical ownership
of the information must not be lost, medical audit
activities, resource management, contracting, and other
management processes will benefit from the use of a
shared database (Bowden and Walshe, 1991; Department of Health 1990b), probably based on the CBS. The development
of a computerised prescribing system might be a logical
path to follow . However, the cost and benefits of such a
system should be carefully examined.
1.6 Advantages and disadvantages of computerised
prescribing
Computerised prescribing systems have been implemented in
a few hospitals in Japan (Lun et al, 1986; Hisakazu et
al, 1985) and in the USA (Schroeder and Pierpaoli, 1986;
Larson and Blake, 1988; Serpa et al, 1990; Craghead and
Wartski, 1989; Kawahara and Jordan, 1989). In hospitals
in the UK, however, such systems are only at an early
stage of development. Literature documenting any of these
systems is scarce; little evaluation of computerised the
prescribing has been done and none of that in^British
health care system. Most of the advantages described fof
CPS are usually subjective or anecdotal rather than
quantitative.
1.6.1 Advantages
Some of the potential advantages in computerised
prescribing have been outlined in the correspondence of
Clutcher and Scherpbier (1990) and Ellinoy and Gilroy
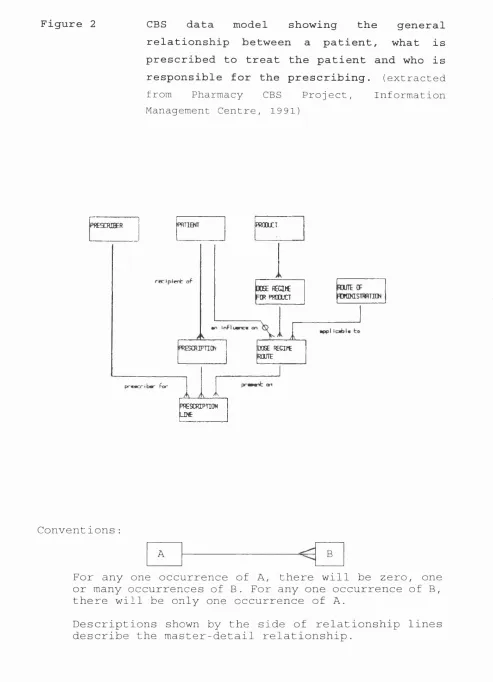
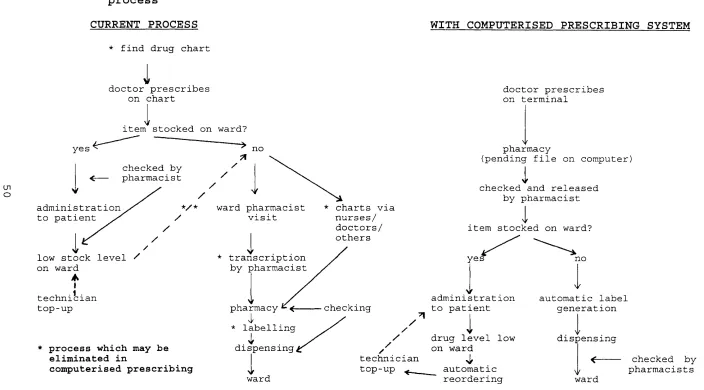
(1990) . The benefits include improved legibility,
decreased errors of omission and a reduced need to contact prescribers about trivial errors. Prescription
details are available to all authorised users as soon as
they are entered into the computer, and lost charts or
the need for nurses to take charts to pharmacy are
eliminated (figure 3). Prescribing information may also
be used in retrospective drug evaluation to determine the
trends of prescribing, its effect on patient therapy and
49
Figure 3 Comparison of computerised process
prescribing with conventional prescribing-dispensing
CURRENT PROCESS WITH COMPUTERISED PRESCRIBING SYSTEM
ui o
* f ind d r u g chart
1
d o c t o r p r e s c r i b e s on chart
item s t o c k e d on ward?
yes no
c h e c k e d b y
p h a r m a c i s t /
/ a d m i n i s t r a t i o n
to p a t i e n t
1
yl ow stock level ' on w a r d
A
I t e c h n i c i a n top-up
* process which may be eliminated in
computerised prescribing
*/* w a r d pharm a c i s t
' visit
t r a n s c r i p t i o n b y p h a r m a c i s t
p h a r m a c y ^ ^
'i'
* l a b e lling
dispensing,
V w ard
* charts via n urses/ d octors/ others
c hecking
d o c t o r p r e s c r i b e s on terminal
p h a r m a c y
(pending file on computer)
c h e c k e d and r e l e a s e d b y p h a r m a c i s t
I
i tem s t o c k e d on ward?
yes
a d m i n i s t r a t i o n to p a t i e n t
/ //
/
I
d rug level low / on w a r d
t e c h n i c i a n ^ top-up a u t o m a t i c
r e o r d e r i n g
no
a u t o m a t i c label g e n e r a t i o n
d i s p e n s i n g
\K
ward
its financial implication.
In a study by Tierney et al (1993), the use of a network
of microcomputer workstations for writing all inpatient
orders was found to significantly lower patient charges, length of hospital stays and hospital costs. A saving of
more than $3 million per year was projected. It was
suggested that the reduction in costs was due to
presentation of timely and relevant information to
prescribers when decisions were made, i e . at point of
prescribing, and also from increased efficiency in the
transmission of prescription orders to pharmacy.
Computerised prescribing may be used to influence
prescribing habits by including informative messages in
the prescribing pathways for certain drugs as done in a
few hospitals in the USA (Larson and Blake, 1988; Schroeder and Pierpaoli, 198 6; Kawahara and Jordan,
1989). Information might just be a warning or could be
further directions: examples are sodium content of injectable antibiotics, recommended antibiotic therapy
based on site of infection, therapeutic alternatives or various dosage regimens and the cost of related drugs.
This would permit prescribers to make more informed
choices.
Kawahara and Jordan (198 9) described a program in which
informative text was inserted into a computerised drug