RESEARCHARTICLE
Using mobility data as proxy for
measuring urban vitality
Patrizia Sulis
1, Ed Manley
1, Chen Zhong
2, and Michael Batty
11Centre for Advanced Spatial Analysis, University College London, United Kingdom 2Department of Geography, King’s College London, United Kingdom
Received: October 1, 2017; returned: January 10, 2018; revised: March 7, 2018; accepted: May 14, 2018.
Abstract: In this paper, we propose a computational approach to Jane Jacobs’ concept of diversity and vitality, analyzing new forms of spatial data to obtain quantitative measure-ments of urban qualities frequently employed to evaluate places. We use smart card data collected from public transport to calculate a diversity value for each research unit. Diver-sity is composed of three dynamic attributes: intenDiver-sity, variability, and consistency, each measuring different temporal variations of mobility flows. We then apply a regression model to establish the relationship between diversity and vitality, using Twitter data as a proxy for human activity in urban space. Final results (also validated using data sourced from OpenStreetMap) unveil which are the most vibrant areas in London.
Keywords: spatial big data, mobility flows, urban vitality, temporal patterns, urban dy-namics
1
Introduction
The urban data deluge that has recently become available represents an unprecedented opportunity for researchers to have access to extensive and detailed data sets of informa-tion about urban space. This opens to the possibility of unveiling urban dynamics at a finer granularity. Such informationally rich data sets, although not produced for the specific purpose of spatial analysis [20], show another representation of urban space, containing supplementary information not derived from its morphology (which is obviously the main source for urban metrics). Therefore, including these data in the analysis means introduc-ing an additional layer of information to the complex representation of what urban space is. The exhaustivity and fine-granularity of the data open to the remarkable possibility for researchers to support, test, and validate, from a quantitative perspective, concepts and intuitions that have become central in urban theory and planning practice. In this paper, we focus on one of these, Jane Jacobs’ definition of urban vitality in the neighborhoods of US cities [19]. She understood vitality mainly in relation to street life. The variety of pedestrian flows over time is seen as an essential condition for the continuous presence of people in the street, which represents vitality in cities. According to her idea, vitality is strongly influenced by specific morphological attributes of the built environment. Recent work explored this relationship, also employing large data sets of human mobility data as a proxy for vitality. However, their results are presented at a spatiotemporal scale that appears too general to fully unveil a detailed description of the phenomenon.
In this paper, we focus on the definition of urban metrics that describe phenomena re-lated to spatial dynamics and behavior of people in places. Different from previous works, we analyze data sets sourced from smart cards used in public transport to minutely mea-sure the spatiotemporal variations of urban vitality in the city of London during the week. Applying a computational approach to the concept of vitality, we introduce a new set of three dynamic attributes to calculate urban diversity as the variations of human dynamics in places. Diversity is measured evaluating not only the number of people present in a place but also the continuity and the variations of this presence over specific intervals of time. Then, we establish the relationship between the diversity of flows and the urban vitality of places, applying a regression model that employs data sourced from Twitter. Re-sults of the data analysis show the spatial distribution of vitality in London. The fine spatial and temporal granularity of data used makes it possible to observe meaningful variations among areas in the city, including interesting exceptions in relation to weekend dynam-ics. Furthermore, the combined metric proposed in this work highlights the component of temporal continuity, which is a significant feature for urban vitality as understood by Ja-cobs [19]. Finally, the regression model is evaluated and the results validated by comparing them with spatial data sourced from OpenStreetMap.
The paper is structured as follows. Section 1 presents the objectives of the work. Sec-tion 2 introduces a brief overview of current research about vitality and spatial dynamics using new large data sets. Section 3 describes the data sets used in the analysis. Section 4 illustrates the methodology applied. Section 5 presents the main results and its validation. Section 6 discusses relevance and limitation of this study. Section 7 concludes the paper.
2
State of the art
It then proceeds to present a concise overview of current research exploring human dynam-ics and presence in urban space by employing data sets from multiple sources, highlighting their strengths and limitations.
2.1
Urban vitality: a definition by Jane Jacobs
According to Jane Jacobs [19], urban vitality is an essential requisite for a successful city in term of street life, and it is particularly associated with safety and walkability. “An intri-cate sidewalk ballet (p.50)” of people walking around neighborhoods, at different times for different purposes, is what makes an urban place successful and safe. Jane Jacobs strongly connects the concept of vitality to that of diversity, which she understood mainly in terms of morphological diversity related to the built form of the city and the distribution of ac-tivities. She identifies four conditions of diversity (mixed used, age of buildings, number of street intersections, and urban density) for evaluating vitality. They are essential and complementary to each other, together contributing to define the degree of diversity (and therefore vitality) of places.
In her work, Jacobs carefully describes her idea of vitality in relation to urban space; however, she never attempted to measure it. New studies propose a quantitative evalua-tion of vitality, exploring the relaevalua-tionship between human mobility data and urban mor-phological data, represented by a measurement of the four attributes of diversity proposed by Jacobs. In Sung et al. [34], human mobility is represented by the pedestrian presence in the streets of Seoul over several years, collected through manual surveys into extensive data sets, whereas diversity is calculated through the four attributes for specific city neigh-borhoods. In the work of De Nadai et al. [8], the proxy for vitality is instead represented by mobile phone data (Internet access only) from various Italian cities. Similar to [34], diver-sity is calculated through the four morphological attributes suggested by Jacobs, with data sourced from the Italian Census.
These works have successfully validated Jacobs’ idea of the relationship between mor-phological diversity and urban vitality at a large scale, extending its effectiveness beyond U.S. cities. However, they also present some limitations in regards to the definition of vitality applied, particularly in relation to the spatiotemporal variations of vitality across neighborhoods.
On successful city streets, people must appear at different times. This is time considered on a small scale, hour by hour through the day [19, p. 152] [ . . . ] The mixture of people on a street at one time of day must bear some reasonably proportionate relationship to people there at other times of day [19, p. 164].
According to Jacobs, the spatiotemporal continuity of human presence and activities in a place is a fundamental trait of vitality—its temporal variations, in terms of intensity and duration of flows, is a relevant aspect to consider in the analysis. In relation to this, the heterogeneity of flows resulting from the presence of different activities in places is also important when evaluating urban vitality in neighborhoods.
the possibility of exploring and uncovering similarities and differences in spatial patterns of human dynamics in cities.
2.2
The availability of new spatial data
The recent deluge of location data is caused by automatically-generated data produced by sensors and other technological devices that human users interact with in urban space. This results in some advantages, such as the high-resolution of spatial and temporal in-formation, automatically collected for wider samples and contexts with no subjective bias related to the human collection. However, it also introduces some relevant bias related to the data representativeness [20]. Some automatically-produced data (in particular social media, [2, 23]) can overestimate demographic groups that have access to specific technolo-gies.
Numerous data sets have been employed in recent research, and three types of spatial data have been of particular interest for a number of years. The first one includes data sourced from “smart cards,” mainly used for calculating commuting flows [24, 33] and identifying urban zoning [16,31,36]. The second type is represented by mobile phone data, aggregated and anonymized, used mainly for detecting urban dynamics and activities be-cause of its fine granularity [3, 4, 13, 15, 22, 28]. A third variant includes social media data, which are readily available from social media companies. Spatial applications of these data are particularly relevant when data attributes include location information, as in the case of Twitter and Foursquare data [5, 6, 17, 26].
Data mentioned above have strengths and limitations that should be considered in the analysis and evaluation of results (Table 1).
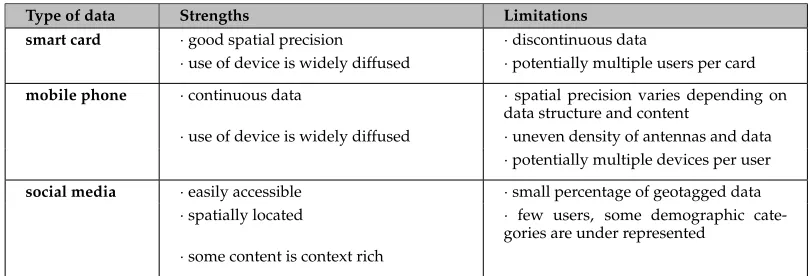
Type of data Strengths Limitations
smart card ·good spatial precision ·discontinuous data
·use of device is widely diffused ·potentially multiple users per card
mobile phone ·continuous data ·spatial precision varies depending on data structure and content
·use of device is widely diffused ·uneven density of antennas and data ·potentially multiple devices per user
social media ·easily accessible ·small percentage of geotagged data ·spatially located · few users, some demographic
cate-gories are under represented ·some content is context rich
Table 1: Main types of data used in current research.
explored how the inhabitants’ perceptions of urban boundaries, inferred from their daily mobility patterns, corresponded to the borders defined by the city administration. Vari-ations of urban dynamics and routines are also analyzed in relation to specific real-world events [1,32]. Lee et al. [21] used tweets to detect small informal urban activities. Analyzing geo-tagged Twitter data, researchers monitored crowd behavior, identifying anomalies of patterns and detecting the occurrence of unusual local events.
Limitations of current research concern two main aspects: the representativeness of the data and the usage of data to predominantly explore a certain type of urban phenomena.
• Representativeness of data. These data sets are undoubtedly partial and represent a sample of the urban reality regardless of their extensiveness [20]. This also has implications for the type and reliability of information contained in the data (often not produced for the purpose of spatial analysis). Furthermore, current research (with meaningful exceptions [3, 22]) tends to focus on single-sourcing data sets, raising an additional concern about the reliability of results.
• Usage of data. Despite the wide attention received, little research( [4, 10, 27, 35]) has focused on analyzing the fine-grained heterogeneity in spatial dynamics that deviates from the large-scale geographic trends that have been known and understood for decades (i.e., home-work commuting). Furthermore, few have attempted to connect this analysis to spatial applications supporting urbanism concepts and methods with valuable quantitative information.
In the light of this, we decided to focus our interest on investigating how to take ad-vantage of the potentialities of these spatial data sets to explore new applications to well-known ideas relevant in urbanism theory and practice. We propose an computational ap-proach to Jacobs’ concepts of diversity and vitality, converting diversity to a metric that measures spatiotemporal variations in human mobility patterns across urban space.
3
Description of data
This work employs data sets containing information about human mobility and presence in places for the City of London. These data sets have multiple sources: the public trans-port authority Transtrans-port for London (Oyster “smart card” data), the social media platform Twitter (tweets collected through the public API), the open-source database OSM (Volun-teered Geographic Information—VGI). In particular, we selected two types of data that can reliably represent human mobility (the records of individual journeys directly provided from the transport authority) and that, according to previous works, can provide a good estimation of the density of human activity in cities beyond the physical constraints of the public transport stations (Twitter data location points).
feature of vitality. Particular attention is dedicated to the continuity of flows over time, rather than the simple magnitude of flows that show interest in a place during specific hours in the day (as it happens, for instance, at peak hours in central, working areas).
3.1
Oyster card data
The public transport data set is provided by Transport for London (TfL), the authority responsible for the various means of collective transport in Greater London. This data set consists of approximately one month of transaction records (collected between January and February 2014) of the Oyster card, the smart card used to get access to the public transport network. The Oyster card is used for entering and exiting through the ticket barriers on the rail network (Underground, Overground, DLR, etc.), and for boarding the buses. Each recorded transaction represents a single journey through the transport network, identified by a unique ID code and containing a large amount of information about that journey.
For the rail network, the information details recorded for each transaction and used for this analysis are:
• a unique ID code identifying the journey,
• a code identifying the transportation mode of the journey, • a code and a name identifying the station,
• a code identifying if the user is entering or exiting the station, • a code identifying the day of the journey,
• a time stamp for the entrance or exit of the station, identifying the start or the end of the journey.
For the buses, the Oyster card is required only when boarding. The information details recorded for each transaction and used for this analysis are:
• a unique ID code identifying the journey,
• a code identifying the transportation mode of the journey, • a code and a name identifying the bus stop,
• a code identifying the day of the journey,
• a time stamp for the boarding of the bus, identifying the start of the journey.
Figure 1: Number of tweets per area of research.
3.2
Twitter data
The Twitter data set consists of approximately three months of records, collected between January and March 2016, for the city of London. The data has been collected through the Twitter API1. The data set contains only geo-tagged tweets; that is, tweets containing spa-tial information (geographic coordinates expressed in latitude and longitude) about the lo-cation the message was sent from. According to literature [23], geo-tagged tweets represent approximately 1% of the total amount of tweets sent by users. Nevertheless, it represents an interesting and valuable source of information to investigate spatial dynamics across cities [5, 17]. Furthermore, Twitter data is also relatively easy to access through the pub-lic API, whereas other types of data (Foursquare, mobile phone records) are private and difficult to obtain for academic research. Each recorded tweet is identified by a unique ID code and contains additional metadata, including the user ID and name, the geographical coordinates and the time stamp the tweet was sent from, a short text (140 characters), any media attached to the text (photo, video, etc.), the language of the text, the city of the user (defined by the user in his profile). We collected around half a million geo-tagged tweets for the entire area of Greater London, setting a bounding box around the area interested in our study. Tweets were further selected to retrieve only records contained within the areas object the analysis (approximately 200,000 tweets).
The information details used for this analysis are:
• a unique ID code identifying the tweet (but not the user),
• the geographical coordinates (latitude and longitude) of the location the tweet was sent from,
• the time stamp identifying the time the tweet was sent.
In this work, we employed Twitter data as a proxy to evaluate the activity density in relation to the presence of people in various places in London (Figure 1).
The limitations of this data are mainly related to the demographic bias and the limited availability of geo-tagged tweets through the Twitter API stream (as mentioned in Section 2) [2, 23]. Another potential bias is related to the limited size of the sample. We chose to collect data from January to March because we wanted to use this set together with the Oyster card data set (provided by TfL for that specific time of the year). Therefore, we needed the two data sets to be temporally coincident. Although a preliminary analysis on a larger set of tweets suggests that data may be subject to seasonal variations in the city of London, we are confident that, for the purpose of this work, this type of bias has limited influence in affecting the validity of the methodology.
3.3
OpenStreetMap data
This data set contains information about the location of activities and Points of Interest (POI) in London, collected from OpenStreetMap through the Overpass API.
Each record contains several pieces of information, including the typology of activity (shop, pub, tourist attraction, etc.), the address, sometimes the opening hours, and more. We chose to use OpenStreetMap as a source because of the availability of data, easily re-trievable through the dedicated API. However, due to the nature of the OSM database (Vol-unteered Geographic Information–VGI [14]), the uniformity of data attributes associated with the spatial objects may vary through the entire data set. Other sources, i.e., Ordnance Survey, may be more robust and will be considered in the future. The attributes used in our analysis are the name and address of the activity, its typology (defined by OpenStreetMap users), and the geographic coordinates (latitude-longitude).
4
Measuring urban vitality: a computational approach
In this paper, we propose to evaluate urban vitality by analyzing the diversity of mobility patterns and examining their spatiotemporal distribution and variations.
As mentioned in Section 2, the diversity of a place (which Jacobs understood in mor-phological terms) and its vitality are intrinsically related, with the former being an essential requisite for the latter. Consistently with Jacobs’ view, we consider the continuity and vari-ety of human mobility flows as features that essentially contribute to the vitality of a place, and more significant than the number of people (magnitude of flows) alone to obtain a reli-able measure of vitality. Different from Jacobs’ idea and previous related work, we consider diversity not as a measure of morphological features influencing the presence of people in places, but as a measure that actually calculates this presence and the flows affecting the areas as an object of the research.
hourly intervals, for weekdays and weekend days. Diversity is defined by three comple-mentary attributes—intensity, variability, and consistency—each one representing a differ-ent granularity in temporal variation, and together contributing to a value represdiffer-enting how diversity temporally changes over time in the same urban place.
In this section, we present the methodology followed for calculating diversity(Dv). We first illustrate the definition of spatial areas of research in which data analysis is performed. We then describe how each of the dynamic attributes constituting diversity is calculated. Finally, we explain how to employ a regression model to extract weights for each attribute. Section 5 illustrates the final results of this methodology.
4.1
Defining the spatial units of research
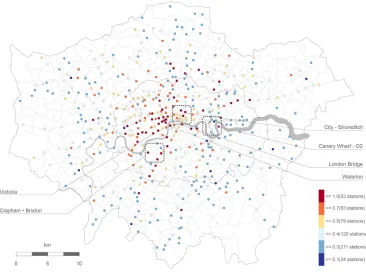
We defined the areas for research considering the spatial distribution of the Oyster card data—the presence of people is recorded at specific, fixed locations in a defined moment of time. We assumed that the rail stations (Underground, Overground, DLR, etc.) and the bus stops located nearby work in synergy, with users boarding and alighting at bus stops around the stations to complete their multi-modal journeys across the network. It is noteworthy that public transport stations act as “flow aggregators,” with other mobility flows converging around them, including the pedestrian flows and those generated by the bike sharing network in London. We defined our research areas considering rail stations and bus stops included within a limited radius of walking distance around each station of the network. After considering various attempts with different ranges, we found the 400 meters walking distance to be suitable for our research. It is a common standard distance used in transit planning as it is considered easily walkable by many city users [7, 9]. Areas are defined using QGIS, buffer, and convex hull tools, assigning bus stops that fall within the 400 m range to the correspondent station, so as to include all the transportation points. Each area represents a spatial unit working in synergy in regard to the flows of people in that area (Figure 2). Vitality is calculated considering the presence of people recorded at the transport locations (for Oyster card data) and the geo-tagged tweets (for Twitter data) included in these areas.
Figure 2: Spatial units of research across London
whereas for peripheral location small flows of people are common, but also lower values of integration. We assigned the value of “integration” (calculated by Space Syntax for the “axial network” of London) to each station and bus stop of the public transport network (in case of intersection with multiple axes, we assigned the maximum of the values of in-tegration available). At the end of this process, each point of the transport network had an “integration” value assigned, which was later used as a coefficient to normalize the value of flow intensity for each day and hourly interval considered in the analysis (see Equation 2).
4.2
Calculating the three attributes of diversity
These three attributes contribute to the final measure of diversity(Dv)through a linear combination, described by the Equation 1:
Dv=α1∗intensity(I) +α2∗variability(V) +α3∗consistency(C) (1)
where:
a. Intensity (I) is calculated as the total number of people who enter and exit from stations and alight at bus stops included in each spatial unit at a defined time interval (Equation 2). We calculated a value of intensity for each point at an hourly lever for every weekday, and then we normalized this value using the “integration” score (as explained in paragraph 4.1). Finally, we calculated the value of intensity for each spatial unit, aggregat-ing the data for an average workaggregat-ing day and an average weekend day.
I=
Pusers
integration score (2)
b.Variability(V)is defined as the difference of user flows among different days for each station and bus stop (Equation 3). When calculating variability, we were interested in un-derstanding the stability of temporal patterns of mobility flows: the higher the variability, the more random the flows are distributed over time, contributing to the continuity of flow in the area. Variability adds to the final value of diversity a component representing the differences of urban dynamics in relation to specific activities between the weekdays (rou-tine patterns related to commuting) and the weekend (non-rou(rou-tine and irregular patterns related to leisure, shopping, etc). Variability is calculated at the daily level by comparing the correlation (Corr()) of flow vectors of any pair(f lowi, f lowj)ofndays and then
nor-malizing this value by the number of pairs. For instance, if the number of days is five, then there will be ten pairs of comparisons [37].
V =
Pn i
Pn
j (1−Corr(f lowi, f lowj)))
(n∗(n−1)/2) (3)
c.Consistency(C)represents the hourly variation of flows during the same day for each station and bus stop (Equation 4). We used it to observe if places presented a continuous temporal pattern (indicating a constant use of the space over time) or one characterized by concentrated peaks (which will suggest a presence of people in places concentrated into specific hours, possibly driven by specific activities). This attribute contributes to highlight the variety of spatial dynamics in space across the same day (i.e., differences between morn-ing and night flows). A higher number of outliers indicate a more irregular, non-routine temporal pattern in the use of the space, with a minor concentration of flows around spe-cific times. This is related to the idea of continuity in street activity suggested by Jacobs. Consistency is measured calculating the hourly outliers using MAD (Median Absolute De-viation) and then normalizing this value using the daily number of outliers per station or bus stop.
C= P outlier
daily outliers (4)
patterns of mobility at a different temporal resolution, and act to balance the contribution of intensity to the final value, in order to achieve a better evaluation of vitality(V t). The three attributes (Table 2), singularly and together, uncover the existing differences in temporal patterns across the whole city of London and within the same place (Figures 3, 4, and 5). Areas showing more variations and a more dynamic temporal pattern of flows are places with a higher degree of vitality, attracting people throughout the day.
intensity variability consistency
min 0.01 0.05 0
mean 0.22 0.32 0.05
max 0.58 0.61 0.15
Table 2: Description of the three attributes for the average day of the week.
Finally, the fine granularity of the data used for calculation makes it possible to measure variations and detect temporal differences in mobility patterns even at small time intervals (one-hour intervals and further). This contributes to achieving a better understanding of the spatial human dynamics.
4.3
Regression model
In order to calculate diversityDv, the three attributes are weighted according to how much they contribute to the final value of urban vitality. To compute the weights, we used a linear regression model, and a data set sourced from Twitter as the dependent variable representing the human presence in urban space (similarly to [5, 26]).
Our intuition, when deciding to use Twitter data as the proxy for the density of human activity in the city, is that the ranking of the areas of research according to the number of geo-located tweets would not differ significantly from the ranking of the same areas accord-ing to urban vitality. It is important to stress that in this case tweets count is not considered as an exact estimation of the human presence in places (for the noted demographic bias of this type of data [2, 23]), nor as an approximation of the final values of vitality. It is instead used to rank the spatial units based on the density of human activity, a ranking that can also be descriptive of the order of the spatial units according to the presence of people in places (vitality). We judged Twitter data to be sufficiently reliable in the light of previous research, and preferable to other sources (e.g., static sample population) because it catches the temporal variations in human mobility flows. It is also a necessary choice in this study since, to our knowledge, no ground truth measuring urban vitality in various places of London is currently available (we will collect more information in the next phase of this work through a bespoke survey).
Figure 3: Spatial distribution of the intensity calculated for an average week day.
tweet count∼α1∗intensity(I) +α2∗variability(V) +α3∗consistency(C) (5)
We run the regression model using different values of the variables calculated for an average weekday and an average weekend day to extract appropriate weights for different times of the week (Table 3). Once we obtained the corresponding attribute weights, we assigned them to each attribute (intensity, variability, and consistency obtained from Oyster data), and we calculated the final values of diversity(Dv)for the average weekday and the average weekend day, and for hourly intervals, as indicated in Equation 1.
Attribute Week (Adjusted-R2= 0.843) Weekend (Adjusted-R2= 0.831)
intensity 1.46 1.64
variability 0.51 0.39
consistency -0.11 -0.46
Figure 4: Spatial distribution of the variability calculated for an average week day.
5
Results
5.1
Spatial distribution of vitality in London
This section presents the results of the data analysis and the metrics calculation, and shows the spatial distribution of vitality in London according to different times of the day and during the week. The fine temporal granularity of the data used in the analysis makes pos-sible to observe meaningful variations of flows and mobility patterns, which significantly help to understand in a detailed and quantitative manner how places across London are differently used and visited over time.
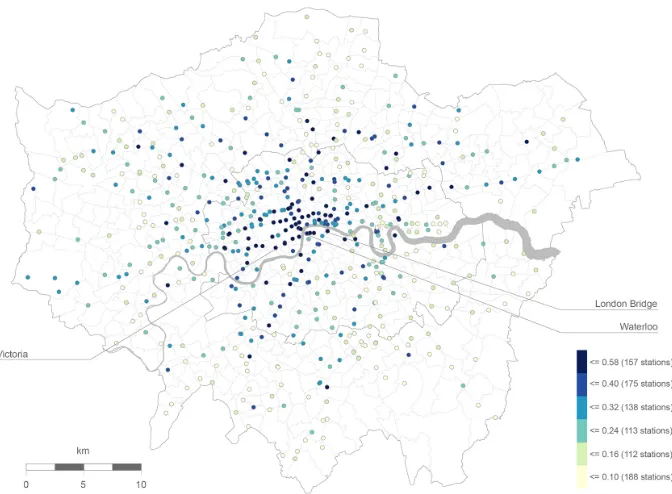
Results presented here include the vitality values calculated for an average weekday (Figure 6) and for an average weekend day (Figure 7). It is worth mentioning that the data set used also includes bus records, which may explain some of the results in peripheral areas and during the weekend since rail stations (Underground, Overground, DLR, etc.) act as attractors of bus flows from the surrounding areas. Furthermore, bus data is also representing mobility flows at the local level in the overall results. This will need further analysis of the results to fully understand the implications.
For some of the areas analyzed, results confirm our empirical knowledge. This is the case for central London, and for the main multi-modal train stations (London Bridge, Wa-terloo, Victoria, King’s Cross). We expected those places of the city (where the majority of workplaces, businesses, and tourist attractions are located) to show high values of vitality because of the presence of people in those areas. The higher values of vitality during the weekdays are strongly influenced by the magnitude of flows related to the home-work commuting journeys. Intensity presents high values for those areas, whereas variability shows lower values because of the routine behavior of flows during the week (Figure 6). Hourly variation during the day is also low, with no or few significant variations related to commuting flows (which results in low values of consistency and less vitality).
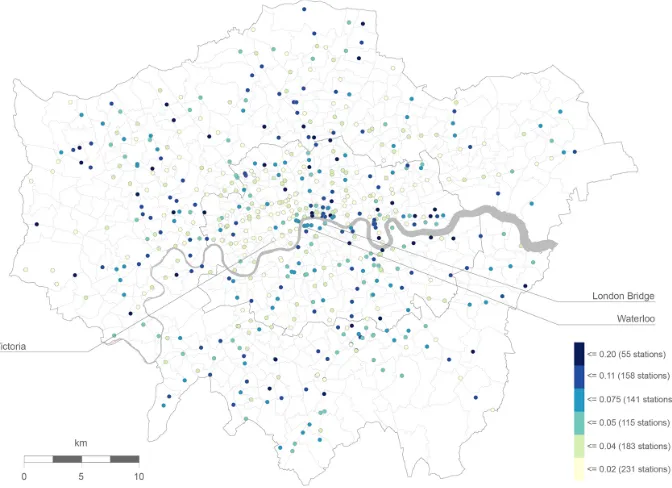
Besides that, other areas show interesting behaviors, particularly those showing a clear discontinuity in comparison to the adjacent zones, and, notably, the area including Wood Green and Turnpike Lane Underground stations (North London, Figure 6), which act as attractors of flows for the contiguous residential areas (they also include important com-mercial destinations). Similar patterns are evident in South London, in the areas around Clapham and Brixton stations (Figure 7), where vitality shows constant high values be-cause the two places attract flows for the adjacent residential neighborhoods. Interestingly, variability shows low values across the whole week (weekend included). This may be re-lated to the fact that the two stations (part of the Tube and Railway network) act as main gateways to Central and North London, and are therefore highly frequented also outside the commonly understood commuting hours.
Figure 6: Vitality values for an average week day.
The higher values of vitality during the weekend reflect significant differences dur-ing week and weekend, and a multiplicity of mobility patterns durdur-ing the weekend. This confirms the correct functioning of the combined index of diversity(Dv)which, although inevitably influenced by the magnitude of flows, draws the attention on the temporal vari-ations of the spatial patterns of city users, and the continuity of them as a fundamental feature for a place to be vital.
Figure 7: Vitality values for an average weekend day.
(Google has its Campus in Old Street), which generally follow a more varied patterns of working hours than the common ones (9 to 5 o’clock during weekdays).
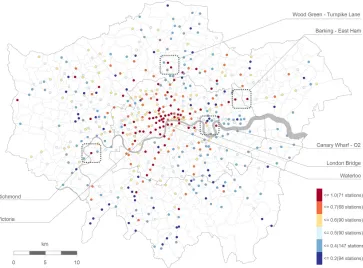
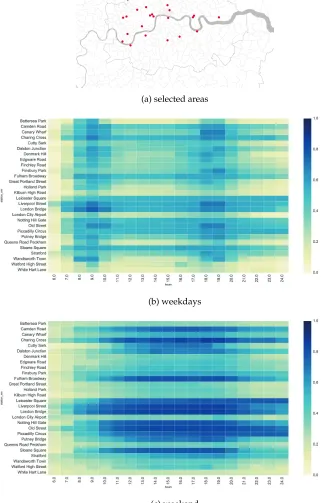
Figure 8 shows the hourly variations of vitality of an average week and weekend day for the areas around Old Street and Shoreditch (East London), highlighting how vitality has a steady continuity in values during the whole day. Besides the different temporal patterns characterizing the week and weekend, it is interesting to recognize how in these areas the value of vitality increases during weekend also in relation to a greater variety in the temporal distribution of flows. This is not only related to commuting for work, but to the many different purposes that attract people in the areas (we can also observe the long tail of the night flows during the weekend). Figure 9 shows the hourly variations of vitality for selected areas across the city of London.
We believe this is a significant novelty in our work. The metric represents not only the number of people present in a place at a certain moment in time, but it combines that simultaneously with two attributes that evaluate the variation of that value in the day (consistency) and the week (variability). Our metric encapsulates a temporal comparison of flow patterns and evaluates vitality according to the presence of people in places as a whole. The result is that places that are crowded only at specific times (i.e., peak-hours) are not instantly considered vital, a combination of the temporal patterns of flows in places is needed.
Another improvement of our work is the modality to calculate diversity and vitality. Rather than qualitatively estimating the presence of people in a place indirectly from its morphological features, we calculated it directly using quantitative information about hu-man presence in space. Furthermore, we measured vitality at a higher spatiotemporal res-olution than previous related works—not at the borough level but at specific locations, not as an absolute temporal value but as two average weekly values and hourly series that highlight variations in spatial patterns. Our analysis and results comprehend multiple lo-cal areas in the city for an extended interval of time. We decided to evaluate vitality for specific areas rather than averaging the results for wider areas because we consider that one of the strongest advantages of using these data sets for spatial analysis is to capture and uncover significant differences in the patterns of human spatial behavior in cities.
5.2
Validation
To evaluate the performance of our regression model, we observe the Adjusted-R2 param-eter. The value obtained for the week data set (Adjusted-R2= 0.843) and the weekend data set (Adjusted-R2= 0.831) suggest that our model is working correctly.
In addition to this, we also compared the ranking of the areas of research according to the number of tweets and the final values of vitality calculated with the Oyster data, using a test data set selected when preparing the data for the regression model (random train-test-split. An established method to verify the relationship between two rankings (and specifically measuring their degree of similarity) is to calculate the rank correlation using the Spearman’s rank correlation coefficient following the equation below (Equation 6):
ρ= 1−6
Pd2
i
n3−n (6)
The results (week: ρ = 0.70, p < .001, weekend: ρ = 0.57, p < .001) indicate that the ranking of the areas of research predicted by the model is consistent with the ranking obtained according to the number of tweets.
(a) selected areas
(b) weekdays
(c) weekend
Twitter, and the Census are used to establish how precisely they are capturing human mo-bility flows over time. In [29] mobile phone data and location data extracted from Yellow Pages are used to establish the relationship between the spatiotemporal patterns of human mobility and the human activity places in Rome.
We conducted some preliminary analysis using points of interest (POI) extracted from OpenStreetMap to obtain an index representing the spatial distribution and diversity of activities in areas. We then calculated the correlation between the vitality metric and the total number of activities for each area of research. The results obtained so far appear incongruous (r= 0.43, whilep < .001). This relation will be further investigated in future work.
6
Discussion
The main objective of this paper is to explore the possibility of building urban metrics using extensive location data sets that have become recently available. Such metrics make it possible to obtain a quantitative evaluation of particular urban dynamics and to achieve a better understanding of phenomena related to spatial dynamics and patterns of human mobility in cities.
Undoubtedly, the concept of vitality is widely understood in many different ways. Jane Jacobs defined it only through empirical observations and experience, but actually never at-tempted at testing or quantifying it. Our metric captures the dynamic attributes defined for diversity in relation to the variations in the pattern of flows. These elements are recognized by urbanism theory as strongly related to urban vitality, which is commonly understood more as a quality of a place. In some way, in our work we are attempting at quantifying this quality. This can be done in many different ways and we think that our method follows a coherent interpretation of Jacobs’ understanding. We calculated how diverse the places are in terms of flow patterns, and this diversity and temporal variations are the constituent ele-ments of urban vitality. Indeed, one may argue that urban vitality, as an intangible, holistic phenomenon, cannot be captured in its entirety by quantitative methods. Nevertheless, in this work we believe we have captured accurate measurements of diversity and vitality that relate to the human flows and presence of people in urban places. These metrics enable scholars and planners to analyze the phenomena with quantitative information that can be consequently used in their comprehensive evaluation of a place.
model shows an evident correlation between the order of vital areas obtained by mobility data and that obtained by social media data. This means that the same methodology can be eventually adapted and applied to other data sets in different contexts (i.e., to social media data when more reliable data about human presence in space is not available).
6.1
Limitations
The main limitation of the results obtained in this work is related to the representativeness of the data. This is a common and well-known concern in research involving these types of data, particularly in relation to Twitter data and the narrow population sample represented (Section 2). It is also important to mention that, regarding the public transport data from Oyster card, start and end of journey points are available only for the rail network (Under-ground, Over(Under-ground, DLR, etc.), whereas for bus journeys the only spatial data available is the boarding point. Consequently, some of the measurements for specific points in time (i.e., working locations during commuting peak hours) will be only partially representing the actual dynamics of the places.
Another limitation, intrinsic of the Oyster data set, is related to the spatial distribution of the sensors in the city. This means that results cannot be extended to larger areas than those analyzed in the research without losing accuracy. The same type of spatial constraint is common to other types of data collected through sensors (i.e., mobile phone data captured by antennas). Their results are often extended to larger areas averaging finer-granularity, point-based values. For this work, we think that it is more meaningful to present detailed results instead of averaging them. We should also notice that central areas of the city may still be biased because of their location in relation to the entire urban network. The normal-ization of the attribute of intensity using the “integration” score does not completely cancel the influence of the magnitude of flows that interest central places in London.
A limitation in the methodology is represented by employing Twitter data as an ap-proximation for the density of people activity in space in the regression model. Although various examples in the current literature use this type of data to measure human presence and dynamics in space, we are aware that our assumption may be prone to error in relation to the non-ideal representativeness of the Twitter data. For this specific reason, part of the future work of this research will be dedicated to build a ground truth training data set to feed the model with real-world data, using people insights and collecting their experi-ence of vitality in urban space through surveys. Finally, it is worth pointing out that the OLS (ordinary least square) regression model selected for this research allows for negative weights, which in this particular case might seem like a counter intuitive result. However, we can simply rescale the regression to avoid negative numbers in the predictions and this serves to counter the problem of the model producing unrealistic numbers. As such, the model is indicative of vitality rather than predictive in the numerical sense. In future work, we intend to test other variants of the models such as that based on Poisson regression which would avoid such problems. We speculate that such analysis would not produce very different results, but this is for future research.
(a) selected areas
(b) weekdays
(c) weekend
how it is possible to use data sets representing human mobility to build metrics about urban space that can quantitatively better support urban planning decisions and processes.
7
Conclusion
In this paper, we proposed a computational application of the concept of urban vitality defined by Jane Jacobs, using mobility data sourced from the Oyster card as a proxy for measuring indicators as diversity and vitality in relation to the spatial dynamics and the presence of people in different areas of London. Our main objective was to obtain a quan-titative evaluation of these well-known urbanism concepts that, although frequently used, have not been largely explored yet from a quantitative perspective. We defined three dy-namic attributes (intensity, variability, and consistency) that measure the variation in pat-terns of human dynamics according to the number of people, the continuity of their pres-ence in places, and the variations over different time intervals in the week. We applied a multivariate linear regression model to obtain the weight for each attribute, and then calculated the final value of urban diversity.
The results show that vitality is higher in central places of the city, as one would expect from the daily experience. However, the high-resolution of the data sets employed in this work, and the analysis performed at a finer spatial and temporal scale, make possible to observe meaningful variations in adjacent central places that present significant differences in spatial behavior over time. Also, interesting exceptions are detectable in the peripheral areas, presumably related to flows driven by leisure and tourism. The application of the combined metric for calculating vitality, rather than only considering the magnitude of flows (as in related works), makes possible to catch variations in the mobility patterns of people, and to highlight the aspect of continuity of their presence in places, which is a significant element for vitality as understood by Jacobs. Finally, our work contributes to improving the capability of urbanism and urban analysis in the following ways.
• It provides a better understanding of spatial phenomena at a closer, more detailed scale.
• It illustrates how it is possible to develop metrics about urban space using data sets that supply additional information beyond urban morphology.
• It attempts to deviate from a data-driven approach, using well-known concepts of urbanism theory to drive the data analysis and evaluation.
Acknowledgements
The authors would like to thank Transport for London for providing the data used in this research. Thanks also to Steven Gray for his help in the process of collection of the Twitter data.
References
Social Media. In 2013 IEEE 13th International Conference on Data Mining Workshops (2013), pp. 1077–1080. doi:10.1109/ICDMW.2013.39.
[2] BLANK, G. The Digital Divide Among Twitter Users and Its Implications for Social Research. Social Science Computer Review 35, 6 (2017), 679–697. doi:10.1177/0894439316671698.
[3] CALABRESE, F., COLONNA, M., LOVISOLO, P., PARATA, D.,ANDRATTI, C. Real-Time Urban Monitoring Using Cell Phones: A Case Study in Rome. IEEE Transactions on Intelligent Transportation Systems 12, 1 (2011), 141–151. doi:10.1109/TITS.2010.2074196.
[4] CALABRESE, F., PEREIRA, F. C., LORENZO, G. D., LIU, L.,ANDRATTI, C. The Geog-raphy of Taste: Analyzing Cell-Phone Mobility and Social Events. InPervasive Com-puting(2010), Lecture Notes in Computer Science, pp. 22–37. doi:10.1007/978-3-642-12654-3_2.
[5] CHENG, Z., CAVERLEE, J., LEE, K.,ANDSUI, D. Z. Exploring millions of footprints in location sharing services. Proc. the 5th International Conference on Weblogs and Social Media, ICWSM 2011 2011(2011), 81–88.
[6] CRANSHAW, J., SCHWARTZ, R., HONG, J., AND SADEH, N. The Livehoods Project: Utilizing Social Media to Understand the Dynamics of a City. InProc. the 6th Interna-tional Conference on Weblogs and Social Media, ICWSM 2012(2012), pp. 58–65.
[7] DANIELS, R.,ANDMULLEY, C. Explaining walking distance to public transport: The dominance of public transport supply. Journal of Transport and Land Use 6, 2 (2013), 5–20. doi:10.5198/jtlu.v6i2.308.
[8] DE NADAI, M., STAIANO, J., LARCHER, R., SEBE, N., QUERCIA, D., AND LEPRI, B. The Death and Life of Great Italian Cities: A Mobile Phone Data Perspective. In Proceedings of the 25th International Conference on World Wide Web(2016), pp. 413–423. doi:10.1145/2872427.2883084.
[9] EL-GENEIDY, A., GRIMSRUD, M., WASFI, R., TETREAULT, P., AND SURPRENANT-LEGAULT, J. New evidence on walking distances to transit stops: identifying redun-dancies and gaps using variable service areas. Transportation 41, 1 (2014), 193–210. doi:10.1007/s11116-013-9508-z.
[10] FERRARI, L., MAMEI, M., AND COLONNA, M. Discovering events in the city via mobile network analysis. Journal of Ambient Intelligence and Humanized Computing 5, 3 (2014), 265–277. doi:10.1007/s12652-012-0169-0.
[11] GEHL, J. Life Between Buildings: Using Public Space. Island Press, 2011.
[12] GEHL, J.,ANDSVARRE, B. How to Study Public Life. Island Press, 2013.
[13] GIRARDIN, F., CALABRESE, F., FIORE, F. D., RATTI, C., ANDBLAT, J. Digital Foot-printing: Uncovering Tourists with User-Generated Content. IEEE Pervasive Comput-ing 7, 4 (2008), 36–43. doi:10.1109/MPRV.2008.71.
[15] GRAUWIN, S., SOBOLEVSKY, S., MORITZ, S., GODOR, I., ANDRATTI, C. Towards a Comparative Science of Cities: Using Mobile Traffic Records in New York, London, and Hong Kong. InComputational Approaches for Urban Environments. Springer Inter-national Publishing, 2015, pp. 363–387. doi:10.1007/978-3-319-11469-9_15.
[16] HASAN, S., SCHNEIDER, C. M., UKKUSURI, S. V.,ANDGONZALEZ, M. C. Spatiotem-poral Patterns of Urban Human Mobility. Journal of Statistical Physics 151, 1-2 (2013), 304–318. doi:10.1007/s10955-012-0645-0.
[17] HAWELKA, B., SITKO, I., BEINAT, E., SOBOLEVSKY, S., KAZAKOPOULOS, P., AND RATTI, C. Geo-located Twitter as proxy for global mobility patterns. Cartography and Geographic Information Science 41, 3 (2014), 260–271. doi:10.1080/15230406.2014.890072.
[18] HILLIER, B., PENN, A., HANSON, J., GRAJEWSKI, T.,ANDXU, J. Natural movement - or, Configuration and attraction in urban pedestrian movement. Environment and Planning B: Planning and Design 20, 1 (1993), 29–66.
[19] JACOBS, J. The life and death of great American cities. New York: Random House, 1961.
[20] KITCHIN, R. The data revolution: Big data, open data, data infrastructures and their conse-quences. Sage, 2014.
[21] LEE, R., WAKAMIYA, S., AND SUMIYA, K. Discovery of unusual regional so-cial activities using geo-tagged microblogs. World Wide Web 14, 4 (2011), 321–349. doi:10.1007/s11280-011-0120-x.
[22] LENORMAND, M., PICORNELL, M., CANTU-ROS, O. G., TUGORES, A., LOUAIL, T., HERRANZ, R., BARTHELEMY, M., FRIAS-MARTINEZ, E.,ANDRAMASCO, J. J. Cross-Checking Different Sources of Mobility Information. PLOS ONE 9, 8 (2014), e105184. doi:10.1371/journal.pone.0105184.
[23] MORSTATTER, F., PFEFFER, J., LIU, H., AND CARLEY, K. M. Is the sample good enough? Comparing data from twitter’s streaming API with Twitter’s firehose. In Proc. the 7th International Conference on Weblogs and Social Media, ICWSM 2013(2013), pp. 400–408.
[24] MUNIZAGA, M. A., AND PALMA, C. Estimation of a disaggregate multimodal public transport Origin-Destination matrix from passive smartcard data from San-tiago, Chile. Transportation Research Part C: Emerging Technologies 24 (2012), 9–18. doi:10.1016/j.trc.2012.01.007.
[25] NES, A.V. Introduction to Configurative Methods in Urban Studies. Techne Press, Delft, 2008.
[26] NOULAS, A., SCELLATO, S., LAMBIOTTE, R., PONTIL, M.,ANDMASCOLO, C. A Tale of Many Cities: Universal Patterns in Human Urban Mobility.PLOS ONE 7, 5 (2012), e37027. doi:10.1371/journal.pone.0037027.
[28] RATTI, C., FRENCHMAN, D., PULSELLI, R. M., AND WILLIAMS, S. Mobile Land-scapes: Using Location Data from Cell Phones for Urban Analysis. Environment and Planning B: Planning and Design 33, 5 (2006), 727–748. doi:10.1068/b32047.
[29] READES, J., CALABRESE, F., AND RATTI, C. Eigenplaces: Analysing Cities Using the Space-Time Structure of the Mobile Phone Network. Environment and Planning B: Planning and Design 36, 5 (2009), 824–836. doi:10.1068/b34133t.
[30] READES, J., ZHONG, C., MANLEY, E., MILTON, R.,ANDBATTY, M. Finding Pearls in London’s Oysters.Built Environment 42, 3 (2016), 365–381. doi:10.2148/benv.42.3.365.
[31] ROTH, C., KANG, S. M., BATTY, M.,ANDBARTHELEMY, M. Structure of Urban Move-ments: Polycentric Activity and Entangled Hierarchical Flows.PLOS ONE 6, 1 (2011), e15923. doi:10.1371/journal.pone.0015923.
[32] SAKAKI, T., OKAZAKI, M.,ANDMATSUO, Y. Earthquake Shakes Twitter Users: Real-time Event Detection by Social Sensors. InProc. the 19th International Conference on World Wide Web(2010), pp. 851–860. doi:10.1145/1772690.1772777.
[33] SEABORN, C., ATTANUCCI, J.,ANDWILSON, N. Analyzing Multimodal Public Trans-port Journeys in London with Smart Card Fare Payment Data.Transportation Research Record: Journal of the Transportation Research Board 2121(2009), 55–62. doi:10.3141/2121-06.
[34] SUNG, H.-G., GO, D.-H.,ANDCHOI, C. G. Evidence of Jacobs’s street life in the great Seoul city: Identifying the association of physical environment with walking activity on streets.Cities 35(2013), 164–173. doi:10.1016/j.cities.2013.07.010.
[35] TRAAG, V. A., BROWET, A., CALABRESE, F., AND MORLOT, F. Social Event Detection in Massive Mobile Phone Data Using Probabilistic Location Inference. In 2011 IEEE Third International Conference on Privacy, Security, Risk and Trust and 2011 IEEE Third International Conference on Social Computing (2011), pp. 625–628. doi:10.1109/PASSAT/SocialCom.2011.133.
[36] ZHONG, C., ARISONA, S. M., HUANG, X., BATTY, M., AND SCHMITT, G. De-tecting the dynamics of urban structure through spatial network analysis. In-ternational Journal of Geographical Information Science 28, 11 (2014), 2178–2199. doi:10.1080/13658816.2014.914521.