http://www.sciencepublishinggroup.com/j/ijes doi: 10.11648/j.ijes.20170101.11
Pattern of Education Expenditure and Manpower Needs:
Implication on Educational Standard
Richardson Kojo Edeme
1, *, Sunday Okubor Ijieh
21
Department of Economics, Faculty of Social Sciences, University of Nigeria, Nsukka, Nigeria
2
Department of Economics, School of Arts and Social Sciences, College of Education, Agbor, Nigeria
Email address:
[email protected] (R. K. Edeme), [email protected] (R. K. Edeme), [email protected] (S. O. Ijieh)
*
Corresponding author
To cite this article:
Richardson Kojo Edeme, Sunday Okubor Ijieh. Pattern of Education Expenditure and Manpower Needs: Implication on Educational Standard. International Journal of European Studies. Vol. 1, No. 1, 2017, pp. 1-6. doi: 10.11648/j.ijes.20170101.11
Received: March 10, 2017; Accepted: March 28, 2017; Published: April 15, 2017
Abstract:
A basic trend observable in education expenditure in Nigeria over the years in the inconsistence in the pattern and amount budgeted to the sector and in most cases not meeting the recommended UNESCO standard. In this study, we present an overview of the trend of government expenditure on education and how this has impacted in meeting the manpower needs and educational standard in Nigeria. Analysis of data reveals that for the period covered by the study, expenditure on education has not been consistent and did not follow a definite pattern and this has resulted in the shortfall of qualified manpower in some subjects such as Engineering and Medicine, requiring so many years to meet the shortfall. Also there exist a yawning gap between demand and supply in manpower and the duration of meeting the gap were alarming. Bearing all things constant, it will take 41 years, 7 years, 48 years, 44 years, 86 years, 12 years, 16 and 38 years to meet the manpower needs in Commerce, Business Methods, Agriculture, Home Economics, Food and Nutrition, Home Management, Clothing and textiles and Introductory technology respectively. This partly explains the declining education standard. In view of this, there is need for government to take the necessary steps clearly focused on adequate investment in transforming the education sector. Greater proportion of the nation’s annual budget should be allocated to education so as to meet the challenges of manpower needs in the critical disciplines.Keywords:
Government Expenditure, Education, Manpower Needs, Educational Standard1. Introduction
It has been noted by many scholars that education is one of the obvious means through which knowledge, skills and attitude are acquired for effective performance of socio-economic responsibilities, social integration, improved competence and better employment opportunities. The socio-political and economic development of any nation is, in many ways influenced to a large extent by the quality and level of educational attainment of the citizens [1, 2, 3 and 4] The Nigeria Government recognizes the importance of education, hence, at independence, it embarked on measures of quantities and qualitative expansion of educational facilities at all levels. Thus, from 5 universities in 1972, Nigeria has 143 universities, 46 polytechnics, and 64 colleges of education in 2016. According to [5], in two decades, the numbers of university students increased eightfold, from
about 55,000 in 1980 to more than 500,000 in 2005. In Nigeria today, there are over 16,000 largely private pre-primary educational institutions, 48,242 largely public primary schools, 7,104 secondary schools. But these bold educational initiatives have not translated into significant improvement in the standard of education as the efforts have only produced 70 percent gross enrolment, 44 percent transition rate from primary to secondary school, 57 percent adult literacy rate; while about 60 percent of those attending primary school regressed into illiteracy. Also, about 56 percent of the female population is illiterate and the male-female literacy ratio is 4:1 percent.
Nigeria launched another mass-oriented program, the Universal Basic Education (UBE) which was expected to provide free education to children between the ages of 7-17. However, not long after, the federal government reported that the falling standard of education in Nigeria was as a result of acute shortage of qualified teachers, especially at the primary level. It was reported that about 22 percent of the over 200,000 teachers employed in the nation's primary schools do not possess the Teachers' Grade II Certificate, even when the Nigerian Certificate of Education (NCE) is the minimum educational requirement to teach in the primary schools [6] and [7]. [8] report on the state of the world's children indicates that about four million Nigerian children have no access to basic education, and that majority of those that are lucky to enter school are given sub-standard education. In 1994, there were 16, 190,947 teachers in 38, 649 primary schools, taught by 435,210 teachers. Similar trend was also noticed in the secondary schools where 4,457, 349 students were taught by 152,592 teachers. While the pupil-teacher ratio at the primary level was estimated at 45: 1 in 2005, in 2016, secondary schools in Nigeria rose to 7,104 with total students enrollment of 4,448,981 [9 and 10].
The increased need for higher education brought about by the oil, boom of the 1970s in Nigeria, coupled with political pressure, led to the establishment 'of many universities with explosive expansion in enrolments during the period. A major obstacle to the further advancement of education standard in Nigeria is the shortage of qualified teachers. In 1993-94, universities had 12,031 teachers and 207,982 students [11].
Usually, countries facing substantial decline in quality of education depend heavily on quality manpower. Conversely, countries experiencing low growth might have a strong dependence on education which is often manifested in the expenditure pattern. Therefore, pattern of expenditure represent a measure of the importance government places on a particular sector. Researchers have investigated the causes of low educational standard. [12] and [13] focused their attention on the importance of education in the growth process of an economy. But the pattern of education expenditure is worth examining because from an economic point of view, it appears to conform to what is postulated by standard economic theories. It is also worthy from policy perspective in that it will unprecedentedly determine standards and the contribution of education to the growth process. As aptly noted by [14], expenditure on non productive sectors and components of the economy is high while expenditure on well-being enhancing sectors such as education is minimal. However, accelerating the educational standard and an increasing the education expenditure is driven by available manpower. Some policymakers have also averred that the significant and qualified manpower deficit may be unsustainable and thus may create problems for the economy in the nearest future. The sharp increase in student enrollment from 2002-2007 onward was at 3.8 percent. In the recent past years, 2010-2014, the continuous rise in students enrollment, especially at the tertiary level have increasingly
raised concerns. Meanwhile, for the same period, the existing staff-student ratio is far below the approved requirement. Many researchers unequivocally agree that the current deficit is unsustainable and articulated as a major threat facing the Nigeria educational system. This paper, therefore examines how an unsustainable expenditure pattern may trigger rapid decline in the manpower and its implication on educational standard.
2. Theoretical Underpinning and
Empirical Evidence
Government funding of education is based on the classical literature on public goods, where it is argued that social goods provide a rationale for the allocative function of the budget. The notion is that the public sector performs certain functions due to the fact that some goods cannot be provided efficiently through the market system due to its failures. Market failure occurs because the benefits created by social goods are not limited to one particular consumer who purchases the good as in the case' with private goods. It would be inefficient, therefore, to prevent any consumer from partaking in the benefits of a social good since such consumption does not reduce or limit the benefits accruing to others, Thus, the cost of providing educational services would have to be weighed against the magnitude, pace, pattern, composition and utilization. The human capital model argues that skills are acquired through expenditure in education, which adds to the overall volume of national competitiveness. Thus, the more education individuals acquire, the better they are able to absorb new information, acquire new skills, familiarize themselves with new technologies and take advantage of the development process. [15] contend that government funding of education is anchored on the notion that for continuity of the society, the new generation must be exposed to appropriate knowledge that previous generations have accumulated.
economy, enhancing personal fulfillment, ensuring world leadership and preserving democracy as the gains of education to the society and the individual. He asserts that when government invests in education, the development in the society is commensurate with the level of investment, when an individual invests in education, his future income is enhanced, but the society benefits by proxy. Similarly [25] examined the underlying rational for government expenditure on education. The study reveals that such expenditure is to equip people with knowledge, skills, and capacity to enhance or improve their quality of life, augment productivity and capacity to earn knowledge of new techniques of production in order to be able to participate actively in the development process. While primary and secondary education aims at inculcating literacy and numeracy, higher education creates the needed manpower with improved skills for technological innovation with growth in productivity. In this regard, education can therefore be described as the process of socialization by which citizens learn to adapt to and, where necessary, conquer their environment.
Researches such as [26, 27] have demonstrated that education is paramount in the growth process of an economy, but more worrisome is the quality of education available in a particular country. As observed by [28] and [29]), a great relationship exists between education expenditure and quantity and quality of education and its role in fostering future development. The attainment of this depends to a large extent on the available manpower. Although [30] was able to ascertain the correlation between education expenditure and human capital development in Nigeria, the study did not examine its implication on educational standard.
3. Research Method
In this study, we present the pattern of education expenditure, available academic staff in relation to student enrollment and its implication on educational standard. To do this, the descriptive approach (simple percentage) is adopted. Data for analysis were generated from various sources such as [31, 32 and 33]. In Nigeria, educational expenditure is undertaken by the three levels of government - federal, state and local in conjunction with the private sector and external stakeholders.
One of the means through which government adopts in financing education is the annual budgetary allocations that are distributed as subventions or grants to different levels of education as can be seen in Table 1. The table shows that Federal budgetary allocation to education rose from N 15.4 billion in 2003 to N75.8 billion in 2012. However, the pattern of allocation as a percentage of the total budget revealed that it was inconsistent. In the period, the Federal government's expenditure has been below 12 percent on its overall expenditure on the average, and the trend being largely downward. This is more worrisome when Nigeria's allocation to education is compared with that of other less affluent countries in Africa as depicted in Table 2. About 8 percent of the nation's annual budget is allocated to education while Angola, Ghana, Kenya allocates 4.9 percent, 4.4 percent, and 6.5 percent respectively to the same sector. This is a far cry of 26 percent allocation to education as recommended by UNESCO. Table 3 on state funding of education shows an absolute mean share of 18 percent in 1999, and the continuous fall in the share of education in the state budgets. The Table further shows that on the average state government spent more money on the secondary school level of education than the primary, tertiary and university levels of education combined and this has been declining in most states.
Beside Federal and state government allocations, another major source of education financial in Nigeria is the payment from Education Tax Fund (ETF) and this fund is geared towards capital projects in the three levels of education in the country.
A critical analysis of Table 4 shows that the disbursements to the education sub-sectors decreased from N8,598 million in 1999 to N3,842.1 million in 2002. It however increased in subsequent years to N7, 182.4 million, N9,0514 and N11,9551 in 2003, 2004 and 2005 respectively. It declined marginally to N11,935.7 in 2006. The Table further revealed that the tertiary education rank highest in terms of allocation followed by primary school level and then the secondary school level of education. This implies that the yearly allocation and disbursements to education sub-sectors did not follow any pattern, an indication of the fact that there was no set standard in both allocations and disbursement; a pointer to neglect on worsening state of education and its financing in Nigeria.
Table 1. Federal government expenditure on education as a share of total federal expenditure (1996-2006).
2003 2004 2005 2006 2007 2008 2009 2010 2011 2012 2013
Total allocation 15.4 16.8 23.7 27.8 56.6 62.5 69.0 69.2 72.6 75.8 72.9
%of Total Budget 10.8 11.5 9.61 11.1 8.7 7.0 5.9 6.0 6.6 14.8 14.0
Source: Central Bank of Nigeria (CBN) Statistical Bulletin, various years
Table 2. Expenditure on education as percentage of GDP for selected African countries.
Country Angola Cote d’ivore Kenya Malawi Mozam-bique Nigeria South Africa Uganda Ghana
% of GDP 4.9 5.0 6.5 5.4 4.1 0.8 7.9 2.6 4.4
Table 3. Share of selected state government education expenditure by level of education in selected states (%).
Education sub-sector Enugu Delta Rivers Niger Ekiti Borno Benue Plateau Average
University 75.0 20.1 18.3 3.8 10.4 9.0 22.2 10.0 9.35
Tertiary 30.3 50.2 21.4 16.6 13.0 25.8 15.3 12.8 24.4
Secondary 52.7 83.2 50.6 65.8 66.2 69.1 50.2 83.9 65.2
Primary 17.0 14.0 97 13.8 10.4 5.0 11.9 3.3 10.6
Source: World Bank, 2014
Table 4. ETF allocations and disbursements by level of education (N million).
Year Tertiary Secondary Primary Agencies of education Total
1999 4,291.8 657.0 3,117.6 532.0 8,598.5
2000 1,876.1 698.7 1,0106 5882 4,165.1
2001 1,624.3 1,112.0 1,111.9 252.9 4,688.2
2002 1,587.4 1,087.2 572.0 1,405.4 3,842.1
2003 2,778.5 1,099.1 1,200.0 2,116.7 7,182.4
2004 3,842.1 2,04.13 1,926.0 2,184.2 9,0514
2005 4,265.1 2,137.0 1,800.6 3,848.1 11,955.1
2006 4,665.1 2,137.0 1,841.8 3,241.8 11,935.7
Total 24,930.4 9,109.5 12,580.5 14,219.3 60,839.7
Sources: (i) Education Tax Fund Annual Repot 2013 (ii) Federal Ministry of Education
In relation to the pattern of education expenditure, we analyze of the impact of education expenditure on manpower needs of selected subjects and disciplines and examine its implication on the educational standard.
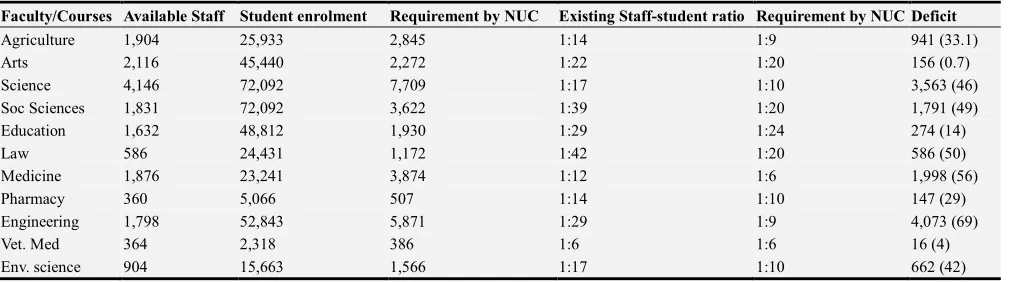
Table 5 reveals the dearth of academic staff in Nigeria Universities in the selected disciplines which is more pronounced in engineering where there is a shortfall of 69 percent and medicine with 56 percent. In Agriculture, there is deficit of 33 percent, Environmental Sciences 42 percent, Social Science 49 percent, Sciences 49 percent, Law 50 percent, Education 14 percent with Arts having the least shortage of 7 percent. As further depicted in Table 5, apart from the shortfalls of staff, existing staff-student ratios reveals that it was only Veterinary medicine and Arts that near the NUC requirements while Engineering tripled the NUC standard ratio.
On teachers in entrepreneurship, vocational and technical subjects at the secondary schools, Table 6 present the annual
production rate and the number of years needed to meet the meet the required number of teachers.
Table 6 reveals that the shortfall in qualified teachers for Commerce, Business Methods, Agriculture Science, Home Economics, Food and Nutrition, Home Management, Clothing and Textile and Introductory technology. It is therefore not, surprise that among the targeted disciplines in the universities, the shortage of manpower was not noticeable in the agricultural sub-sector. A critical look at Table 6 shows that there existed a yawning gap between demand and supply in manpower and this explains why the duration of meeting the shortfall were alarming. For instance, centeris paribus, it will take 41 years, 7 years, 48 years, 44 years, 86 years, 12 years, 16 and 38 years to produce the required number of teachers in Commerce, Business Methods, Agriculture, Home Economics, Food and Nutrition, Home Management,
Clothing and textiles and Introductory technology
respectively.
Table 5. Students enrollment in relation to available academic staff in Nigeria universities.
Faculty/Courses Available Staff Student enrolment Requirement by NUC Existing Staff-student ratio Requirement by NUC Deficit
Agriculture 1,904 25,933 2,845 1:14 1:9 941 (33.1)
Arts 2,116 45,440 2,272 1:22 1:20 156 (0.7)
Science 4,146 72,092 7,709 1:17 1:10 3,563 (46)
Soc Sciences 1,831 72,092 3,622 1:39 1:20 1,791 (49)
Education 1,632 48,812 1,930 1:29 1:24 274 (14)
Law 586 24,431 1,172 1:42 1:20 586 (50)
Medicine 1,876 23,241 3,874 1:12 1:6 1,998 (56)
Pharmacy 360 5,066 507 1:14 1:10 147 (29)
Engineering 1,798 52,843 5,871 1:29 1:9 4,073 (69)
Vet. Med 364 2,318 386 1:6 1:6 16 (4)
Env. science 904 15,663 1,566 1:17 1:10 662 (42)
Note: Figures in Parenthesis are percentage deficit in the number of teachers.
Table 6. National shortfalls of secondary schools teachers in Nigeria, 2004.
Subject Total shortfall Annual production rate Estimated Number of years needed to meet the shortfall
Typing 10,982 NA 41
Shorthand 2,656 NA NA
Bus management 246 NA NA
Prin of accounting 5,265 NA NA
Business methods 14,192 1,132 7
Agriculture 93,335 1.960 48
Home economics 42,951 968 44
Food and nutrition 2,954 30 86
Home management 846 69 12
Clothing/Textiles 296 18 16
Intro. tech 41,122 1,091 38
Computer practice NA 498 NA
Source: Aigbokhan, Imahe and Ailemen (2003)
Table 7. Performance of pupils in numeracy and life skills, 2014.
MLA Domain Percentage mean score
Sex Type of residence Type of schools National Male Female Urban Rural Public Private
Numeracy 30.2 12.2 30.8 40.8 38.2 38.2 52.1
Life skills 30.6 2.6 32.2 32.2 28.4 30.1 42.2
Source: CBN 2014
4. Implication on Educational Standard
When related to educational standard, available statistics reveals that the shortage of manpower has affected performance of pupils in primary and secondary education. One critical area in this regard is on the acquisition of numeracy and life skills by student. This is presented in Table 7.
As can be observed, while there are significant difference in the performance of students in either sex, students in private schools performed better than those in public schools and students in urban area did better than their counterparts in the rural area. At the national level, the mean scores on the numeracy and life skills tests were 30.2 percent and 30.6 percent respectively. As noted by [34], the reasons for the low performance has very little to do with the curriculum, it is the delivery of the curriculum that is the main challenge. Consequently, wide gaps exist between the contents of the curricula and classroom teaching, with the attended consequence that students are not attaining the desired level of knowledge and skills needed.
The correlation between numeracy and life skills as was further determined as follows: Given a set of data {x1,...,xn}
containing n values and another set {y1,...,yn} containing n
values, then the formula is given as:
= = ∑ − −
√∑ − 2 √∑ − 2
Note that (Xi − X) (Yi − Y) is positive if and only if Xi and
Yi lie on the same side of their respective means. Thus the
correlation coefficient is positive if Xi and Yi tend to be
simultaneously greater than their respective means. Conversely, the correlation coefficient is negative if Xi and Yi
tend to lie on opposite sides of their respective means. The
stronger is either tendency, the larger is the absolute value of the correlation coefficient. The estimates of the covariances and variances were substituted into the above formula based on a sample and the results shows that there is positive relationship in numeracy and life skill for male and female, urban and rural as well as public and private schools. With respective correlation coefficient of 0.14, 0.17 and 0.15, the implication is that as the performance of the male and female students in numeracy improves, chances are that their life skills will also improve. This is true in terms of residency and type of school.
5. Conclusion
The basic analysis carried out in this study reveals that expenditure on education has been inconsistent and did not show much positive impact on the overall education standard in Nigeria. The interrelated threats can be seen in the mismatch between supply and demand the manpower needs in the country. Beside, overall financial involvement by the different levels of government in Nigeria has not been encouraging, and that the quality of education has been severely impeded by financial constraints. In view of the above, there is urgent need to do the following:
(i) Firstly there is need to improve funding of education and this can be achieved by giving greater proportion of the Nations budget to education. Further expenditure on education should be well monitored. (ii) To complement the efforts of the government, the
private sector should assist in the form of financial and material dominations, and collaborate with institutions of higher learning to assist the primary and secondary schools to improve their teaching standard.
production rate of needed manpower needed in the critical sectors of the economy.
References
[1] Psacharapoulos, G and H. A Patrinos, Returns to Investment in Education: A Further Update. World Bank Policy Research Working Paper. 2002; No 2881.
[2] World Bank, World Development Report Washington D. C. 1998; World Bank.
[3] Birdsall, N, O. Ross and R Sobot, “Underinvestment in Education: How much Growth has Pakistan forgone”. Pakistan Development Review, 1993; (32): 453-499.
[4] Jung, H. S and E. Thorbecke, The Impact of Public Expenditure on Human Development and Poverty Reduction in Tanzania and Zambia: A General equilibrium Approach. Journal of Policy Modeling. 2003; 25 (8): 701-725.
[5] Bollag, B, Nigerian Universities start to recover from years of violence, corruption and neglect, the chronicle of Higher Education. 2006; February.
[6] Ogefum, S and E. Olisa, Half-baked Teachers, Bane of Education woes. 2001; The vanguard, Online, July.
[7] The Guardian, 1999, Online: May 6.
[8] World Bank, Public Expenditures on Education in Nigeria: Issues. Estimate and some implications. 2014; Washington D. C. World Bank.
[9] The Guardian, 2016; Online: August 7.
[10] Dike, V, The Universal Basic Education Program: Educating the Educators in Nigeria. 2000; http://www.Nigeriaworld.com, July 14.
[11] Anya, A. O, The Dreams, Vision and Myth of Nigerian Reality. 2007; The Guardian Online June 19.
[12] Alfred M, Principles of Economics (8th Edition). 1930; London Macmillan Company Limited.
[13] Smith, Adams, The Wealth of Nations Reprinted Ed. 1976; Chicago It: University of Chicago Press.
[14] Ekpo, A. H, Pattern of Public Expenditure in Nigeria 1960-1992. In: Economic Reform and Macroeconomic Management in Nigeria, Ariyo (Ed). 1996; Ibadan University Press.
[15] Borisade, A. B, Keynote address by the Minister of Education at the forum on Cost and Financing of Education in Nigeria, Education Sector Analysis (ESA). 2002; September 17-19, Abuja Nigeria.
[16] World Bank, World Development Report: Washington D. C. 1980; World Bank.
[17] Adamu, P. A, The Impact of Human Capital on Economic Growth in Nigeria. In: Human Resource Development in Africa. Nigeria Economic society Annual Conference. 2002; Ibadan NES.
[18] Moock, P. R. and Jamison, D. T., Educational Development in Sub-Saharan Africa Finance and Development. 1998; March.
[19] Hill, M. A. and king, E. M., Women education in the Third World: An overview. In: Women Education in developing countries Barriers, Benefits and Policy. King E. M. and Hill, M. A. (eds) Washington D. C.: 1991; The World Bank.
[20] Ehusani G, The Plight of Education and the Status of Teachers in Nigeria: Issues and Challenges. Paper Presented at the forum on the Cost and financing of Education in Nigeria, Education sector Analysis (ESA). 2002; September 17-19 Abuja.
[21] Todaro, M. P, Economics for a Developing World (3rd ed), 1986; New York Longman.
[22] Mincer, J., “Education and Unemployment” In: Studies in human capital. Jacob Mincer (eds). 1991; Cambridge, U. K. Edward Elgar Publishing.
[23] Long, R. S., Investment in Nigeria Education: Relevance Quality and Government at the eve of the third millennium. An Inaugural Lecture University of Ibadan. 1999.
[24] Howe, W. J., The Effect of Higher Education and Economic Growth in the United States: In: Higher Education and Economic Growth. Willim E. BEEKE AND Darrei E. Lewis (eds). 1993; Boston. M. A: Kluwer Academic Publisher.
[25] Umoh, J. U., Education Employment Connection in the Nigerian Experience Nigerian Journal of Economic and Social Studies. 1985; 22 (1).
[26] Behrman, J. R and B L Wolfe, Investment in Schooling in two generations in pre-revolutionary Nicaragua, Journal of Development Economics. 1987a; 27.
[27] World Development Indicators (WDI), 2016, World Bank, August.
[28] Groomsman, M., The correlation between Health and Schooling in Household production and Consumption Notional Bureau of Economic Research. 1976.
[29] Adedeji. S. O, Cost and financing of Education in Nigeria: The Historical perspective. Paper presented of the Forum of Cost and Financing of Education Nigeria, Education Sector Analysis (ESA) September. 2002; 17-19 Abuja Nigeria.
[30] Aigbokhan, B. Imahe, O. J and Ailemen M. J., Education Expenditure and Human Capital Development in Nigeria: Any Correlation so for? 2003.
[31] Central Bank of Nigeria, Annual Report and Statement of Account. 2004.
[32] Central Bank of Nigeria, Statistical Bulletin, Abuja CBN. 2014; December.
[33] National Universities Commission. 2014 Abuja.