SYSTEM SCALE ANALYSIS OF ROAD INFRASTRUCTURE TO
ESTIMATE NETWORK VULNERABILITY
Árpád Török1
1Department of Transport Technology and Economics, Budapest University of Technology and Economics, Budapest, Hungary
Received 29 May 2018; accepted 25 October 2018
Abstract: This paper aims to evaluate the Hungarian road infrastructure from a sensitivity point of view, regarding the effect that a given element can have on the average value of the shortest paths and the maximum flow among nodes. Based on the defined values of the average growth of shortest path distances and of the maximum flow indicator it is possible to select those infrastructure components of the Hungarian road network which can have the most significant effect on network vulnerability. Improving these weak points of the infrastructure system can result a more secured and more stable network.
Keywords: network robustness, road infrastructure, vulnerability, shortest path, maximum flow, network safety.
1 Corresponding author: [email protected]
1. Introduction
The objective of this ar ticle is the identification of the elements of the core road network considered as critical from the aspects of external effects - such as emergencies arising due to natural disasters - hindering the proper the operation of the road network. In this paper critical infrastructure defined in line with the international definition provides services in a territory and enable people to be mobile (Procházková, 2010). This objective is strongly connected to the basic theory of resilience. The definition of resilience is applied in wide range of scientific fields from engineering to psychology and economics (Torok, 2016). Among others, the general importance of the article written by (Andrić & Lu, 2017) is that it defines infrastructure resilience related to the field of transportation
infrastructure. (Andrić & Lu, 2017) define resilience based on technical and structural role of bridges and integrates this approach a Fuzzy based seismic evaluation model. Accordingly, resilience is interpreted in the recent study as the ability of a system to return its baseline state (Andrić & Lu, 2017).
Zhang W. and Wang N. in their article publ i shed i n 2 016 i nt roduced t he methodology of weighted independent pathways as an outstanding improvement of the independent pathways’ model (Zhang
based on flow-like parameters, but based on the effect of eliminating certain edges on changes in free travel time and max-flow capacity values. The main difference between the two concepts that smaller but more frequently occurring network disturbances makes it categorically necessary to consider traffic, since changes in traffic structure or traffic flow re-routing processes caused by a e.g. a traffic accident can often result in traffic congestions and in the reduction of overall network capacity. Contrarily in case of less frequently occurring high-risk disruptive network events the main question is how fast and how many rescue units can reach the disaster area on the network. In this case - based on our previous experiences - the changes in traffic structure or traffic flow re-routing processes caused by the high-risk disruptive network event is less crucial, since for instance in case of an extended earthquake, general transport demands (e.g. commuting, delivery, shopping, etc.) are not expectable to occur.
In the course of reviewing the most important articles related to the recent topic it is necessary to mention the publication of Dunn and Wilkinson from 2012 (Dunn
et al., 2012), since in their paper critical components were analysed based on a special approach originated in the basics of hydrodynamics. In the article, authors compared their result with other models (Barabas et al., 2000) investigating network resilience and their found strong correlation among the final results. However it is important to emphasize that the metrics characterizing network resilience in these articles have been aiming primarily to qualify overall ability of a certain system to return its baseline state instead of describing the effect of the damage on individual components. It is also necessary to mention here that
high-risk disruptive network events do not belong tightly to the core topic of these articles.
The paper (Bell et al., 2017) introduces the possibility to define network bottlenecks based on spectral analysis. The special methodology presented in the article basically serves the definition of the overloaded part of a network related to normal operation conditions of a network, so the paper does not investigate the topic of characterizing rescue processes in case of a disruptive network event.
(Bhavathrathan et al., 2015) analysed the uncertainty of roadway capacity. According to their research results road network can be deemed to operate at different capacity levels depending on uncertainty of roadway capacity. As an illustrative example on the applicability of their model, (Bhavathrathan et al., 2015) compared the calculated unique travel time with the best possible travel time on the network, and develop a metric for network resilience. (Zhang et al., 2015) focused on theoretical aspects of network resilience and analysed 17 basic graph formation. In their study comprehensive and systematically designed numerical experiments were conducted on 17 network structures with some relation to transportation system layout. Resilience of these network structures in terms of throughput, connectivity or compactness was quantified. (Chan et al., 2016) considered studying the redundancy of roads in a given road network during emergency situations.
a risk, as well as the identification of the so called critical elements that affect the availability of the complete network the most. With an explicit focus on the identification of vulnerable elements of the road network, (Leal et al., 2014) analysis goes further than just an examination of general network considerations. (Luathep et al., 2013) made a direct estimation of the effects disasters and unexpected natural phenomena exercise on road networks. This shows that methods used for identifying weak points in the road network have been extensively examined in international professional literature, however, there is lack of detailed researches discussing the relationship of vulnerability of network elements and the available capacity for emergency services hence the aim of this paper is to introduce a model framework suitable for describing the effect of network damage including emergency capacity reduction especially considering model applicability and adaptability to the Hungarian system-environment.
To conclude in the literature both network v ulnerabilit y and resilience mostly investigated based on traffic or f low like factors assuming that in case of an operational disturbance the most important objective from the system’s point of view is to restructure traffic flow levels and make the system to approach baseline performance of the network again. Instead of this, recent paper discusses vulnerability of network elements with investigating elementary components. Besides these, this research has investigated the network based on free travel time and max flow capacity values assuming that in case of a high-risk disaster-like network effect, the most important objective from the system’s point of view is to organize rescue processes in the affected areas and to minimize unfavourable effects
of the occurred event. This approach explains why author has ignored applying “flow” element in the study and why it has not been a key issue during the research to capture representative traffic f lows (Pauer et al., 2017). Unfortunately real life has underpinned author’s assumption by the events for the past several years. In 15.13.2013. extreme weather events have occurred in Europe and in Hungary as well, besides, in 04.10.2010 in Ajka, Hungary has been occurred the aluminium plant accident. Both of the unexpected high-risk events had significant effects on the functionality of the road network however they did not primarily induce unexpected congestions on the network, but significant reduction in road capacity and increased travel time for rescue and disaster recovery works.
The first part of the article describes the structure of the analysis-model. Then it moves on to the introduction of the applied procedures, finally, the results are evaluated in the last part.
2. Methodology
total length of the complete Hungarian road network except municipality roads is 31.805 km and the sum of the length of highways, primary main roads and secondary main roads is 8.306 km. However it needs to be emphasized that about 70% of the daily traffic go through on the sub-network covered by the model.
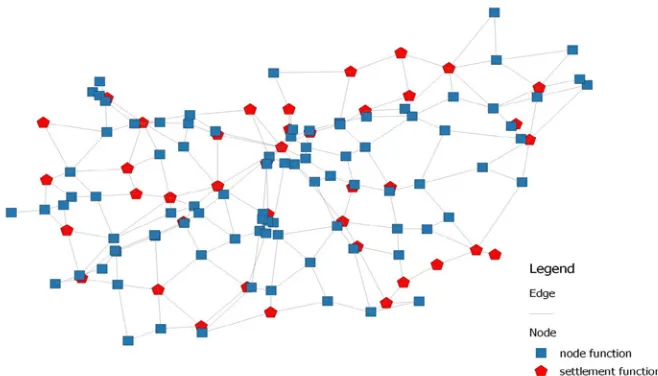
In the course of the network definition process it has been considered that an actualized, up-to-date, topologically appropriately connected Hungarian road network graph is reasonably costly. Besides, actuality and topological appropriate connectivity of a freely available road network graphs is not ensured and its correction requires outstanding performance compared to the available resources of the project. Since the main objective of the model has been to estimate the changes in travel time and maximum flow values on the network, it has been also needed to be considered that a geographic based road network graph - from a network vulnerability point of view - contains many unnecessary components, e.g. the series of short lines describing curve shape, motorway ramps etc. In light of the problems related to the application of an existing graph; establishing a simplified road network graph, with intent to minimize the loss of useful information seemed to be an effective solution. Therefore, author has defined the cities with the forty largest number of inhabitants as road network- and settlement function nodes, whereas the highways, and the primary and secondary road elements of the road network were defined as segments representing the edges of the graph. Considering the above, the graph is built up from 131 nodes and 236 edges.
As discussed above, the available limited resources of the project have had not made it possible either to reach the expensive official
Hungarian network database or to correct an unofficial open access network. The reason why the number of the investigated nodes has needed to be constrained because there is a quadratic relation among the number of investigated nodes and the number of steps of the evaluating algorithm. Besides this, the number of steps of the shortest path algorithm depends also on the second degree function of the number of nodes. During the development of the pilot model MathWorks MATLAB environment has been applied. For instance in case of the introduced model network; the evaluating algorithm had been running Intel® Core™ Duo CPU T2250 1.73 GHz 4 GB R AM laptop for 98 minutes.
Besides, it has also strengthened the idea of strongly constraining the extension of the graph that it is an important development orientation to analyse the damage on combinations of edges to estimate aggregated effects which also results a multiplied increase in the number of evaluation steps. Considering these conditions the principle of applying a network constructed from a rationalized number of nodes has been defined as basic objective of the research.
suggested in the further development stages, however the recent state of the network model makes it already possible to verify
its applicability. In accordance with this, the main results of the development phases are qualified to be acceptable.
Fig. 1.
The Structure of the Applied Graph to Represent Road Network Source: own edition
The reviewed analyses (Leal et al., 2014), (Luathep et al., 2013) evaluate the effect of road network damages on the traffic structure, therefore, these methods are mainly applicable to estimate the capacity reduction and traffic re-routing caused by the damages of a given edge.
To start with, author aimed at establishing how the relative distances of the network points change when one of the network elements suffer a damage. The reason for this is that our analysis is confined to the domestic network and the traffic on the major percentage of the national road network does not come close to the capacity limit. Additionally, in the case of a real disaster,
the demand for restoration, disaster-combat and evacuation gains priority, as opposed to everyday traffic demands. At the same time, the regular traffic (commuting to work, traveling for any other reasons) will most probably significantly decrease, especially with regards to the nationwide network (Monzon et al., 2013).
distances and capacities suits better to the objectives of improving the efficiency of damage mitigation.
Considering the objectives of decreasing computation demands, my analysis is confined to the examination of relative distance-changes of nodes with both road network hub- and settlement function. The distance between the examined nodes is estimated using Dijkstra’s algorithm.
The examined graph is G=(V,E,s,c), where V=(v_0,…,v_(N-1) is the set of the graph nodes, E≤V2 is the set of the edges of the
graph, s≤V is the starting node, and the weight function characterizing the edges is c:E→N. The logical function responsible for the representation of the assignment is named Bn, and it is described as f:{0,1} n→{0,1}. The character i of a binary number
x {0,1}n is marked as and its value is
. According to the above presented considerations, G can also be put as the logical function χE B2n, which
projects the binary node pairs
if and only if and .
The algorhythm handles the input data in the form of the functions C(x,y,d) and s(x).
(1)
The output function of the algorithm is dist:V→N0 {∞}, which assigns the length
of the shortest route between nodes v and s to the node v V.
(2)
T he leng th of the temporar y route connecting nodes v and s is represented
by the equation , which is
involved in the algorithm by the function D(x, d). Its value is updated until it is equal to the value of .
The set contains those v nodes, in the case of which the shortest route between nodes v and s is known. At the
start, , and in case of all
nodes where . In every
iteration step one node is added to A .u is the last node added to the set A. In the case of every (u, v) edge it should be checked
whether is true and if
it is, shall be updated with the value of . After this is assigned to A The algorithm stops running if the actual values of the function are equal to the value of . (Sawitzki, 2004).
Network damages has been modelled by eliminating individual nodes and
edges from the graph, by running the algorithm with the input functions C(x, y, d) and s(x) with the output function DIST(x, d), with the input
parameters in any case
of , and with the input parameters in any case of
, with regards to all node pairs. As a result of this algorithm, the value of changes in node distances caused by the damages of
nodes and edges become
available for all st node pairs.
According to the main objective of the algorithm, as long as complete routes wit free capacity are available from the starting node to the destination node , the process continues to load additional traffic flow on these routes.
The examined graph is G = (V, E, s, t, c).
where is the set of the
graph nodes, is the set of the edges of the graph, is the starting node, is the destination node and the weight function characterizing the edges is
. Bn is responsible for the representation of
the assignment . The i-th
character of a binary number is referred to as xi and its value is . According
to the above presented considerations, G can also be put as the logical function , which projects the binary node
pairs if and only if
and . The algorithm handles
the input data in form of the functions C(x, y, k), s(x) and t(x).
(3)
The output functions of the algorithm
are the functions flow: and
. Under the function the maximum flow between the nodes s and t, loaded on any edge is understood.
(4)
During the iteration steps, the flows loaded on the edges of the route connecting nodes s and t are projected by the function , which is represented by the function D( x, y, k) in the algorithm. It’s value is updated until it is equal to the value of flow.
The set contains the nodes
with regards of which the capacity of the route connecting nodes s and t is full. At the start, ={ }, and in
the case of all routes,
. In every iteration step a new route connecting s- and t is added to A-hoz, this way increasing the flow of the
route by the p minimum
available capacity at the edges.
Is the last route added to the set . In the case of every edge
of the it should be checked
whether is
true and if it is, all values of the examined route shall be updated with the
value of . Then set is
expanded. The algorithm stops running if the actual values of the function are equal to the value of .
The algorithm with the input functions C(x, y, k), t(x) and s(x) and with the output function FLOW(x, y, k) is run with regards of all node pairs. The outcome is the estimated maximum throughput capacity between every node pair that is available for the disaster control and the emergency response crews.
3. Results
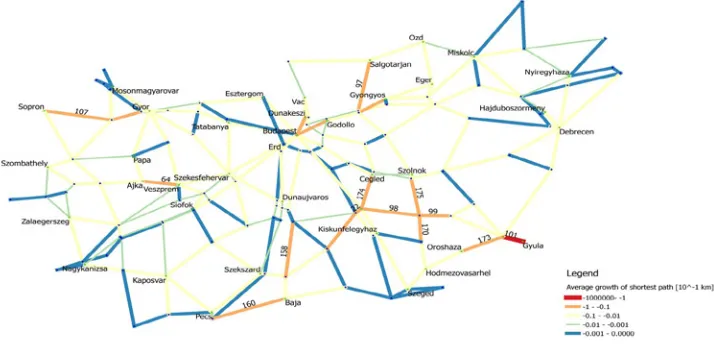
the sub-set, whereas the other graph part is created by the elimination of edges built from the supplementary of the aforementioned sub-set of the full graph, connecting to hubs not forming part of the sub-set. The effect of the damages suffered by the edges connecting the created graph part pairs is inversely proportional to the number of alternate routes with joint edges between the members of the graph part pairs, and to the number of the shorter - compared to the length distribution of the edges of the full graph - alternate routes connecting the members of the graph part pairs. This hypothesis is backed up by the example of edge no. 101, connecting a settlement forming an independent graph part (Gyula) and its graph part pair as the only edge, and which - based on the analysis - can in fact be considered as a critical network element.
Based on the results, it can also be established that the damages suffered by edges forming part of the shortest route between nodes with settlement functions have significant adverse effects on the network’s operation.
The foreseen extent of the effect of an edge damage is proportional to the number of shortest routes between nodes with settlement function it forms part of, and to the length of the secondary alternate routes appearing due to the damages of the edge.
This theory is supported by the example of the edge no. 64, which forms part of the shortest route between several settlements, moreover, it connects adjacent cities (Ajka and Veszprém), and, based on the analysis, is in fact identified as a critical network element.
Fig. 2.
Table 1
Average Growth of Route Distances Among Nodes due to Elimination the Given Edges of the Network (Highest 15 Value)
ID of eliminated
edge Av. growth in sum of shortest path [10-1 km]
101 3193.73
92 0.36
64 0.29
158 0.25
22 0.23
162 0.20
173 0.19
97 0.17
160 0.17
175 0.13
107 0.12
174 0.12
109 0.10
98 0.10
99 0.10
Source: own edition
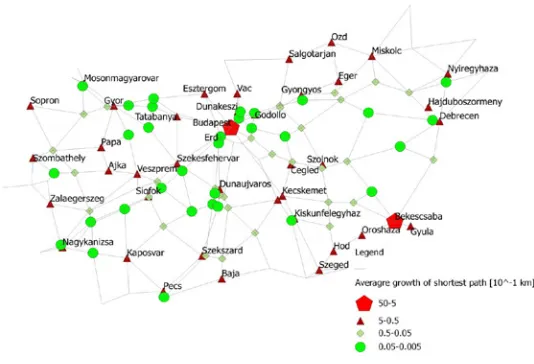
Through modeling the network damages by eliminating the nodes I established the mean value of the distance changes between nodes, with regards to the node. Based on the above, it can be concluded that the connection between the aforementioned graph part pairs is worth of special attention during the peak-point eliminating process. The effect of the damages of the nodes connecting the graph part pairs is inversely proportional to the number of alternate routes with joint edges between the members of the graph part pairs, and to the number of the shorter - compared to the length distribution of the edges of the full graph - alternate routes connecting the members of the graph part pairs. This hypothesis is backed up by the example of node no. 22 (Békéscsaba) connecting a settlement forming an independent graph part (Gyula) and its graph part pair as the
node of an only edge, and which - based on the analysis - can in fact be considered as a critical network element.
Fig. 3.
Average Growth of Route Distances Among Nodes due to Eliminating the Given Nodes of the Network Source: own edition
Table 2
Average Growth of Route Distances Among Nodes due to Elimination the Given Nodes of the Network (Highest 15 Value)
ID of eliminated
nodes Av. growth in sum of shortest path [10-1 km]
22 11.17
1 6.00
36 4.12
28 4.10
29 4.03
23 3.92
26 3.80
20 3.78
30 3.70
34 3.65
21 3.63
39 3.63
31 3.63
24 3.57
40 3.54
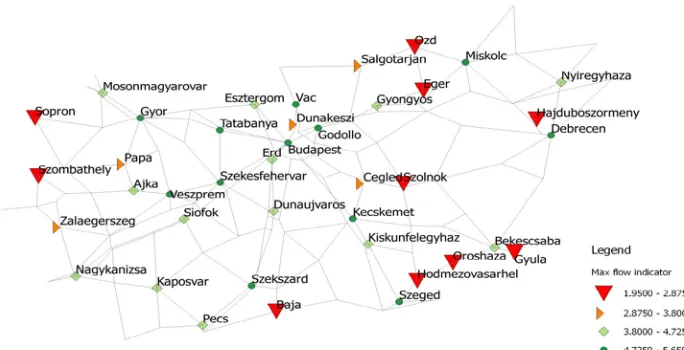
In order to estimate the road infrastructure capacity available for the emergency response crews, based on the road category values, I have allocated relative capacity values to the network elements. With the application of the relative capacity values I aimed for the identification of critical graph elements by comparing the capacity of the graph parts, as well as for the validation of the applied procedure, so the exact capacity value with regards to the vehicle unit number and the time period was not necessary. For the estimation of the relative capacity values I used the exact values recommended by the Highway Capacity Manual. The relative capacity values of the smallest capacity edges (secondary main roads) were taken as 1, and I established the aggregated relative capacity values representing the estimated throughput capacity of higher priority road categories (highway no. 5, primary main road no. 2).
Using the road infrastructure capacity available for the emergency response crews I established the estimated maximum flow volume figures between node with both hub- and settlement functions.
Based on the results it can be conclude that the infrastructure capacity available for the emergency response crews from the nodes with both hub- and settlement functions is proportional to the number of alternate routes with shared edges, connecting the node to the rest of the graph elements, and to the road category segments forming the part thereof. This theory is supported by the example of node no. 6 (Sopron), which is only connected to the network by two edges of the secondary road category, and, based on the analysis, the estimated maximum flow volume of this node is in fact the lowest.
Fig. 4.
Table 3
Average Value of Estimated Maximum Flow Indicator Among Nodes (Lowest 15 Value)
ID of eliminated nodes Av. value of max. flow indicator
6 1.95
21 1.95
23 1.95
5 2.85
20 2.85
27 2.85
34 2.85
35 2.85
36 2.85
39 2.85
7 3.575
8 3.575
14 3.575
33 3.575
40 3.575
Source: own edition
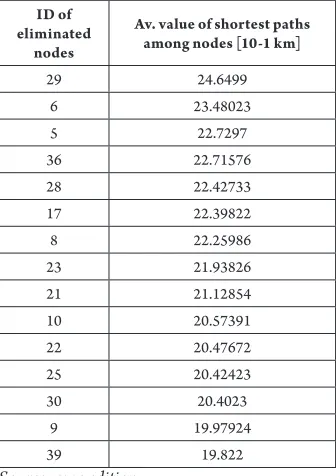
Based on the mean distance values between nodes, I have classified the nodes with both hub- and settlement functions. The result is demonstrated by the following figure. Due to the structure of the graph, some nodes - characteristically located at the outer edges of the graph - are further away from the rest of the nodes of the graph. The critical network elements connecting to the
nodes located further from the rest of the nodes should be paid special attention to, as an unexpected natural disaster can have a critical effect on the nodes and the adjacent network elements. In the light of this, an unexpected natural disaster striking the network elements in the region of nodes no. 6 (Sopron) and no. 23. (Gyula) could have a critical effect.
Fig. 5.
Table 4
Average Value of Shortest Paths Among Nodes (Highest 15 Value)
ID of eliminated
nodes
Av. value of shortest paths among nodes [10-1 km]
29 24.6499
6 23.48023
5 22.7297
36 22.71576
28 22.42733
17 22.39822
8 22.25986
23 21.93826
21 21.12854
10 20.57391
22 20.47672
25 20.42423
30 20.4023
9 19.97924
39 19.822
Source: own edition
4. Summary
The performed literature review let the author assume that most of the studies focusing on either the resilience or more rarely the vulnerability of a network, define a metric to characterize the whole network instead of investigating elementary components. Besides this, both network vulnerability and resilience are mostly investigated based on traffic or f low like factors assuming that in case of an operational disturbance the most important objective from the system’s point of view is to restructure traffic flow levels and make the system to approach baseline performance of the network again. Instead of this, recent paper discusses vulnerability of network elements with investigating elementary components. Besides this, this research
has investigated the network based on free travel time and max flow capacity values assuming that in case of a high-risk disaster-like network effect, the most important objective from the system’s point of view is to organize rescue processes in the affected areas and to minimize unfavourable effects of the occurred event.
In this article I have identified the road network elements considered as critical from the aspects of external effects - such as emergencies arising due to natural catastrophes - restricting the operation of the road network. In the analysis the road network has been examined as a graph, featuring 131 nodes and 236 edges.
algorithm for establishing the maximum flow-size, thus I identified the network elements which - in case they were damaged - can affect the operation of the network, and in the area of which the infrastructure available for the emergency response crews has less capacity than the rest of the network.
With the creation and the successful application of the methodology, the set research objectives were met, however, the applicability of the method could be further improved by additional development. In the next phase it is planned to change the geographical distance-based projection network to a representation based on travel times. Additionally, in the next step of the research, I will include the estimation of such traffic restructures resulting from the damage of individual road network elements (Junevičius et al., 2009), that are significant in the cases of system elements operating close to their capacity limits or in case of estimations of the effects of one or more network elements’ simultaneous damages. Finally, the main objective is the verification of conclusions regarding the damages of network elements mentioned in this article and the associated disaster management.
References
Andrić, J. M.; Lu, D. G. 2017. Fuzzy–based method for the prediction of Seismic Resilience of Bridges,
International Journal of Disaster Risk Reduction 22: 458-468.
Arun, A.; Velmurugan, S.; Errampalli, M. 2013. Methodological Framework Towards Roadway Capacity Estimation for Indian Multi-lane Highways, Procedia - Social and Behavioral Sciences 104: 477–486. doi:10.1016/j. sbspro.2013.11.141.
Baker, D.; Nateque Mahmood, M. 2012. Developing tools to support complex infrastructure decision-making, Smart and Sustainable Built Environment 1(1): 59-72.
Barabási, A. L.; Albert, R.; Jeong, H. 2000. Scale-free characteristics of random networks: the topology of the world-wide web, Physica A: statistical mechanics and its applications 281(1-4): 69-77.
Chan, J.; Teknomo, K. 2016. Road Reconstruction and Redundancy Analysis on the Road Network: A Case Study of the Ateneo de Manila University Network,
Procedia-Social and Behavioral Sciences 218: 56-75.
Dijkstra, E. W. 1959. A note on two problems in connexion with graphs, Numerische Mathematik 1(l): 269–271. doi:10.1007/BF01386390.
Dunn, S.; Wilkinson, S. M. 2012. Identifying critical components in infrastructure networks using network topology, Journal of Infrastructure Systems 19(2): 157-165.
Junevičius, R.; Bogdevičius, M. 2009. Mathematical modelling of network traffic flow, Transport 24(4): 333-338.
Leal, E.; Oliveira, D.; Porto, W. 2014. Determining critical links in a road network : vulnerability and congestion indicators, Procedia - Social and Behavioral Sciences 162(Panam): 158–167. doi:10.1016/j. sbspro.2014.12.196.
Luathep, P.; Suwanno, P.; Taneerananon, P. 2013. Identification of Critical Locations in Road Networks due to Disasters. In Proceedings of the Eastern Asia society for transportation studies, 9: 206.
Monzon, A.; Hernandez, S.; Cascajo, R. 2013. Quality of bus services performance: benefits of real time passenger information systems, Transport and Telecommunication
Pauer, G.; Török, Á. 2017. Static System Optimum of Linear Traffic Distribution Problem Assuming an Intelligent and Autonomous Transportation System, Periodica Polytechnica Transportation Engineering, in print.
Procházková, D. 2010. Critical infrastructure safety management, Transactions on Transport Sciences 3(4): 157-168.
Sawitzki, D. 2004. Experimental studies of symbolic shortest-path algorithms. Lecture Notes in Computer Science (including Subseries Lecture Notes in Artificial Intelligence and Lecture Notes in Bioinformatics), 3059(1126): 482–497. Available from internet: <http:// www.scopus.com/inward/record.url?eid=2-s2.0-24144480325&partnerID=40&md5=555820bdd2e5 8c4e9560bd2e9694b241>.
Sufyan, N.; Saqib, N.; Zia, M. 2013. Detection of jamming attacks in 802.11b wireless networks, EURASIP Journal on Wireless Communications and Networking 1: 208. doi:10.1186/1687-1499-2013-208.
Torok, A. 2016. Transport Infrastructure Role in Climate Resilience: A Case Study in Hungary, International Journal for Traffic and Transport Engineering, 6(2): 188-195.
Zhang, X.; Miller-Hooks, E.; Denny, K. 2015. Assessing the role of network topology in transportation network resilience, Journal of Transport Geography 46: 35-45.