MULTIMODAL CHOICE MODELING USING RANDOM FOREST
DECISION TREES
Ch.Ravi Sekhar1, Minal2, Errampalli Madhu3
1, 2, 3 Transportation Planning Division, Central Road Research Institute, New Delhi 10025, India
Received 11 May 2016; accepted 23 August 2016
Abstract:Mode choice analysis forms an integral part of transportation planning process as it gives a complete insight to the mode choice preferences of the commuters and is also used as an instrument for evaluation of introduction of new transport systems. Mode choice analysis involves the procedure to study the factors in decision making process of the commuter while choosing the mode that renders highest utility to them. This study aims at modeling the mode choice behaviour of commuters in Delhi by considering Random Forest (RF) Decision Tree (DT) method. The RF model is one of the most efficient DT methods for solving classification problems. For the purpose of model development, about 5000 stratified household samples were collected in Delhi through household interview survey. A comparative evaluation has been carried out between traditional Multinomial Logit (MNL) model and DT model to demonstrate the suitableness of RF models in mode choice modeling. From the result, it was observed that model developed by Random Forest based DT model is the superior one with higher prediction accuracy (98.96%) than the Logit model prediction accuracy (77.31%).
Keywords:mode choice analysis, household survey, MNL model, random forest decision tree.
1 Corresponding author: [email protected]
1. Introduction
Dealing with the present bottlenecks as well as creating long lasting and sustainable transport systems has been the greatest challenge of urban transportation planning. Calibrating the present need and forecasting the future demand is the underlying agenda of travel demand forecasting. Mode choice forms an integral part of this process as it gives a complete insight to the mode choice preferences of the commuters validating the introduction of new transport systems to existing ones. Mode choice analysis is the procedure to study the factors and decision making process of the trip maker and to be
Random Forest (RF) introduced by Breiman (2001), is an additional layer of randomness which is added to bagging. In addition to constructing each tree using a different bootstrap sample of the data, RF change how the classification trees are constructed. In standard trees, best split among all variables is used to split each node. In a random forest, each node is split using the best among a subset of predictors randomly chosen at that node. This technique performs very well compared to many other classifiers, including discriminant analysis, support vector machines and neural networks, and is robust against over fitting (Breiman, 2001). In the process of over fitting, the accuracy of model calibration will increase, while the performance during model validation for unseen data becomes worse.
Random forest is one of the most accurate and efficient algorithm of classification, especially for large data sets. It is capable of handling large number of input variables and generates an internal unbiased estimate of the generalization error as the forest building progresses (Breiman, 2001). RF consists of a large number of randomly constructed trees, each voting for a particular class. In this approach successive decision trees are grown by introducing a random element (such as random combination of a random selection of a few variables) into their construction. Thus, classification of mode choice is undertaken in this study using Random Forest Decision Tree (RFDT) method. The comparison of the performance of RF model is done with MNL model. The general challenge faced in modeling the mode choice model is that of data over-fitting. The most prominent advantage in using RF is that it does not over-fit the data (Breiman, 1999).
In this study the major modes of transport considered are private Cars, Two wheelers, Bus, Metro, Auto Rickshaw (Three wheeler, an Inter Para Transit used in India), and Bicycle. The travel behaviour data was collected for study through a household survey conducted in Delhi.
The paper is assembled as follows: section 2 gives a literature survey of the past studies of mode choice modeling by use of data mining techniques. Section 3 highlights the details of the study area and the data collection method employed for the study. Section 4 gives the theoretical background and algorithm of the MNL and Random forest techniques used in mode choice analysis. Section 5 represents the results obtained in mode choice modeling through MNL and Random forest and a comparison between the results of both.
2. Literature Review
applying AI methods to address some of the aforementioned problems in transportation engineering.
Random Forest is a generic principal of classifier combination problem that uses tree structured base classifiers (Breiman, 2002). This method is very unique among popular machine learning methods such as Artificial Neural Networks (ANN). The use of Artificial Intelligence techniques such as ANN in travel demand modeling began in 1960 and has been used in many transportation engineering studies (Dougherty, 1995). However it wasn’t used for about next three decades in such type of studies due to its limitations, namely the slow response to the modification of inputs despite its extraordinary success at learning or recognizing pattern. Neural networks have been used in the transportation demand forecasting for urban areas as well as intercity flows and has shown advantages in use for traffic behavioural analysis (Nijkamp et al., 1996; SubbaRao, 1998). Forecasting by ANN is done by minimizing an error term indicated as the deviation between input and output through the use of specific training algorithm and random learning rate (Black, 1995; Zhang etal., 1998). The theorem proved by Hornik (1989) and Cybenko (1989) states that a multilayered feed forward neural network with one hidden layer can approximately take any continuous function up to a desired degree of accuracy provided as it contains a sufficient number of nodes in the hidden layer, thus they can be considered as universal approximates. Xie et al. (2003) considered two data mining methods, namely learning tree algorithm and back propagation neural networks to improve the prediction accuracy of mode choice model. Karlaftis and Golias (2001) proposed a recursive partitioning methodology for
individual mode choice prediction. The methodology is based on tree-structured nonparametric classification technique. The application of RF has been adopted primarily for traffic accident analysis. Haleem et al. (2010) and Hossain and Muromachi (2011) used RF to understand the crash mechanism on urban expressways. Pande et al. (2011) has used RF to select variables of the crash risk estimation model. Application of RF in modeling commute mode choice was done by Hasegawa et al. (2012). Subsequently Hasegawa et al. (2013) modeled mode choice preference of the commuters by deploying a hybrid model of Random Forest and Genetic algorithm and compared it to MNL mode choice model demonstrating higher classification potential of this model.
3. Study Area and Data Collection
In this study, Delhi was chosen as the study area which has a population of 16.7 million people (Census of India, 2011) with a population density of 11,297 per square km. The public transport modes in Delhi form a strong network to cater to the needs of the people. Mobility of such dense population in a metropolitan city, which houses multiple offices, industries and manufacturing units, is a marathon task. To carryout mode choice analysis, collection of travel behaviour data was carried out through the traditional home based personal interview survey. Travel behaviour data has been collected through predesigned questionnaire which is aimed at providing the data to meet the objectives of the present study.
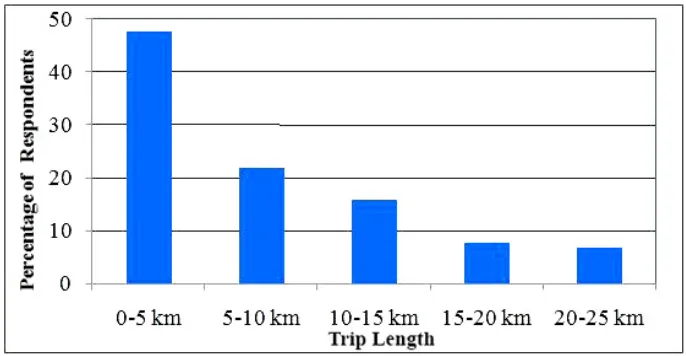
sampling. A total of 5000 household samples were collected from the study area, out of this 4976 sample were used in the analysis. Eight travel modes have been considered in this study namely Drive Alone (DA), Car (Private mode), Carpool (Shared mode), Two Wheeler (Private mode), Bus (Public mode), Metro (Public mode), Auto Rickshaw (IPT mode), Bicycle (Personal/ Non-motorized mode) and Walk (Non-motorized mode). From the data it was observed that the largest share of transport is driven by the purpose of making work trips (73%), followed by business, education and recreational trips. From the data, trips are distributed as per the distance as shown in Fig. 1 and it was observed that the average trip length to work place is 7.83 km. It was observed that the mode share for car is 36%, two-wheeler is 26%, bus is 19%, metro is 2.4%, cycle is 0.6%, Walk is 15% and Auto Rickshaw is 1%. The effect of age on mode choice is derived from
the data and was observed that the largest commuter share comes from the age group of 31 to 50 years. This dominant age group of commuters prefer private vehicle for their mobility with approximately 20%, 12%, 15% of them using drive alone car, two wheelers and bus respectively.
A total of 13 explanatory variables were used for mode choice model development are: Household size, Number of vehicles in household, Household income (Indian Rupees), Age of traveler (in years), Gender of traveler, Education Level, Type of employment, Possession of Driver’s License, Trip Purpose, In Vehicle Travel time for Motorized Vehicle (Minutes), Out of Vehicle Travel time (Minutes), In Vehicle Travel Time (Minutes) and Travel cost (Indian Rupees). Development and concept of mode choice model using Multinomial model and RF based decision trees is discussed in the following section.
Fig. 1.
4. Development of Mode Choice Model
MNL models, most widely used mode choice models are based on the principle of random utility maximization derived from econometric theory; while decision tree is a data mining technique deployed here for classification. A Random Forest Decision Tree (RFDT) method has been considered for modeling the mode choice preference of the commuters in Delhi. MNL mode choice model was also developed for the same data. A comparative evaluation has been carried out between Multinomial Logit (MNL) model and Decision Tree (DT) mode choice model. A total of 4976 sample were considered for model calibration for both MNL and DT model.
4.1. Multinomial Logit Mode Choice Model
MNL model is widely used disaggregate mode choice model, it estimates the proportion of trip makers who choose available mode types based on given conditions or based on utility criteria. MNL model is often used to compare with other techniques, due to its ability in analyzing the trip maker behavior (Hensher and Ton, 2000). MNL model has been considered in this study to model choice behaviour of commuters in Delhi. The mathematical framework of logit models is based on the theory of utility maximization (Ben-Akiva and Lerman, 1985). Probability of an individual “i” selecting a mode “n”, out of “M” number of total available modes, is given in Eq. (1):
(1)
Where, Vin is the utility function of mode “n”
for individual “i”,
Vim is utility function of any mode “m” in the
choice set for an individual “i”,
Pinis the probability of individual “i”
selecting mode “n”,
M is the total number of available travelling modes in the choice set for individual “i”. However certain drawbacks associated with MNL are: the Logit model uses maximum likelihood estimation method, which requires large sample size and there is restriction on dependent variable to be of discrete dataset. When it comes to large datasets, random forest decision trees handle large databases more efficiently with thousands of input variables and gives classification that is free from over fitting, a common drawback seen in logit models. Also, RFDT can handle data of any nature, i.e. discrete, continuous, or even data containing character values.
4.2. Random Forest Decision Trees
(RFDT)
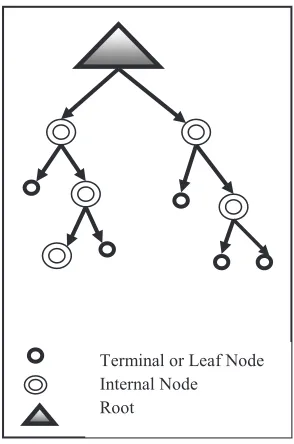
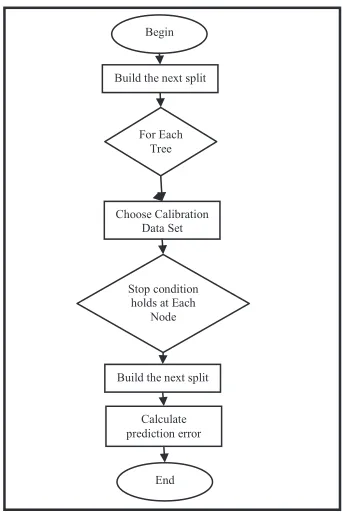
or gender. A decision tree starts from the root and moves downward. The starting point of the tree is called a “root node” while where the chain ends is known as the “leaf” node. Different branches can be extended from each internal node, as illustrated in Fig. 2. A node represents a certain characteristic while the branches represent a range of values (Ali et al., 2012). The algorithm of RF method is briefly discussed in the following. Let N be the number of trees to build. For each of N iterations the algorithm is briefly explained as follows and the algorithm explained through flow chart in Fig. 3.
• Selection of Sample Data: Sample data set
for model calibration is to be selected using bootstrap method. For each tree, a bootstrap sample of the same size as the calibration data is created by random sampling (with replacement) from the dataset.
• Growing the tree: The tree is fully grown
on this bootstrap using splitting rules. The tree is left un- pruned.
• Attribute selection: Only a random subset
of the available features of defined size is considered for each node
• Pruning is not performed and the tree is saved as it is. This tree can be deployed for classifying some other data.
• Output: The variable vector is supplied
as input to each of the trees in the forest where each tree gives a classification result (referred to as trees ‘votes’ for a class). The forest chooses the classification having the most votes (over all the trees in the forest). Overall prediction is given as majority vote (classification) from all individually trained trees.
Fig. 2.
Fig. 3.
Flow Chart for Random Forest Decision Trees
In this study, WEKA software (WEKA 6.3.9) (Hall et al., 2009) has been considered for performing the mode choice analysis using MNL and RFDT model and the results obtained by these models are discussed in the following section. A ten-fold iteration technique has been used for RFDT model for best possible solution (Kohavi, 1995).
5. Results and Discussions
The result of mode choice analysis in terms of prediction accuracy calculated from
Table 1
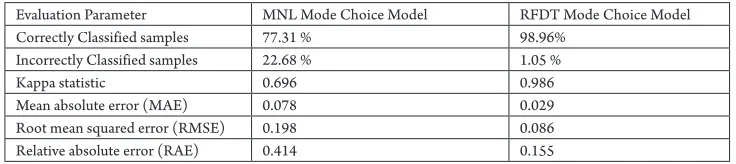
Summary of Results of MNL and RFDT Mode Choice Models in Model Calibration
Evaluation Parameter MNL Mode Choice Model RFDT Mode Choice Model
Correctly Classified samples 77.31 % 98.96%
Incorrectly Classified samples 22.68 % 1.05 %
Kappa statistic 0.696 0.986
Mean absolute error (MAE) 0.078 0.029
Root mean squared error (RMSE) 0.198 0.086
Relative absolute error (RAE) 0.414 0.155
Kappa statistics compares observed accuracy with expected accuracy (random chance). It is used not only to evaluate a single classifier, but also to evaluate classifiers amongst themselves by taking into account random chance. Landis and Koch (1977) proposed kappa values of 0-0.20 as slight, 0.21-0.40 as fair, 0.41-0.60 as moderate, 0.61-0.80 as substantial, and 0.81-1 as almost perfect. Thus based on this, the RFDT model shows almost perfect results with a kappa statistics value of 0.986. Considering the Mean absolute error, it is a quantity which is used to measure how close predictions are to the eventual outcomes. A lower value of mean absolute error implies better predictability on part of model. RFDT model attains a much lower value of 0.029 as compared to a value of 0.078 attained by MNL model.
RMSE is a quadratic scoring rule which measures the average magnitude of the error in prediction. A lower score of RMSE
is considered better. RFDT model depicts a lower RMSE value of 0.086 compared to a value of 0.198 of MNL model.
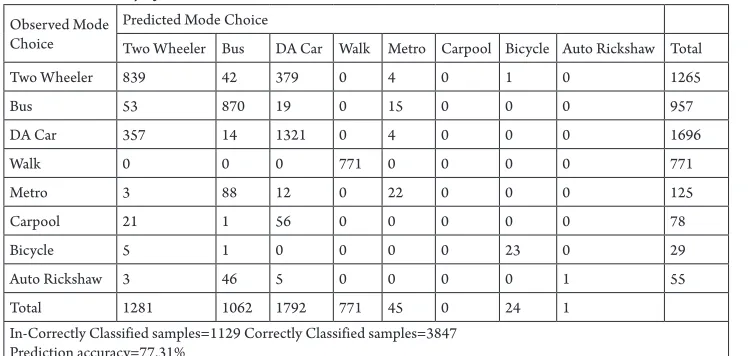
Table 2
Prediction Accuracy of MNL Mode Choice Model in Model Calibration Observed Mode
Choice
Predicted Mode Choice
Two Wheeler Bus DA Car Walk Metro Carpool Bicycle Auto Rickshaw Total
Two Wheeler 839 42 379 0 4 0 1 0 1265
Bus 53 870 19 0 15 0 0 0 957
DA Car 357 14 1321 0 4 0 0 0 1696
Walk 0 0 0 771 0 0 0 0 771
Metro 3 88 12 0 22 0 0 0 125
Carpool 21 1 56 0 0 0 0 0 78
Bicycle 5 1 0 0 0 0 23 0 29
Auto Rickshaw 3 46 5 0 0 0 0 1 55
Total 1281 1062 1792 771 45 0 24 1
In-Correctly Classified samples=1129 Correctly Classified samples=3847 Prediction accuracy=77.31%
Table 3
Prediction Accuracy of RFDT Mode Choice Model in Model Calibration Observed Mode
Choice
Predicted Mode Choice
Two Wheeler Bus DA Car Walk Metro Carpool Bicycle Auto Rickshaw Total
Two Wheeler 1255 1 9 0 0 0 0 0 1265
Bus 1 956 0 0 0 0 0 0 957
DA Car 22 0 1674 0 0 0 0 0 1696
Walk 0 0 0 771 0 0 0 0 771
Metro 0 4 0 0 121 0 0 0 125
Carpool 3 0 4 0 0 71 0 0 78
Bicycle 0 0 0 0 0 0 29 0 29
Auto Rickshaw 1 7 0 0 0 0 0 47 55
Total 1282 968 1687 771 121 71 29 47
In-Correctly Classified samples=52 Correctly Classified samples=4924 Prediction accuracy=98.96%
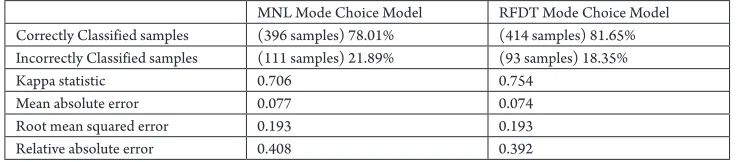
Validation of the two models was done by using 507 samples (approximately 10% of the data set). The validation results are
Table 4
Summary of Results of MNL and RFDT Mode Choice Models in Model Validation
MNL Mode Choice Model RFDT Mode Choice Model Correctly Classified samples (396 samples) 78.01% (414 samples) 81.65% Incorrectly Classified samples (111 samples) 21.89% (93 samples) 18.35%
Kappa statistic 0.706 0.754
Mean absolute error 0.077 0.074
Root mean squared error 0.193 0.193
Relative absolute error 0.408 0.392
6. Concluding Remarks
This study focused on the mode choice analysis of Delhi which is subjected to heavy congestion and air pollution due to high number of private vehicles plying on the roads. The data collection was done through a household survey in Delhi. A large household survey sample of 5000 responses was collected. A Random Forest Decision Tree (RFDT) mode choice model and a Multinomial Logit (MNL) mode choice model were developed. From the result, it was observed that model developed by Random Forest based Decision Tree model is superior with higher prediction accuracy (98.96%) than the Multinomial Logit model has prediction accuracy of 77.31%. Model validation was performed and results obtained show better performance of RFDT model over MNL model. RFDT model has a prediction accuracy of 81.65% and MNL model has a prediction accuracy of 78.01% in validation.
The results demonstrate the advantages that Decision Trees have over Logit model. It is one of the most accurate learning algorithms available producing highly accurate classifier. Also it runs efficiently on large databases and can handle thousands of input variables. It generates an internal unbiased estimate of the generalization error as the forest building progresses. There is repeatability in using
Random forest as the generated forests can be saved and deployed for future use on other data.
Glossary
Boosting: Successive trees give extra weight
to points incorrectly predicted by earlier predictors. In the end, a weighted vote is taken for prediction.
Bagging: Successive trees do not depend
on earlier trees each is independently constructed using a bootstrap sample of the data set. In the end, a simple majority vote is taken for prediction.
Pruning: It is a technique that is used
to reduce the size of decision trees by removing sections of the tree that provide little power to classify samples. Pruning reduces the complexity of the final classifier and improves predictive accuracy by the reduction of over fitting.
References
Ali, J.; Khan, R.; Ahmad, N.; Maqsood, I. 2012. Random Forests and Decision Trees, International Journal of
Computer Science Issues, 9(5): 272-278.
Ben-Akiva, M.E.; Lerman, S.R. 1985. Discrete Choice Analysis: Theory and Application to Travel Demand,
Black, W.R. 1995. Spatial interaction modeling using artificial neural networks, Journal of Transport Geography, 3(3): 159-166.
Breiman, L. 1999. Random Forests-Random Features. Available from Internet: <http://oz.berkeley.edu/users/ breiman/randomforest2001.pdf>.
Breiman, L. 2001. Random forests, Machine Learning, 45: 5-32.
Breiman, L. 2002. Manual on setting up, using, and understanding random forests v3. 1. Statistics Department University of California Berkeley, CA, USA.
Chen, X.; Liu, X.; Li, F. 2013. Comparative study on mode split discrete choice models, Journal of Modern
Transportation, 21(4): 266-272.
Cybenko, G. 1989. Approximation by Superposition of a Sigmoid Function, Mathematics of Control Signals
Systems, 2: 303-314.
Dougherty, M. 1995. A review of neural Networks applied to transport, Transportation Research Part C:
Emerging Technologies, 3(4): 247-260.
Haleem, K.; Abdel-Aty, M.; Santos, J. 2010. Multiple Applications of Multivariate Adaptive Regression Splines Technique to Predict Rear-End Crashes at Unsignalized Intersections, Transportation Research Record: Journal of
the Transportation Research Board, 2165: 33-41.
Hall, M.; Frank, E.; Holmes, G.; Pfahringer, B.; Reutemann, P.; Witten, I.H. 2009. The WEKA Data Mining Software: An Update, SIGKDD Explorations, 11(1): 10-18.
Hasegawa, H.; Naito, T.; Arimura, M.; Tamura, T. 2012. Modal choice analysis using ensemble learning methods,
Journal of Japan Society of Civil Engineering, 68(5): 773-780.
Hasegawa, H.; Naito, T.; Arimura, M.; Tamura, T. 2013. Hybrid Model of Random Forests and Genetic Algorithms for Commute Mode Choice Analysis. In Proceedings of
the Eastern Asia Society for Transportation Studies, Vol. 9.
Hensher, D.A.; Ton, T. 2000. TRESIS: A transportation, land use and environmental strategy impact simulator for urban areas, Transportation, 29(4): 439-457.
Hornik, K.S. 1989. Multilayer feed forward Networks are Universal Approximators, Neural Networks, 2(5): 359-366.
Hossain, M.; Muromachi, Y. 2011. Understanding Crash Mechanisms and Selecting Interventions to Mitigate Real-Time Hazards on Urban Expressways,
Transportation Research Record: Journal of the Transportation
Research Record, 2213: 53-62.
Karlaftis, M.G.; Golias, I. 2001. An International Comparative Study of Self-Reported Driver Behavior,
Transportation Research Part F: Traffic Psychology and
Behaviour, 4(4): 243-256.
Kohavi, R. 1995. A study of cross-validation and bootstrap for accuracy estimation and model selection. In
Proceedings of International Joint Conference on AI, 1137-1145.
Landis, J.R.; Koch, G.G. 1977. The measurement of observer agreement for categorical data, Biometrics, 33(1): 159-74.
Nijkamp, P.; Reggiani, A.; Tritapepe, T. 1996. Modeling inter-urban transport flows in Italy: A comparison between Neural Network analysis and logit analysis,
Transportation Research Part C: Emerging Technologies,
4(6): 323-338.
Pande, A.; Das, A.; Abdel-Aty, M.; Hassan, H. 2011. Estimation of Real-Time Crash Risk, Transportation Research Record: Journal of the Transportation Research
SubbaRao, P.V. 1998. Another insight into artificial neural networks through behavioural analysis of access mode choice, Computers, Environment and Urban Systems, 22(5): 485-496.
Xie, C.; Lu, J.; Parkany, E. 2003. Work Travel Mode Choice Modeling Using Data Mining: Decision Trees And Neural Networks, Transportation Research Record:
Journal of the Transportation Research Record, 1854: 50-61.
Zhang, G.; Patuwo, B.E.; Hu, M.Y. 1998. Forecasting with artificial neural networks: The state of the art,