R E S E A R C H
Open Access
Construct validity of the Assessment of Quality of
Life - 6D (AQoL-6D) in community samples
Joanne Allen
1*, Kerry J Inder
1,2, Terry J Lewin
1, John R Attia
2,3and Brian J Kelly
1Abstract
Background:The Assessment of Quality of Life - 6D scale (AQoL-6D) is a self-report instrument designed to provide a sensitive multidimensional evaluation of health related quality of life. The current paper assesses the construct, concurrent and convergent validity of the AQoL-6D in a combined longitudinal population sample drawn from across urban, regional and remote areas of Australia.
Methods:The AQoL-6D was administered within the Hunter Community Study and the Australian Rural Mental Health Study over time (mean years lag = 3.90, SD = 1.30). Observations with sufficient data were used to confirm the construct validity of the AQoL-6D domains and higher-order structure using confirmatory factor analyses (CFA, N = 7915). The stability of this structure across cohorts and over time was assessed using multi-group CFA. Additionally, the concurrent validity (against the SF-36) and convergent validity of AQoL-6D domains and factors were assessed.
Results:The construct validity of the AQoL-6D domains was considered satisfactory. Two higher-order factors, representing the physical and psychological components of quality of life were identified (CFA model fit: RMSEA = .07, SRMR = .03; TLI = .96, CFI = .98). These factors displayed group and temporal invariance, as well as concurrent and convergent validity against a range of measures. Recommendations for the derivation of summary scores are provided, together with a provisional set of norms.
Conclusions:The AQoL-6D is a useful tool for assessing quality of life impairment in epidemiological cohort studies, both cross-sectionally and over time. It displays appropriate levels of construct, concurrent and convergent validity. Conceptualisation of higher-order factors as representing the physical and psychological aspects of quality of life impairment may increase the sensitivity and appeal of the AQoL-6D, particularly for studies examining predictors of and changes in social and psychological outcomes.
With many countries facing the health care challenges associated with an ageing population, factors associated with quality of life (QoL) and its maintenance are of immediate interest and concern. Quality of life has typ-ically been conceptualised as the perception of physical and psychological wellbeing or functioning, although some formulations have also included environmental and social assets [1]. Self-report instruments measuring QoL have generally acknowledged this multidimen-sional structure, characterising life quality by means of various domains assessed using single or multiple itemsa; the scope of any particular QoL measure is
typically determined by a trade-off between the brev-ity and sensitivbrev-ity required.
The Assessment of Quality of Life (AQoL) family of measures share an overarching conceptualisation of QoL in terms of handicap, or the impact of a reported health state on personal functioning and satisfaction within the person’s social context [2]. To date the AQoL family comprises four multidimensional self-report survey in-struments, each assessing somewhat differing domains of QoL. While scale construction often involves the compilation of a pool of items from which emergent fac-tors are identified, the AQoL measures employ a con-ceptual approach to scale construction, with the aim of increasing the breadth of and sensitivity to a specified range of health features and states. In this approach, the target domains of QoL to be assessed are identified and
* Correspondence:[email protected] 1
Centre for Translational Neuroscience and Mental Health, University of Newcastle and Hunter New England Health, Newcastle, NSW, Australia Full list of author information is available at the end of the article
relevant items are developed in consultation with panels of stakeholders, including researchers, clinicians and other health care professionals. Items are then refined within domains to identify items best characterising the health states of interest.
The Assessment of Quality of Life–6D scale (AQoL-6D) is a relatively new addition to the AQoL family (previously labelled as the AQoL-II) and was developed in part to im-prove the content validity of QoL measures [3] and thus their sensitivity to a range of factors influencing life quality. In addition, the AQoL-6D aimed to create a measure ap-propriate for population health assessment, with increased sensitivity to wellness states compared to previous versions. The AQoL-6D is a 20 item assessment of six domains of QoL, characterised as ‘independent living’, ‘relationships’, ‘mental health’,‘coping’,‘pain’and ‘senses’and takes only a few minutes to complete. While the authors of the scale note that items assess both physical and psycho-social areas of QoL, these six domains may be combined to form a sin-gle global QoL factor.
In the process of constructing the AQoL-6D, additional items were developed for the AQoL item bank to in-crease coverage of QoL concepts both between and within domains [3]. Best performing items in terms of factor coherence and psychometric performance were determined from a construction sample, in which the overall factor structure was then confirmed [2-4]. As intended, the final 20 items formed a model with 3–4 items loading on each of the six domain scores, which in turn loaded onto a global QoL factor [2-4]. The AQoL-6D has been reported to discriminate between older persons at differential risks for falls [5], and to be associated with body mass index in adolescents, identi-fying the coping domain as particularly decreased in obese teens [6]. While these results suggest the AQoL-6D is a usable and sensitive instrument for a range of age groups, to date, there has been no published confirmation of the factor structure of the AQoL-6D outside of its ori-ginal construction sample.
In light of its design for use in population health sur-veys and representation of physical and psycho-social as-pects of QoL, the AQoL-6D was administered at the baseline and follow-up phases of two independently con-ceived but concurrent longitudinal community cohort studies conducted in New South Wales, Australia: 1) the Australian Rural Mental Health Study (ARMHS) [7], a project examining regional to very remote communities,
which conducted baseline surveys in 2007–2009 and
follow-up surveys from 2011–2012; and 2) the Hunter Community Study (HCS) [8], a project examining urban and inner regional communities around the Hunter Region, which conducted baseline surveys in 2004–2007 and follow-up surveys from 2010–2011. Under the aus-pices of the Extending Treatments, Education and
Networks in Depression (xTEND) project [9], these co-horts have been combined with an aim to investigate is-sues of common interest and to maximise the utility of existing community surveys and national datasets. How-ever, the comparability of the quality of life constructs assessed by the AQoL-6D across these cohorts, which encompass different age ranges and environmental con-texts, is as yet unknown. Furthermore, concerns regard-ing ‘response shift bias’ are a potential problem in longitudinal studies of QoL [10], that is, when the conceptualization of an experience or state of being changes over time or with health states, resulting in confounding. Thus, confirming the structure and validity of the AQoL-6D scale across groups and timepoints is of importance not only for confirming its factor structure, but to facilitate meaningful and interpretable compari-sons using this measure.
Using this large, aggregate longitudinal sample compiled for the purposes of the xTEND study, the current paper aims to: 1) review the performance of the AQoL-6D items and assess the internal validity and stability of the six asso-ciated domains; 2) confirm the overall factor structure of the AQoL-6D and its stability over time and across co-horts; 3) assess the concurrent validity of the AQoL-6D against an established measure of quality of life (the SF-36); and 4) assess the convergent validity of AQoL-6D factors by examining their association with indices of personal functioning (e.g., mental health functioning, psychological distress, satisfaction with life, physical functioning, body mass index, spirometry, pedometry and mobility).
Methods Participants
Self-report postal survey data from two population-based cohort studies were combined to undertake the current study: the Hunter Community study (HCS) [8]; and the Australian Rural Mental Health Study (ARMHS) [7]. Detailed descriptions of recruitment, sample charac-teristics and methods employed can be obtained from their respective baseline descriptive papers. Briefly, the HCS is a study of persons aged 55–85 years residing in Newcastle, Australia, which was designed to assess a range of bio-psychosocial aspects of ageing. The ARMHS project includes persons aged 18 years and older residing in non-metropolitan areas, which was designed to assess mental health and wellbeing in rural and remote regions by over-sampling from remote and very remote populations. Both the HCS and ARMHS randomly selected potential participants from the state electoral roll. Introduction and recruitment letters were sent to individuals by post and non-responding individ-uals were followed-up by telephone calls. Overall, base-line response rates of 44.5% and 27.3% for the HCS
Allenet al. Health and Quality of Life Outcomes2013,11:61 Page 2 of 15
(N = 3318) and ARMHS (N = 2639) respectively were achieved, with both samples having comparable rates of un-contactable or excluded persons (HCS: 26.9% and ARMHS: 25.2%). To reduce participant burden, survey items were administered over two baseline postal surveys in both cohorts: among respondents, 81.4% from the ARMHS and 97.4% from the HCS returned both surveys and were included in the current analyses. Between 2010 and 2012, 59.0% of baseline participants responded to a follow-up survey. Following ethical approval (Human Re-search Ethics Committees from the University of Newcastle and Hunter New England Area Health) individual partici-pant survey data from the HCS and ARMHS were combined.
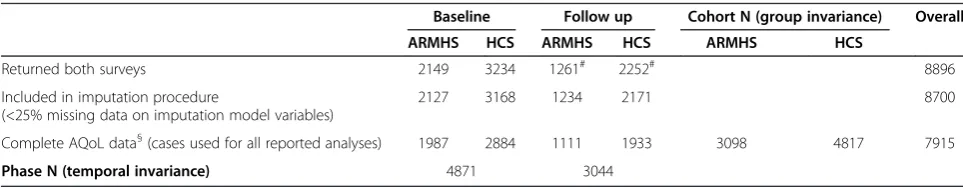
Table 1 displays information regarding numbers of co-hort participants observed at baseline and follow-up phases, as well as the rationale for the selection of cases used in the current analyses. Of the combined N = 8896 baseline and follow up cases, 89.1% responded to all ad-ministered AQoL-6D items. Due to an administrative error, influenced by the perceived redundancy within the mental health items included in the survey, the mental health domain of the AQoL-6D (comprising 4 items) was not assessed in the ARMHS cohort at base-line. To address this issue, a subsample comprised of participants who had no more than 25% missing data on imputation model variables was used in the imput-ation of missing mental health domain items. This level of missing data has been demonstrated to produce min-imal bias when using full information maximum likeli-hood estimation [11]. Following this procedure, the capacity of the multiple and single imputation sets of the mental health subscale to maintain the associative properties of the observed values (follow-up ARMHS, baseline and follow-up HCS) was examined. It was de-termined that a single imputation of mental health scale items for baseline ARMHS participants provided ad-equate representation of the missing values and these values were merged with the original dataset. A detailed account of the imputation and related analyses are pro-vided in Additional file 1, which includes information regarding item response rates and floor/ceiling effects (see Additional file 1: Table S2). Participants with
complete AQoL-6D data in the resulting overall set were used to assess the scale characteristics, structure, invariance and validity of the AQoL-6D (N = 7915).
Measures Quality of life
The Assessment of Quality of Life–6D scale (AQoL-6D) is a 20-item self-report measure of QoL and general func-tioning [3]. Response options for each item include 4–6 levels, with higher scores indicating quality of life impair-ment. The 20 items of the AQoL-6D represent six do-mains, characterised as independent living (4 items), relationships (3 items), mental health (4 items), coping (3 items), pain (3 items) and senses (3 items). Items and response options are available online (http://www.aqol. com.au/) and reproduced in Additional file 2. The AQoL-6D was administered to the ARMHS and HCS cohorts at both baseline and follow-up phases.
Concurrent measurement of health related quality of life was conducted using the SF-36v1 (Australian ver-sion) [12], which was administered to HCS participants at both baseline and follow-up phases. The SF-36 is a well validated assessment of physical and mental health outcomes and has eight scales (physical functioning, role physical, social functioning, mental health, role emo-tional, vitality, bodily pain and general health) [13]. Scale scores were calculated according to the SF-36 manual [14], with items within scales recoded where necessary, summed and transformed to provide a scale score (range 0–100), with higher scores indicating greater health within that domain. The physical functioning and mental health scales of the SF-36 have been identified as ‘pure’ measures of their underlying constructs (physical and mental health respectively), with variability in each scale largely attributable to variation in its target health state [13]; for the current paper, these scales were used as concurrent indices, against which the AQoL-6D factors could be evaluated.
Other psychological functioning indicators
Psychological distress The Kessler 10 (K10) [15] was
used to assess current psychological distress and was
Table 1 Description of number, origin and criteria for cases included in current analyses
Baseline Follow up Cohort N (group invariance) Overall
ARMHS HCS ARMHS HCS ARMHS HCS
Returned both surveys 2149 3234 1261# 2252# 8896
Included in imputation procedure
(<25% missing data on imputation model variables)
2127 3168 1234 2171 8700
Complete AQoL data§(cases used for all reported analyses) 1987 2884 1111 1933 3098 4817 7915
Phase N (temporal invariance) 4871 3044
#
Only one survey booklet was administered at follow-up, these values refer to N participants returning a follow-up survey.§
administered to the ARMHS and HCS cohorts at both baseline and follow-up phases. The K10 is a 10-item self-report questionnaire that assesses the frequency of psychological distress over the past four weeks using a 5-point Likert scale: ‘none of the time’,‘a little of the time’,‘some of the time’,‘most of the time’,‘all of the time’. K10 scores range from 10 to 50, with higher scores de-noting greater psychological distress. This measure dis-plays good internal reliability (α= .93) and validity as a measure of psychological distress in community samples [16]. K10 items are also highly similar to AQoL-6D mental health subscale items, asking participants to rate the frequency with which they recently experienced anx-ious/negative affective states.
Life satisfactionThe Satisfaction With Life (SWL) scale
was used to assess life satisfaction and was administered to the ARMHS cohort at baseline and to both the ARMHS and HCS cohorts at follow-up. The SWL [17] is a five-item scale measuring global life satisfaction, with participants rating each statement on a 7-point Likert scale (‘strongly disagree’ to ‘strongly agree’). A total global life satisfaction score is derived by summing all five items, with higher scores indicating greater life satisfaction (range = 5–35). The SWL is a widely used and well validated measure of life satisfaction [18] that displays good internal reliability (α= .87) [17].
Other physical functioning indicators
Body mass index (BMI). At baseline, height and weight measurements were undertaken as part of a battery of clinical measures recorded by staff in the HCS, while the ARMHS obtained these measurements through self-reported survey responses. To address the significant po-tential for bias in the self-reporting of height and weight
measurements, correction equations based on 2007–
2008 Australian national survey data [16] were applied to self-reported height and weight indices for ARMHS participants before BMI was calculated. BMI was calcu-lated as weight in kilograms divided by height in metres squared (kg/m2). BMI profiles by age for the sample are comparable to Australian population estimates compiled by the Australian Bureau of Statistics (see supplementary information provided in Additional file 1 for further de-tails regarding the transformation and BMI profiles of the current sample).
Several other pertinent measures of physical function-ing were collected in the HCS at baseline:Pedometry- a pedometer worn for 7 consecutive days during waking hours to record step count, from which mean daily steps was calculated;Timed up and go (TUG) - a measure of functional mobility that is operationalized as the time (in seconds) that a person takes to rise from a chair, walk three metres, turn around, walk back to the chair
and sit down [19]; and forced expiratory volume (FEV) in 1 second - assessed (in litres) using electronic spirom-eters, together with Spida 5 software [20,21].
Data analysis
Analyses were conducted using IBM SPSS Statistics for Windows v20.0 [22] and AMOS v20.0 [23]. Chi square tests were used for between group comparisons of cat-egorical variables and one-way ANOVA for continuous variables. Unless otherwise stated, p< .01 was used as the threshold for all tests of statistical significance as a partial control for the number of statistical comparisons and the large number of observations.
Factor analyses
Maximum likelihood estimations were used for all con-firmatory factor analyses (CFA). Correlation matrices used to produce all models reported here are provided in the supplementary documentation (Additional file 1: Tables S6). To assess the internal consistency of AQoL-6D domains, one factor congeneric models of each domain were constructed and the association of indicators with the domain, item variance explained by the domain (squared multiple correlation: SMC), and the reliability of scale items were inspected. Item reliabilities were assessed using both Cronbach’s alpha (α), which uses item correla-tions to assess a common construct, and Coefficient H [24], which uses model parameters to determine the reli-ability with which items assess a latent construct. As the majority of domains were just-identified [25] (reflecting the small number of items per domain), no fit statistics were calculated for these models.
To confirm that the six domains assessed a common underlying QoL construct, a one factor model of these domains was initially evaluated using CFA. Bagozzi et al.’s [26] method of determining discriminant validity, which utilizes nested models to assess whether scales are best represented by one or two higher-order factors, was used to assess the fit of competing models. The fit of a two factor solution, where the factor covariance was freely estimated (two correlated factors), was compared with a model where the correlation was constrained to be 1.00 (a single factor) and a chi-squared difference test conducted. To confirm whether the AQoL-6D factor structure was equivalent across the ARMHS and HCS samples and over time, multi-group confirmatory factor analyses (MGCFA) were conducted. Nested models were used to assess increasingly restrictive models of invari-ance across groups and time, to confirm that AQoL-6D factors displayed configural (indicators load on the same latent factor), metric (indicators contribute consistently to the latent factor), and variance/covariance invariance (the latent factor represents the same range of values and displays consistent relationships) across groups/
Allenet al. Health and Quality of Life Outcomes2013,11:61 Page 4 of 15
time. Such multi-group methods present a widely ac-cepted and powerful approach for testing measurement invariance [27]. Where models displayed group and tem-poral invariance, model parameters are reported for the overall sample. Model fit was assessed by inspecting ab-solute [standardised root mean square residual (SRMR) and root mean square error of approximation (RMSEA)] and incremental fit statistics [Tucker-Lewis Index (TLI), Comparative Fit Index (CFI)], as well as parameter esti-mates. Acceptable fit is indicated by RMSEA close to or less than .06, SRMR < .06 and incremental fit indices > .95 [28]. Where model fit was unacceptable, modifica-tion indices were inspected and considered in conjunc-tion with the theoretical underpinnings of factors to improve model fit.
Psychometric analyses
Construction of aggregate AQoL-6D domain and factor scores for the sample are described and the stability of scores over-time assessed using the intra-class correl-ation coefficient (absolute) [29]. One-way ANOVAs were conducted to assess the influence of age and gender on factor and total scores and post-hoc age category com-parisons using orthogonal polynomials were used to as-sess patterns of differences between age categories. The concurrent validity of AQoL-6D domain and factor scores was assessed against SF-36 domain scores. The magnitude of the associations between quality of life
domains were examined using canonical correlations and Pearson’s correlation coefficient. Where multiple ob-servations of an individual over time were available, ana-lyses weighted and unweighted for the number of observations were conducted; correlation matrices for these analyses did not differ (maximum coefficient dif-ference of r = .02) and unweighted analyses are reported in the manuscript. Factor score stability over time was contrasted with those of the SF-36 physical and mental health scales. The sensitivity of the SF-36 total score to impairment on each AQoL-6D domain was examined by standardizing AQoL-6D scores and plotting a score pro-file for those participants ranking in the lowest 25th per-centile on the SF-36. We also build upon observations regarding the convergent validity of the AQoL-6D by examining the multiple correlation of AQoL-6D factor scores with sets of physical and psychological function-ing indices (R2with set) to assess the proportion of vari-ance shared with these conceptually related constructs.
Results
Sample characteristics
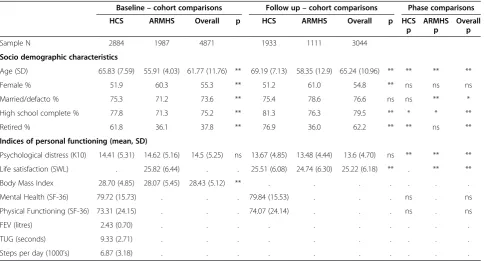
Baseline and follow-up characteristics of the sample are presented in Table 2. Of the N = 2740 participants who provided AQoL-6D data at both timepoints, there was an average lag of 3.90 years (SD = 1.30) between baseline and follow-up surveys. Cohorts differed significantly in demographic and bio-psychosocial indices and cohort
Table 2 Sample characteristics and comparisons by cohort and phase
Baseline–cohort comparisons Follow up–cohort comparisons Phase comparisons
HCS ARMHS Overall p HCS ARMHS Overall p HCS ARMHS Overall
p p p
Sample N 2884 1987 4871 1933 1111 3044
Socio demographic characteristics
Age (SD) 65.83 (7.59) 55.91 (4.03) 61.77 (11.76) ** 69.19 (7.13) 58.35 (12.9) 65.24 (10.96) ** ** ** **
Female % 51.9 60.3 55.3 ** 51.2 61.0 54.8 ** ns ns ns
Married/defacto % 75.3 71.2 73.6 ** 75.4 78.6 76.6 ns ns ** *
High school complete % 77.8 71.3 75.2 ** 81.3 76.3 79.5 ** * * **
Retired % 61.8 36.1 37.8 ** 76.9 36.0 62.2 ** ** ns **
Indices of personal functioning (mean, SD)
Psychological distress (K10) 14.41 (5.31) 14.62 (5.16) 14.5 (5.25) ns 13.67 (4.85) 13.48 (4.44) 13.6 (4.70) ns ** ** **
Life satisfaction (SWL) . 25.82 (6.44) . . 25.51 (6.08) 24.74 (6.30) 25.22 (6.18) ** . ** **
Body Mass Index 28.70 (4.85) 28.07 (5.45) 28.43 (5.12) ** . . . .
Mental Health (SF-36) 79.72 (15.73) . . . 79.84 (15.53) . . . ns . ns
Physical Functioning (SF-36) 73.31 (24.15) . . . 74.07 (24.14) . . . ns . ns
FEV (litres) 2.43 (0.70) . . . .
TUG (seconds) 9.33 (2.71) . . . .
Steps per day (1000’s) 6.87 (3.18) . . . .
differences were largely consistent at both timepoints. Compared to baseline, follow-up participants were older, more likely to be married/de facto (ARMHS), had a higher level of education, were more likely to be retired (HCS), had lower psychological distress, and lower life satisfaction (ARMHS).
Internal validity and structure Items and domains
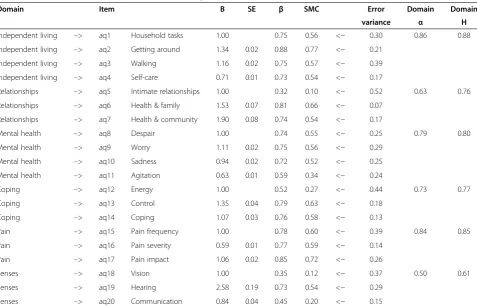
As detailed in Table 3, one factor congeneric modelling indicated that the AQoL-6D domains display positive associations with all of their component items and explained a considerable amount of item variance (SMC). Internal consistency of most domains was acceptable (Cronbach’sα range .73-.86), with the possible exception of the relationships (α= .63) and senses (α= .50)
domains. The relationships domain had acceptable
consistency in reference to Coefficient H (H = .76), which does not assume all items are equally good indicators of the latent construct, however, the consistency of the senses do-main was still low (H = .61). Latent dodo-mains were generally a good fit to items, with the majority displaying high item reliabilities (SMC > .50), though relationships (aq5), senses (aq18 and aq20), and coping (aq12) domains contained some items with unacceptable reliability (SMC < .30).
Overall factor structure
Domain scores were initially calculated as the mean of the standardized factor weighted item scores, to both account for differing item reliabilities and reduce the inconsistency due to differing numbers of items and response options across domains. Standardized weights applied to item scores in the calculation of domain scores are presented in the sup-plementary documentation (Additional file 1: Table S5). CFA indicated a one-factor model of QoL displayed a posi-tive association with all domains (β= .33-.81) and explained a reasonable amount of the variance in domain scores (SMC = .11-.65). However, model fit was poor [RMSEA = .20 (.19, .20), SRMR = .08; TLI = .70, CFI = .82], suggesting that the domain scores tapped somewhat dissimilar underlying constructs. Modification indices indicated that allowing the relationship between the mental health and coping do-main errors to vary would reduce the discrepancy between the observed and optimal covariance matrixes by χ2= 2122.37. This suggested that a two factor solution with mental health and coping representing a separate factor, perhaps assessing the psychological, as opposed to the physical, aspects of QoL, may improve the model. Model fit for the two factor solution was good [RMSEA = .07 (.07, .08), SRMR = .03; TLI = .96, CFI = .98]. A chi-square difference test indicated that the single factor solution Table 3 Raw and standardized coefficients from separate CFAs for each AQoL-6D domain (N = 7915)
Domain Item B SE β SMC Error Domain Domain
variance α H
Independent living –> aq1 Household tasks 1.00 0.75 0.56 <− 0.30 0.86 0.88
Independent living –> aq2 Getting around 1.34 0.02 0.88 0.77 <− 0.21
Independent living –> aq3 Walking 1.16 0.02 0.75 0.57 <− 0.39
Independent living –> aq4 Self-care 0.71 0.01 0.73 0.54 <− 0.17
Relationships –> aq5 Intimate relationships 1.00 0.32 0.10 <− 0.52 0.63 0.76
Relationships –> aq6 Health & family 1.53 0.07 0.81 0.66 <− 0.07
Relationships –> aq7 Health & community 1.90 0.08 0.74 0.54 <− 0.17
Mental health –> aq8 Despair 1.00 0.74 0.55 <− 0.25 0.79 0.80
Mental health –> aq9 Worry 1.11 0.02 0.75 0.56 <− 0.29
Mental health –> aq10 Sadness 0.94 0.02 0.72 0.52 <− 0.25
Mental health –> aq11 Agitation 0.63 0.01 0.59 0.34 <− 0.24
Coping –> aq12 Energy 1.00 0.52 0.27 <− 0.44 0.73 0.77
Coping –> aq13 Control 1.35 0.04 0.79 0.63 <− 0.18
Coping –> aq14 Coping 1.07 0.03 0.76 0.58 <− 0.13
Pain –> aq15 Pain frequency 1.00 0.78 0.60 <− 0.39 0.84 0.85
Pain –> aq16 Pain severity 0.59 0.01 0.77 0.59 <− 0.14
Pain –> aq17 Pain impact 1.06 0.02 0.85 0.72 <− 0.26
Senses –> aq18 Vision 1.00 0.35 0.12 <− 0.37 0.50 0.61
Senses –> aq19 Hearing 2.58 0.19 0.73 0.54 <− 0.29
Senses –> aq20 Communication 0.84 0.04 0.45 0.20 <− 0.15
Note:CFAconfirmatory factor analysis,SMCsquared multiple correlation,DomainαCronbach’s alpha coefficient for items within the domain,Domain HH coefficient for items within the domain.
Allenet al. Health and Quality of Life Outcomes2013,11:61 Page 6 of 15
significantly worsened the model compared with the two factor solution (χ2
(1) = 2429.40, p< .001), indicating that the two constructs are reasonably different.
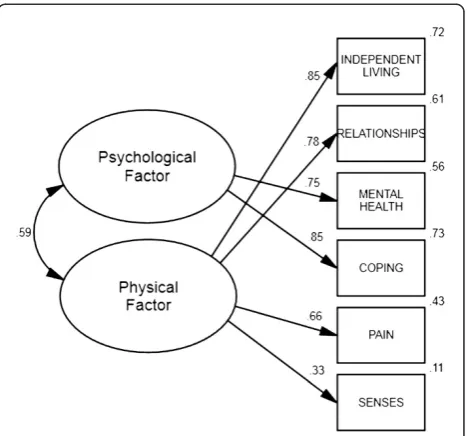
Multi-group CFAs were conducted to assess whether this two factor solution was consistent across groups (ARMHSvs.HCS) and timepoints (baselinevs.follow-up). Results provided evidence that the two factor solution displayed configural [RMSEA = .06 (.05, .06), SRMR = .03; TLI = .95, CFI = .97], metric [RMSEA = .05 (.05, .06), SRMR = .03; TLI = .96, CFI = .97], and covariance/variance [RMSEA = .05 (.05, .06), SRMR = .04; TLI = .96, CFI = .97] invariance in both cohorts, suggesting this model was viable in both samples. Likewise, assessment of temporal invari-ance provided evidence that scales displayed configural [RMSEA = .06 (.05, .06), SRMR = .03; TLI = .95, CFI = .97], metric [RMSEA = .05 (.05, .05), SRMR = .03; TLI = .96, CFI = .97], and covariance/variance [RMSEA = .05 (.04, .05), SRMR = .04; TLI = .96, CFI = .97] invariance over time, suggesting this model was viable at both baseline and follow-up timepoints. Parameters for the two factor model are presented in Table 4 and its structure depicted in Figure 1.
Calculation of domain and factor scores
Domains: factor weighted scores vs. item weighted scores vs. utility scores
Correlations between standardized factor weighted domain scores and those derived by calculating the mean unit weighted domain score (i.e., giving equal weight to each item) were highly correlated for all scales [independent liv-ing r = .993; relationships r = .883; mental health r = .998; coping r = .962; pain: r = .996; senses r = .954]. The com-paratively lower correlation for the relationships domain is due to the smaller standardized factor weighting of item aq5 (w = .055), which addresses general satisfaction with relationships, as opposed to items aq6 (w = .634) and aq7 (w = .311), which address the impact of an individual’s health on their ability to fulfil relationship roles (see Additional file 1: Table S5). Utility weighted domain scores [37] also correlated highly with mean unit weighted do-main scores (range r =−.918 to r =−.983). Therefore, for parsimony, mean unit weighted domain scores were used for subsequent analysis and reporting (i.e., giving equal
weight to items in calculating domain scores, and equal weight to domains in calculating factor scores).
Factor scores
AQoL-6D physical and psychological factors were calcu-lated as the mean of their component unit weighted do-main scores; both displayed a correlation ofr= .99,p< .001 with their counterparts calculated as the mean of factor weighted domain scores. Internal consistency estimates, based on the set of items associated with each factor were, respectively,α= .86 andα= .84 for the physical and psycho-logical factors. Physical and psychopsycho-logical factor scores displayed a correlation ofr= .56,p< .001, which was highly consistent with the association observed in the two factor CFA model (see Figure 1). A total score, the mean of the physical and psychological factors, was also calculated. The internal consistency for the full set of AQoL-6D items con-tributing to the total score wasα= .89. As expected (given their mathematical relationship), correlations between
Table 4 Model parameter estimates for two higher-order factors from a factor analysis of AQoL-6D domains (N = 7915)
Factor Domain B SE β SMC Error variance
Physical –> INDEPENDENT LIVING 0.61 0.01 0.85 0.72 <− 0.14
Physical –> RELATIONSHIPS 0.35 0.01 0.78 0.61 <− 0.08
Psychological –> MENTAL HEALTH 0.44 0.01 0.75 0.56 <− 0.15
Psychological –> COPING 0.46 0.01 0.85 0.73 <− 0.08
Physical –> PAIN 0.47 0.01 0.66 0.43 <− 0.29
Physical –> SENSES 0.17 0.01 0.33 0.11 <− 0.23
Physical <−−> Psychological 0.59
Note:SMCsquared multiple correlation.
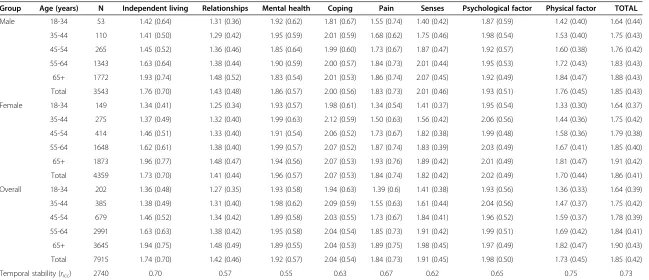
Table 5 Mean (SD) AQoL-6D quality of life impairment domain and factor scores by gender and age
Group Age (years) N Independent living Relationships Mental health Coping Pain Senses Psychological factor Physical factor TOTAL
Male 18-34 53 1.42 (0.64) 1.31 (0.36) 1.92 (0.62) 1.81 (0.67) 1.55 (0.74) 1.40 (0.42) 1.87 (0.59) 1.42 (0.40) 1.64 (0.44) 35-44 110 1.41 (0.50) 1.29 (0.42) 1.95 (0.59) 2.01 (0.59) 1.68 (0.62) 1.75 (0.46) 1.98 (0.54) 1.53 (0.40) 1.75 (0.43) 45-54 265 1.45 (0.52) 1.36 (0.46) 1.85 (0.64) 1.99 (0.60) 1.73 (0.67) 1.87 (0.47) 1.92 (0.57) 1.60 (0.38) 1.76 (0.42) 55-64 1343 1.63 (0.64) 1.38 (0.44) 1.90 (0.59) 2.00 (0.57) 1.84 (0.73) 2.01 (0.44) 1.95 (0.53) 1.72 (0.43) 1.83 (0.43) 65+ 1772 1.93 (0.74) 1.48 (0.52) 1.83 (0.54) 2.01 (0.53) 1.86 (0.74) 2.07 (0.45) 1.92 (0.49) 1.84 (0.47) 1.88 (0.43) Total 3543 1.76 (0.70) 1.43 (0.48) 1.86 (0.57) 2.00 (0.56) 1.83 (0.73) 2.01 (0.46) 1.93 (0.51) 1.76 (0.45) 1.85 (0.43) Female 18-34 149 1.34 (0.41) 1.25 (0.34) 1.93 (0.57) 1.98 (0.61) 1.34 (0.54) 1.41 (0.37) 1.95 (0.54) 1.33 (0.30) 1.64 (0.37) 35-44 275 1.37 (0.49) 1.32 (0.40) 1.99 (0.63) 2.12 (0.59) 1.50 (0.63) 1.56 (0.42) 2.06 (0.56) 1.44 (0.36) 1.75 (0.42) 45-54 414 1.46 (0.51) 1.33 (0.40) 1.91 (0.54) 2.06 (0.52) 1.73 (0.67) 1.82 (0.38) 1.99 (0.48) 1.58 (0.36) 1.79 (0.38) 55-64 1648 1.62 (0.61) 1.38 (0.40) 1.99 (0.57) 2.07 (0.52) 1.87 (0.74) 1.83 (0.39) 2.03 (0.49) 1.67 (0.41) 1.85 (0.40) 65+ 1873 1.96 (0.77) 1.48 (0.47) 1.94 (0.56) 2.07 (0.53) 1.93 (0.76) 1.89 (0.42) 2.01 (0.49) 1.81 (0.47) 1.91 (0.42) Total 4359 1.73 (0.70) 1.41 (0.44) 1.96 (0.57) 2.07 (0.53) 1.84 (0.74) 1.82 (0.42) 2.02 (0.49) 1.70 (0.44) 1.86 (0.41) Overall 18-34 202 1.36 (0.48) 1.27 (0.35) 1.93 (0.58) 1.94 (0.63) 1.39 (0.6) 1.41 (0.38) 1.93 (0.56) 1.36 (0.33) 1.64 (0.39) 35-44 385 1.38 (0.49) 1.31 (0.40) 1.98 (0.62) 2.09 (0.59) 1.55 (0.63) 1.61 (0.44) 2.04 (0.56) 1.47 (0.37) 1.75 (0.42) 45-54 679 1.46 (0.52) 1.34 (0.42) 1.89 (0.58) 2.03 (0.55) 1.73 (0.67) 1.84 (0.41) 1.96 (0.52) 1.59 (0.37) 1.78 (0.39) 55-64 2991 1.63 (0.63) 1.38 (0.42) 1.95 (0.58) 2.04 (0.54) 1.85 (0.73) 1.91 (0.42) 1.99 (0.51) 1.69 (0.42) 1.84 (0.41) 65+ 3645 1.94 (0.75) 1.48 (0.49) 1.89 (0.55) 2.04 (0.53) 1.89 (0.75) 1.98 (0.45) 1.97 (0.49) 1.82 (0.47) 1.90 (0.43) Total 7915 1.74 (0.70) 1.42 (0.46) 1.92 (0.57) 2.04 (0.54) 1.84 (0.73) 1.91 (0.45) 1.98 (0.50) 1.73 (0.45) 1.85 (0.42) Temporal stability (ricc) 2740 0.70 0.57 0.55 0.63 0.67 0.62 0.65 0.75 0.73 Note: Age category for N = 5 women and N = 8 men from HCS were unknown;ricc= intra-class correlation coefficient (absolute);all p < .001; for all measures, higher scores indicate a poorer quality of life.
Allen
et
al.
Health
and
Quality
of
Life
Outcomes
2013,
11
:61
Page
8
o
f
1
5
http://ww
w.hqlo.com
/content/11
factors and the total score were high: physical r= .87, p < .001; psychologicalr= .90,p< .001).
Table 5 presents means and standard deviations for the domain and factor scores by gender and age, and provides a provisional set of norms for the proposed AQoL-6D scoring scheme. There was a significant but small effect of gender on both physical (F(1, 7915) = 34.21,p< .001) and psychological (F(1, 7914) = 51.34, p< .001) factor scores, with men reporting greater impairment on physical and women reporting greater impairment on psychological factors. There was no influence of gender on the total score (F(1, 7914) = 1.35,p= .246). There was no significant influence of age category on psychological functioning (F(4, 7901) = 3.06, p= .016) but a significant effect of age category on physical functioning (F(4, 7901) = 138.21, p< .001) and the total score (F(4, 7901) = 33.082,p< .001). Post-hoc age category comparisons revealed significant linear components of trend for both the physical
functioning (F(1, 7897) = 551.13, p < .001) and total scores (F(1, 7897) = 132.82, p < .001), indicating a pro-gressive increase in impairment with increased age. No higher order (i.e., non-linear) effects were observed for any of these scores.
Concurrent validity
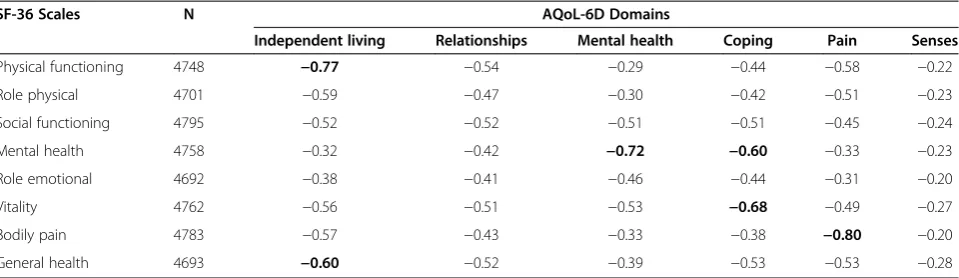
Associations between AQoL-6D domains and SF-36 scales are reported in Table 6. All domain scores displayed significant negative associations, indicating that increased impairment on AQoL-6D domains was associated with poorer quality of life on the SF-36 scales. Conceptually related scales were more highly re-lated than those that were not conceptually rere-lated, supporting the convergent validity of the AQoL-6D domains. The canonical correlation (six AQoL-6D domainsvs.eight SF-36 scales) revealed a high level of Table 6 Pearson’s correlation coefficients between AQoL-6D domains and SF-36 scales
SF-36 Scales N AQoL-6D Domains
Independent living Relationships Mental health Coping Pain Senses
Physical functioning 4748 −0.77 −0.54 −0.29 −0.44 −0.58 −0.22
Role physical 4701 −0.59 −0.47 −0.30 −0.42 −0.51 −0.23
Social functioning 4795 −0.52 −0.52 −0.51 −0.51 −0.45 −0.24
Mental health 4758 −0.32 −0.42 −0.72 −0.60 −0.33 −0.23
Role emotional 4692 −0.38 −0.41 −0.46 −0.44 −0.31 −0.20
Vitality 4762 −0.56 −0.51 −0.53 −0.68 −0.49 −0.27
Bodily pain 4783 −0.57 −0.43 −0.33 −0.38 −0.80 −0.20
General health 4693 −0.60 −0.52 −0.39 −0.53 −0.53 −0.28
Note: All p < .001; correlations of 0.60 or higher are highlighted in bold font.
Table 7 Associations of AQoL-6D summary scores with concurrent assessments of quality of life (SF-36) and with independent indices of physical and psychological functioning
N
AQoL-6D summary scores
Physical factor Psychological factor Total score Temporal stability
r R2with set r R2with set r R2with set r ICC
Physical indices
Physical functioning SF-36 4748 −0.73 .502 −0.40 .132 −0.63 .354 .65 (N = 1733)
Body mass index 4433 0.24 0.10 0.19 .
Timed up and go 2554 0.44 0.19 0.35 .
Pedometry 2217 −0.30 −0.10 −0.22 .
Forced expiratory volume 2312 −0.16 −0.09 −0.14 .
Psychological indices
Mental health SF-36 4758 −0.43 .246 −0.74 .606 −0.66 .518 .56 (N = 1735)
Psychological distress 7831 0.44 0.71 0.66 .57 (N = 2692)
Life satisfaction 4899 −0.34 −0.55 −0.52 .64 (N = 951)
Note: Allp< .001; pedometry = mean steps per day; rICC= intra-class correlation (absolute); R2with set based on HCS baseline participants only: physical indices
shared variance (Rc= .884 or 78% shared) between these sets, suggesting that the two sets measure highly similar aspects of life quality.
The stability of domain and factor scores over time are presented as intra-class correlation coefficients at the bot-tom of Table 5. All domain and factor scores displayed moderate stability over time (riccrange .55-.75). Temporal stability of the AQoL-6D psychological factor was lower than that of the physical factor, a pattern that is consistent with that observed for the SF-36 mental health and phys-ical functioning scales (see Table 7).
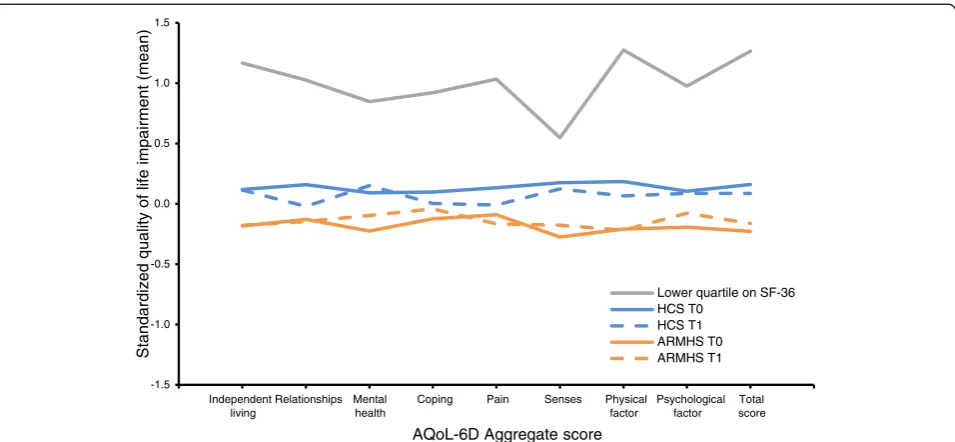
Figure 2 presents a profile plot of standardized AQoL-6D domain and factor scores for each cohort by phase. Com-pared to the HCS, ARMHS participants displayed lower impairment across all domains. The sub-group scoring below the 25th percentile on the SF-36 (i.e. lower than 63.50 on a mean total of the SF-36 scales) generally reported greater impairment (approximately 1 standard de-viation above the mean) on all subscales of the AQoL-6D. However, impairment experienced in this subgroup on the AQoL-6D senses domain dropped to around half a stand-ard deviation above the mean.
Convergent validity
Results for the correlation and multiple correlation of factor and total scores with other indices of physical and psychological functioning are presented in Table 7. Greater impairment on AQoL-6D summary scores was associated with poorer functioning on all psychological and physical indices. The psychological factor displayed higher correlations with concurrent psychological
indi-ces, while the physical factor displayed higher
correlations with the concurrent physical indices. Simi-larly, the psychological factor displayed a greater propor-tion of shared variance with psychological than physical functioning indices, while the physical factor displayed a greater proportion of shared variance with physical than psychological functioning indices.
Discussion
The AQoL-6D was designed to be sensitive to a range of health domains and an increased spectrum of wellness-illness states, and to be suitable for administration in community cohorts. The current analyses build upon the recent work of Richardson et al. [3] reporting on the processes of ensuring the content validity of the AQoL-6D. Utilising individual participant data drawn from two large longitudinal community cohorts, the current study confirms that the instrument was acceptable to partici-pants even when administered within an extensive sur-vey battery, with 89% completing all administered AQoL-6D items. In line with previous work [3], ques-tions regarding close and intimate relaques-tionships had the poorest response rate (3% missing). Current results largely confirm the internal consistency of AQoL-6D domains, providing evidence that the items within do-mains assess a single underlying construct. Comparison of nested CFA models suggested AQoL-6D domains are best represented by two correlated higher-order factors representing the physical and psychological aspects of life quality impairment. This model produced good fit across demographically diverse cohorts, as well as over time. Observations that increased age is associated with poorer physical quality of life, with little or no effect of
-1.5 -1.0 -0.5 0.0 0.5 1.0 1.5
Independent Relationships living
Mental health
Coping Pain Senses Physical factor
Psychological factor
Total score
Standardized quality
of life
impairme
nt
(mean
)
AQoL-6D Aggregate score
Lower quartile on SF-36 HCS T0
HCS T1 ARMHS T0 ARMHS T1
Figure 2Profile plot of standardized AQoL-6D domain, factor and total scores by group and for those with poorest quality of life on the SF-36.
Allenet al. Health and Quality of Life Outcomes2013,11:61 Page 10 of 15
age on psychological quality of life, are consistent with other Australian population surveys utilizing QoL in-struments with multidimensional scoring [38-41].
Domain structure and validity
Characterising the handicap associated with a representa-tive range of experiences of impairment was an explicit goal in the development of the AQoL-6D. One-factor con-generic models and indices of internal consistency suggest the items provided a cohesive representation of their underlying domains, though the internal consistency of the relationships (α= .63) and senses (α= .50) domains was relatively poor. Items within the relationships domain address somewhat different aspects of social interactions (including general satisfaction with relationships, and the impact of an individual’s health on their ability to fulfil re-lationship roles). The senses domain was designed to as-sess the impairment associated with sensory dysfunction (visual, hearing and communication) and, while dysfunc-tions do not necessarily co-occur, they do pose similar bar-riers to social functioning and thus life quality. The reduction in consistency within these scales thus repre-sents a trade-off between domain cohesion and sensitivity. Analyses also support the concurrent validity of AQoL-6D domain scores against SF-36 scale scores. Do-main scores constructed from mean item scores were highly consistent with those of the SF-36, with the two sets of scores having 78% shared variance. Scores for common constructs consistently demonstrated strong associations: independent living was highly associated with SF-36 phys-ical functioning and most weakly associated with SF-36 mental health, with the opposite effect observed for AQoL-6D mental health; pain and SF-36 bodily pain were highly related, with weak associations observed with SF-36 mental health and role emotional scales; and coping displayed its strongest association with SF-36 vitality and weakest with bodily pain scale. Two AQoL-6D domains did not display such convergence with other SF-36 scales: rela-tionships was moderately associated with all SF-36 scales, likely reflecting the component item’s predominant repre-sentation of the impact of physical functioning on relation-ships, rather than general social wellbeing or the impact of psychological functioning on relationships; and senses was weakly associated with all SF-36 scales, suggesting the ab-sence of an analogous assessment of sensory impairment in the SF-36. This inference was also supported by our plot of standardized AQoL-6D domain scores for those with poorest quality of life on the SF-36 (see Figure 2). This plot demonstrated that while the remaining five AQoL-6D sub-scales for this group were at least one standard deviation above the mean, scores on the sensory domain were only half a standard deviation above the mean, reflecting an in-sensitivity of the SF-36 to experiences of sensory impair-ment as assessed by the AQoL-6D.
Factor structure and validity
Current results show two correlated but divergent fac-tors, here characterized as physical (independent living, relationships, pain and senses) and psychological (mental health and coping) factors, provide a better explanation of the model variance than a single global QoL factor in our community sample. The moderate correlation be-tween scores on the physical and psychological factors (r= .59) demonstrates that they are not completely inde-pendent. Several global and disease specific scales assessing QoL support the existence, association and utility of these divergent factors (i.e., the SF-36 [13]). There are several possible reasons that current results regarding the fit of a single factor model for the AQoL-6D differed from those observed in its construction sample. During its construction, the final 20 AQoL-6D items were administered within a survey of 112 items to a sample of community members (N = 316), hospital outpatients (N = 206) and inpatients (N = 96). The completion of a large number of similar items may have reduced each par-ticipant’s capacity to discriminate between health states due to fatigue or contributed to the emergence of a par-ticular response pattern. Further, approximately half of this relatively small sample was drawn from hospital ser-vices. Comorbidity of poor physical and psychological quality of life may be greater in such samples than in the general community, resulting in greater differentiation of aspects of life quality in community compared to hospital based samples. Research contrasting model fit for commu-nity and hospital samples may be necessary to determine the most appropriate factor structure for representing quality of life in such populations.
while included largely for theoretical reasons, this ana-lysis confirmed that the AQoL-6D factors provide con-sistent representations of overall life quality. Thus, the two factor model displayed a psychometrically and the-oretically meaningful representation of life quality across two community groups which differ on a range of demo-graphic, bio-psychosocial and contextual indices. The two-factor model was replicated over time, suggesting the two factor solution is also suitable for assessing per-formance over time. This demonstration of invariance facilitates confident interpretation and, for the xTEND project, encourages us to undertake future examinations of the cross-sectional and longitudinal drivers of QoL (e.g., the impacts of chronic illness, social factors such as retirement, and community remoteness).
The AQoL-6D factor scores displayed convergent val-idity in their associations with a range of other indices of physical and psychological functioning. Temporal stabil-ity of domains and factors over a three year follow-up period was consistent with the patterns observed for the SF-36. Physical factor scores were more strongly associ-ated with measures of physical functioning, as assessed by the SF-36, BMI, mobility, pedometry and spirometry, and explained 50.2% of variability in this set of indices but only 24.6% in the psychological indices. Similarly, psychological factor scores were associated predomin-antly with psychological indices of mental health, psy-chological distress, and life satisfaction, and explained 60.6% of variability in this set of indices but only 13.2% in the physical indices. Such evidence provides support for the differential sensitivity of these factors to associ-ated physical and psychological states.
Our analyses also confirmed that the proposed AQoL-6D total score displayed comparable associations with the SF-36 physical and mental health scales (see Table 7), suggesting that an aggregate based on either measure would tend to have similar properties. As with any other composite score, such an aggregation would also tend to underestimate associations with factors that were differ-entially linked to the underlying components; in the current study, for example, the physical and psycho-logical aspects of quality of life were differentially associ-ated with gender and age, associations that would be obscured if only total scores were used. On the other hand, such a summary score could be of interest to re-searchers wishing to obtain a global rating of QoL, from which to broadly characterise their sample and/or to track changes over time; based on the current analyses, for example, gender differences could be largely ignored if the AQoL-6D total score was the primary focus. In short, the research value of composite scores depends on the context and the questions of interest (cf., two fac-tors based on psychometric scoring vs. a single utility index).
Practical issues
As noted previously, utility weights have been developed for the AQoL-6D. Utility weighting is commonly used in an effort to increase the interpretability of quality of life scores as a trade-off between quantity and quality of life, by accounting for preferences for health states; however, caution is advised in their interpretation and population specific weights accounting for preferences for health states are required. While utility measures have been popular in the health-related decision making literature, there has been relatively low interest in health utilities in relation to mental health treatment decision making. In econometric QoL studies, the motivation for choosing a particular QoL measure may be to provide an index by which health related burden or cost can be estimated (e.g., quality adjusted life years or cost-utility measures); in which case, the multidimensional nature of QoL may not be important or useful, and a single index may be desir-able [42]. However, if the motivation for instrument selec-tion is to assess the determinants of wellbeing and their outcomes, as is often the case in the social sciences, ac-knowledging the multidimensional nature of QoL is of considerable importance and may have several psychomet-ric benefits. For example, by acknowledging the divergent qualities of these factors, we may be able to produce QoL scores with greater external validity and sensitivity to a broader range of determinants and outcomes. Investiga-tion of the burdens and determinants of physical and mental health outcomes present a situation in which QoL and its correlates are of greater interest. Using the simple scoring routine described in the current paper (and reproduced in Additional file 2), a set of preliminary age and gender normative scores were derived. While they could be improved through increased representation of persons under 55 years of age, particularly in urban areas, to our knowledge, these provisional norms provide the lar-gest and most representative collection of AQoL-6D com-munity data to date.
The current paper may also help inform researchers in the selection of instruments for administration in the gen-eral community. We present evidence that the AQoL-6D domains and factor scores depicted here display construct validity and are interpretable over a range of community contexts. Additionally, while the AQoL-6D displays a high level of commonality with a concurrent assessment of quality of life, the SF-36, there are several points of differ-ence between these instruments, including: a smaller number of items (20vs.36) assessed in the AQoL-6D; the differing aspects of relationships measured; and the ab-sence of an explicit assessment of the impact of sensory impairment on life quality in the SF-36 scale. The sensory domain could be particularly important in assessing health related life quality in older groups and for persons living in non-urban areas, where often fewer facilities are
Allenet al. Health and Quality of Life Outcomes2013,11:61 Page 12 of 15
provided or adapted to assist persons experiencing sen-sory (e.g., visual impairment) or physical disability. Researchers planning to assess quality of life experi-enced in the community should consider the relative value of these measures for addressing their research questions.
Limitations
A potential limitation of the current study lays in the imputation of missing baseline mental health item data. However, in this instance, the apparent cause of data missingness is known (the items were inadvertently omitted from the baseline ARMHS survey). This situ-ation is similar to that of planned missingness designs [43,44], wherein random sections of a cohort are asked subsets of questions for purposes of maximising the amount of information derived while reducing survey length. Moreover, in the current study, the imputed data performed as expected with respect to item and domain profiles, comparisons across cohorts and phases, and re-lationships with other scales.
A second potential limitation relates to the exclusion of participants without complete data. As the purpose of this paper was to describe the structure, group and tem-poral invariance of the AQoL-6D across two large co-horts, and a relatively low proportion of participants had incomplete data (11%), it was judged that observations with complete data were adequate to characterise the variability observed across cohorts and phases.
A third limitation relates to current results regarding the concurrent and convergent validity of the AQoL-6D. These results are largely based on associations from an older sample of persons from urban-inner regional areas (i.e., the Hunter Community Study); for example, the reported associations of the SF-36 and physiological measurements with the AQoL-6D may differ from find-ings based on younger age groups.
Finally, there is ongoing debate regarding the appro-priate statistics for reporting in CFA. While the majority of sources recommend that multiple fit indices should be considered in assessing model fit, some argue that the vulnerabilities of the χ2 statistic to large sample sizes may distract from reasonable model fit [45]. Others suggest that it is wrong to suggest that the non-perfect absolute model fit indicated by theχ2 statistic is necessarily trivial, and should provide a basis for investi-gating model misspecification [46]. The purpose of the current analyses was to identify a coherent structure under which an existing brief instrument characterised by coherent domain scores could be meaningfully ag-gregated; consequently, we have not reported the asso-ciated χ2 statistics, instead assessing the variance explained by the factor scores. In short, the parsimony and interpretability of the model was our primary goal –
to model practical methods of characterising, scoring and interpreting the aggregate descriptive system of the
AQoL-6D – in our case, for the ongoing purposes of
the xTEND project, but we are happy to share and rec-ommend this approach to the calculation of AQoL-6D summary scores.
Conclusions
To our knowledge, this is the first study to assess the fac-tor structure of the AQoL-6D outside its construction sample. We were able to confirm the internal validity of the six domains assessed by the AQoL-6D. These scores displayed a moderate level of temporal stability over the four year follow-up period, with physical factors displaying greater stability than psychological factors. Current find-ings suggest a two factor model, characterised here as physical and psychological quality of life impairment, pro-vides the best fit for the data when the AQoL-6D is ad-ministered as described in the general community. This model fits equally as well over two diverse cohorts and over the four year follow-up period. The concurrent valid-ity of domain and factor scores were upheld in light of their strong associations and shared variance with an established concurrent measure of health related quality of life. Evidence for the convergent validity of factors was demonstrated through a higher proportion of shared vari-ance with corresponding domains of physical and psycho-logical indices of personal functioning. The xTEND study demonstrates the value of pooling individual participant data from comparable longitudinal cohorts, particularly for the purposes of scale validation, where issues of factor invariance across groups and time are otherwise of con-cern, but untestable.
Endnotes a
For the purposes of this paper, the terms ‘items’,‘ do-mains and‘factors’ will be used in a consistent manner. ‘Items’ refer to the individual question(s) to which par-ticipants respond,‘domains’ refer to the first-order fac-tors these items characterise, and ‘factors’ refer to the second-order factors to which these domains relate (i.e., items can be combined to form domains, and domains can be combined to form factors).
Additional files
Additional file 1:Supplementary documentation and data.
Additional file 2:Appendix 1 AQoL-6D items and scoring.
Abbreviations
up and go; FEV: Forced expiratory volume; CFA: Confirmatory factor analyses; MGCFA: Multi-group confirmatory factor analyses; CFI: Comparative fit index; TLI: Tucker-Lewis index; RMSEA: Root mean square error of approximation; SRMR: Standardised root mean square residual; SMC: Squared multiple correlation.
Competing interests
The authors declare that they have no competing interests.
Authors’contributions
BJK and TJL led the ARMHS study and JRA led the HCS study from 2010. BJK, KJI, JRA and TJL led the program of research associated with the
combination of these studies as the eXtending Treatments, Education and Networks for Depression (xTEND) project. JA and TJL undertook the statistical modelling and generated the results. All authors provided interpretation of the results. JA drafted the manuscript and all authors contributed to its editing. All authors read and approved the final manuscript.
Acknowledgements
The authors would like to thank the participants in the Australian Rural Mental Health Study and Hunter Community Study, as well as all the staff, investigators and collaborators who have supported or been involved in these projects. The ARMHS study was funded by the National Health and Medical Research Council (Project Grants #401241 and #631061) and also supported by a Research Infrastructure Capacity Building Grant from the New South Wales Department of Health to the Australian Rural Health Research Collaboration. The HCS study was funded by: The University of Newcastle’s Strategic Initiatives Fund; the Gladys M Brawn Senior Research Fellowship scheme; the Vincent Fairfax Family Foundation, a private philanthropic trust; and supported by the Hunter Medical Research Institute. The current program of research, known as the eXtending Treatments, Education and Networks for Depression (xTEND) project, is supported by funding from beyondblue, Xstrata Coal and the Hunter Medical Research Institute. For more extensive acknowledgements of contributions to the ARMHS and HCS studies see [7] and [8] respectively.
Author details
1
Centre for Translational Neuroscience and Mental Health, University of Newcastle and Hunter New England Health, Newcastle, NSW, Australia.
2
Hunter Medical Research Institute, Newcastle, Australia.3Centre for Clinical Epidemiology and Biostatistics, University of Newcastle and Hunter New England Health, Newcastle, NSW, Australia.
Received: 23 November 2012 Accepted: 28 March 2013 Published: 17 April 2013
References
1. The WHOQOL Group:The World Health Organization quality of life assessment (WHOQOL): position paper from the World Health Organization.Soc Sci Med1995,41:1403–1409.
2. Richardson J, Peacock S, Iezzi A, Day N, Hawthorne G:Construction and validation of the assessment of quality of life (AQoL) mark 2 instrument research paper 24.Melbourne: Centre for Health Economics, Monash University; 2007.
3. Richardson J, Peacock S, Hawthorne G, Iezzi A, Elsworth G, Day N: Construction of the descriptive system for the assessment of quality of life AQoL-6D utility instrument.Health Qual Life Outcomes2012,10:38. 4. Richardson J, Atherton Day N, Peacock S, Iezzi A:Measurement of the
quality of life for economic evaluation and the assessment of quality of life (AQoL) mark 2 instrument.Aust Econ Rev2004,37:62–88.
5. Delbaere K, Close JCT, Heim J, Sachdev PS, Brodaty H, Slavin MJ, Kochan NA, Lord SR:A multifactorial approach to understanding fall risk in older people.J Am Geriatr Soc2010,58:1679–1685.
6. Keating CL, Moodie ML, Richardson J, Swinburn BA:Utility-based quality of life of overweight and obese adolescents.Value Health2011,14:752–758. 7. Kelly BJ, Stain HJ, Coleman C, Perkins D, Fragar L, Fuller J, Lewin TJ, Lyle D,
Carr VJ, Wilson JM, Beard JR:Mental health and well-being within rural communities: the Australian rural mental health study.Aust J Rural Health 2010,18:16–24.
8. McEvoy M, Smith W, D’Este C, Duke J, Peel R, Schofield P, Scott R, Byles J, Henry D, Ewald B,et al:Cohort profile: the hunter community study. Int J Epidemiol2010,39:1452–1463.
9. Inder KJ, Berry H, Kelly BJ:Using cohort studies to investigate rural and remote mental health.Aust J Rural Health2011,19:171–178.
10. Ring L, Hofer S, Heuston F, Harris D, O’Boyle C:Response shift masks the treatment impact on patient reported outcomes (PROs): the example of individual quality of life in edentulous patients.Health Qual Life Outcomes 2005,3:55.
11. Bryne BM:Structural equation modelling with AMOS: basic concepts, applications, and programming, second edition.2nd edition. New York: Taylor & Francis Group; 2010.
12. Sanson-Fisher RW, Perkins JJ:Adaptation and validation of the SF-36 health survey for Use in Australia.J Clin Epidemiol1998,51:961–967. 13. McHorney C, Ware J, Anastasia E, Raczek A:The MOS 36-item short-form health
survey (SF-36): II. Psychometric and clinical tests ofValidity in measuring physical and mental health constructs.Med Care1993,31:247–263. 14. Ware JE:SF-36 health survey: manual and interpretation guide.Lincoln, RI:
Quality Metric; 2000.
15. Kessler RC, Andrews G, Colpe LJ, Hiripi E, Mroczek DK, Normand S-LT, Walters EE, Zaslecsky AM:Short screening scales to monitor population prevalences and trends in non-specific psychological distress.Psychol Med2002, 32:959–976.
16. Kessler R, Barker P, Colpe L, Epstein J, Gfroerer J, Hiripi E, Howes M, Normand S, Manderscheid R, Walters E, Zaslavsky A:Screening for serious mental illness in the general population.Arch Gen Psychiatry2003, 60:184–189.
17. Deiner E, Emmons R, Larsen R, Griffin S:The satisfaction with life scale. J Pers Assess1985,49:71–75.
18. Pavot W, Diener E:The satisfaction with life scale and the emerging construct of life satisfaction.J Positive Psych2008,3:137–152.
19. Podsiadlo D, Richardson S:The timed“Up & Go”: a test of basic functional mobility for frail elderly persons.J Am Geriatr Soc1991,39:142–148. 20. Micro medical Spiro USB Spirometer.Kent, UK: Cardinal Health. 21. Spida 5 spirometry software.Kent, UK: Micro Medical.
22. IBM Corp:IBM SPSS statistics for windows. Version 20.0.Armonk, NY: IBM Corp; 2011. Released 2011.
23. Arbuckle JL:IBM SPSS Amos 20. Version 20.0.Chicago: SPSS; 2011. 24. Hancock GR, Mueller RO:Rethinking construct reliability within latent
variable systems. InStructural equation modeling: present and future a festschrift in honor of Karl Jöreskog.Edited by Cudeck R, Du Toit S, Sörbom D. Chicago: Scientific Software International; 2001.
25. Brown TA:Confirmatory factor analysis for applied research.New York: The Guilford Press; 2006.
26. Bagozzi RP, Yi Y, Phillips LW:Assessing construct validity in organizational research.Adm Sci Q1991,36:421–458.
27. Steenkamp JB, Baumgartner H:Assessing measurement invariance in cross-national research.J Consum Res1998,25:78–90.
28. Hu L, Bentler PM:Cutoff criteria for fit indexes in covariance structure analysis: conventional criteria versus new alternatives.Struct Equ Modeling: A Multidisciplinary Journal1999,6:1–55.
29. Shrout PE, Fleiss JL:Intraclass correlations: uses in assessing rater reliability.Psychol Bull1979,86:420–428.
30. Slade T, Grove R, Burgess P:Kessler psychological distress scale: normative data from the 2007 Australian National Survey of Mental Health and Wellbeing.Aust N Z J Psychiatry2011,45:308–316.
31. Australian Bureau of Statistics:Body Mass Index by age and sex–Australia (4364.0.55.001). Australian Health Survey: First Results, 2011–12.Canberra: Australian Government; 2012.
32. Stevenson C:Developing Population Norms for SF-36 Scales from a Sample Survey, Health Outcomes & Quality of Life Measurement Australian Health Outcomes Clearing House. Canberra ACT, Australia: Australian Institute of Health and Welfare; 1995.
33. Gore C, Crockett A, Pederson D, Booth M, Bauman A, Owen N:Spirometric standards for healthy adult lifetime nonsmokers in Australia.Eur Respir J 1995,8:773–782.
34. Bohannon RW:Reference values for the timed Up and Go test: a descriptive meta-analysis.J Geriatr Phys Ther2006,29:64–68.
35. Pondal M, del Ser T:Normative data and determinants for the timed“Up and Go”test in a population-based sample of elderly individuals without gait disturbances.J Geriatr Phys Ther2008,31:57–63.
Allenet al. Health and Quality of Life Outcomes2013,11:61 Page 14 of 15
36. Ewald B, Duke J, Thakkinstian A, Attia J, Smith W:Physical activity of older Australians measured by pedometry.Australas J Ageing2009,28:127–133. 37. Richardson J, Day N, Hawthorne G, Peacock S, Iezzi A:AQoL-6D algorithm.
http://www.aqol.com.au/scoring-algorithms.html; 29th October 2012. 38. Australian Bureau of Statistics (ABS), Canberra 38. Australian Bureau of Statistics:
National health survey: SF36 population norms 4399.0.Australia: ABS; 1995. 39. Behavioural Epidemiology Unit:South Australian population norms for the
short form 36 (SF-36) health status questionnaire.Adelaide: South Australian Health Commission; 1995.
40. Grande ED, Taylor AW, Catcheside B:Health related quality of life in south Australian health regions as measured by the SF-36, Population research and outcome studies unit. South Australia: Department of Health; 2005. 41. Richardson J, Khan MA, Chen G, Iezzi A, Maxwell A:Population Norms and
Australian Profile using the Assessment of Quality of Life (AQoL) 8D Utility Instrument.Melbourne: Centre for Health Economics, Faculty of Business and Economics, Monash University; 2012.
42. Aaronson NK:Quantitative issues in health-related quality of life assessment.Health Policy1988,10:217–230.
43. Graham J, Taylor B, Olchowski A, Cumsille P:Planned missing data designs in psychological research.Psychol Methods2006,11:323–343.
44. Raghunathan TE, Grizzle JE:A split questionnaire survey design. J Am Statist Assoc1995,90:54–63.
45. Fayers P, Aaronson N:“It ain’t over till the fat lady sings”: a response to Cameron N. McIntosh, improving the evaluation of model fit in confirmatory factor analysis.Qual Life Res2012,21:1623–1624.
46. McIntosh C:Improving the evaluation of model fit in confirmatory factor analysis: a commentary on Gundy, C.M., Fayers, P.M., Groenvold, M., Petersen, M. Aa., Scott, N.W., Sprangers, M.A.J., Velikov, G., Aaronson, N.K. (2011). Comparing higher-order models for the EORTC QLQ-C30. Quality of Life Research.Qual Life Res2012,21:1619–1621.
doi:10.1186/1477-7525-11-61
Cite this article as:Allenet al.:Construct validity of the Assessment of Quality of Life - 6D (AQoL-6D) in community samples.Health and Quality of Life Outcomes201311:61.
Submit your next manuscript to BioMed Central and take full advantage of:
• Convenient online submission
• Thorough peer review
• No space constraints or color figure charges
• Immediate publication on acceptance
• Inclusion in PubMed, CAS, Scopus and Google Scholar
• Research which is freely available for redistribution