What we do not know about COVID-19 and Social Distancing
Samina Masood
Department of Physical and Applied Sciences
University of Houston-Clear Lake
Houston, TX 77059, USA
Abstract
We present the detailed calculations of social distancing requirement. A comparative study of the growth pattern and death tolls in different communities indicates that the growth pattern of infected patients and death rate follow the similar distribution with different parametrizations. Every distribution follows an exponential growth pattern curve, like other microbes, then reaches the saturation point and eventually decays. However, the argument for the exponential function depends on several parameters unbeknownst, as of yet. However, the slope varies differentially for various epicenters and seems to have a relationship with parameters such as accessibility to healthcare facilities, pre-existing medical conditions, socio economic conditions and lifestyle. The mismatch of the growth pattern is also linked with the impact of various other factors and a premature interpretation of limited data. Novel behavior of the virus brought many surprises, opened up new venues for medical research, and the need for the more detailed study of pathogens in the light of the interaction of RNA and DNA. The adaptability to diverse ecological conditions and the relevant modification in the structure is also worth investigation. The genetic modification can be studied using quantum mechanical probabilistic approach.
1.
Introduction
A novel virus, identified as SARS-COV-2, caused the worldwide spread of a new disease named as COVID-19 [1-9] in 2019-2020; The Pandemic created by this disease could take more than one hundred thousand human lives and exhausted most of the medical resources everywhere, including the developed nations, in a few weeks. This disease spread like a wildfire and took over the entire world. Unusual spread of the disease and quick shifting of the hotbeds defeated all human efforts to control its worldwide spread to save humanity from the biggest loss of lives of the century due to an outbreak of a disease. Considering all the human efforts, this biggest loss is still a minimal loss because this pandemic could spread most aggressively around the globe and created its epicenters to almost every heavily populated region in the world. The death toll and number of cases were mainly related to the density of population and how quickly the appropriate safety measures were taken. It continued to transmit across continents.
The recently discovered novel coronavirus is originally identified from a new type of Severe Acute Respiratory Syndrome (SARS-COV-2), reported in China in 2019. This Corona Virus of type 2, named as CoV-2, is a novel form of previously emerged deadly virus COV, reported in 2015. SARS-COV belongs to a class of viruses, named as Coronaviridae (commonly known as coronavirus) and lies in
the sub-group beta coronavirus. Its novel behavior was associated with its new mutated genetic
expression, which seems to originate from a similar genome, found in bats [10]. Indicating its birthplace. This contiguous disease spreads too fast and infects human body more severely than any other earlier examples. It is expected to have mutated genome of a virus, found in bats with a unique spike protein that loves to interact with a commonly found receptor in human body, named as angiotensin converting enzyme 2 (ACE 2). The respiratory disease generated because of this interaction is called COVID-19. The same ACE 2 is also found in other regions of the body including brain. There is an evidence of adverse effect on brain and heart as well. It is known that ACE 2 enzyme is created from a normal ACE enzyme and is required by SAR-COV-2 cell entry. The epithelial membrane somehow is a safe haven for this virus and ACE 2 facilitate the cell entry for corona virus in epithelial membrane more easily. It reaches lungs and damage them quickly and could be fatal. It has been a very scary virus because its infection with all the symptoms take lives in a few days, especially for patients with pre-existing medical
conditions. It is still too early to know how adversely the virus is affecting the cured patients. It may have permanent impact on cardiovascular system, respiratory tract and lungs. Other parts of body may have some permanent damages as well.
In the next section, we discuss the range of the freefall trajectory of the virus and section 3 comprise of the comparative study of the existing preliminary data. In the last section, results of the previous sections are discussed and some recommendations are made for future research in the end.
2.
Trajectory of Transmission of Coronavirus
COVID-19 spread like a wildfire. The globalization of the world did not let it confined to certain area and it took a hold across oceans and became the unparalleled pandemic of the century, which claimed a more than one hundred thousand lives in a few weeks. We are still going through his pandemic and cannot clearly see the light at the end of this tunnel. Its accelerated spreading ability made scientists to realize a dire need of search for vaccination and develop a treatment of procedure. This goal can be achieved by knowing the details about the genetic structure of the virus and analyzing the existing data. Worldwide financial crisis and stranded global life with international lockout seems to change the human life by temporarily de-globalizing the world. This abrupt change in social life with forced limitations and feelings of helplessness has captured the peace of mind giving anxiety, depression, frustration and fear of losing loved ones in addition to personal insecurity. Whereas the lack of information about the nature of
the virus and the understanding of the associated disease with all the burden of healthcare needs created an extremely challenging situation and loss of life was almost impossible without social distancing and even lockdown public places to avoid contiguous spread.
It was advised to maintain 6 feet social distance and then a detailed study showed it could spread to a larger distance, as well. In this paper, we recalculate the range of viral trajectory, using a simple physical phenomenon of bullet motion. Virus is ejected from mouth of a suspected individual in a particular direction. The trajectory of the motion of virus will therefore depend on the perpendicular distance of the point of ejection from the ground, which is related to the height and position of the source. The other important factor is the direction of ejection of virus from the
source with respect to ground because its final destination will depend on the component of the initial velocity, which is parallel to the ground. The initial speed of the virus will depend on the fact if it came with breathing or sneezing and affected by the wind speed. These important factors are used to a set of simple
kinematical equations to calculate the possible range for the spread of the virus. Figure 1 shows the schematic diagram for the possible trajectories of the viral motion. This little microscopic monster has the probability to follow several different paths depending on the original direction of ejection and the component of velocity parallel to the ground. We calculate the time of survival of virus in the air, considering its initial speed and the position. However it can be intercepted anywhere by dust particles or leave its tract due to wind or settle on ground quickly due to rain.
In this paper, we calculate the maximum range of the fall of virus on the ground. It can be captured from anywhere until it
reaches the ground. If nothing else is available to intercept its motion, it follows the regular freefall motion under gravity as shown in Figure 1. The trajectory of motion mainly depend on the initial velocity and finding the correct trajectory will depend on the so-called x-component of the initial velocity of the viral trajectory. It indicates how it is related to the height of the suspect and the initial speed of ejection of the virus. The minimum time of travel can be determined from the perpendicular distance from the ground and is given as
Time of flight = ට
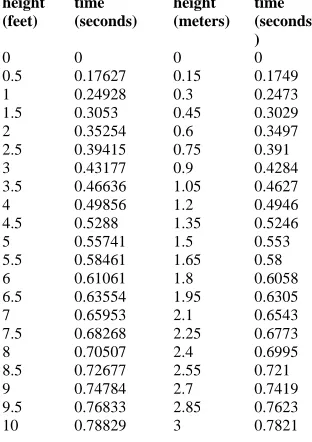
2×height of the ejection pointacceleration due to gravity (1)We have used the height as a perpendicular distance from the ground, between 0 to 10 feet to almost entire range of covering possible cases of ejection of virus parallel to ground for every possible human height, including children and people sitting on the ground to standing at a little height. The range of the distribution of virus is calculated as linear distance covered during this time. These values for the time of viral transfer are given in the Table I. We express height both in meters and in feet and calculate the time of reaching ground in second. It is noticed that it takes only a fraction of a second to reach the ground un-intercepted. This time of flight, trajectory of motion and the linear distance of the falling point of the virus
height (feet)
time (seconds)
height (meters)
time (seconds )
0 0 0 0
0.5 0.17627 0.15 0.1749 1 0.24928 0.3 0.2473 1.5 0.3053 0.45 0.3029 2 0.35254 0.6 0.3497 2.5 0.39415 0.75 0.391 3 0.43177 0.9 0.4284 3.5 0.46636 1.05 0.4627 4 0.49856 1.2 0.4946 4.5 0.5288 1.35 0.5246 5 0.55741 1.5 0.553 5.5 0.58461 1.65 0.58 6 0.61061 1.8 0.6058 6.5 0.63554 1.95 0.6305 7 0.65953 2.1 0.6543 7.5 0.68268 2.25 0.6773 8 0.70507 2.4 0.6995 8.5 0.72677 2.55 0.721 9 0.74784 2.7 0.7419 9.5 0.76833 2.85 0.7623 10 0.78829 3 0.7821
mainly depend on the height and the initial velocity of virus. We have used the speed of virus between 1m/s to 11m/s. A slower virus will fall closer and a faster than this range will fall further away. This calculation only gives the ideal case of minimum time for survival of virus, which gives the indication of the trajectory. However, it almost never reaches the ground so quickly because it is intercepted by dust particles, distracted by wind, and affected by various environmental conditions. In Figure 2 we have plotted a distribution of virus based on the height of the source of virus and its destination on the ground. The presence of anyone within the shaded area is exposed to interact with the virus and its likelihood is related to the thickness of the shaded region. Entrance of the virus in the human body through the respiratory tract may be the most dangerous form of exposure and should have the worst impact.
The calculation of the range is true for the situation where transmitter and the receptor are facing each other. This shaded region also indicates the probability distribution for the existence of virus. The concentration of virus reduces with distance and influenced by the curved trajectory. It can easily be seen from the plot of Figure 2 that the virus can travel even more than 20 feet if there is no interruption. The intensity of virus will obviously decrease with the distance as well. Six feet distance works for the most part, considering the average height and the direction of mouth but it may not work in some cases. However, up to 10 feet distance is much safer, especially for short people. Also, when the virus load is ejected, a fraction of this may initially splashed upwards (like a projectile) before it starts to follow the freefall trajectory under gravity. Unless we can confirm that an extremely low absorption of virus may not have adverse effect because the average immune system can take care of it or it is inhaled or not, we should not take any risk. Also, if there is the spread between two person even the six feet distance can work due to conceration, especially with asymptomatic carriers with moderate viral load. However if there are groups of people distributed at six feet distances, interference of viral trajectory from different ejectors can maks it much worse.
1.
Preliminary data analysis
The current discussion is based on overall universal data for COVID-19 cases (January 23 to April 13 (2020)), presented in Ref.[11]. With the current testing ability and with all impressive healthcare modern services, the loss of life in 80 days is above 100K. Human response and late realization of the severity of the problem made it worse but the main cause was the novelity of the pandemic. The rate of spread of the disease generally get faster exponentially because multiple sources are created with time and this trend is clearly seen everywhere. However the precautionary measures personally protecting equipment help in reducing the contingency rate. The overall distribution of confirmed COVID-19 looks like the one given
Rang
e of viral
fl
igh
t (feet)
0 5 10 15 20 25
0 0.5 1 1 1.5 2 2 2.5 3 3 3.53.5 4 4.54.5 5 5.55.5 6 6.56.5 Maximum (linear) range of the fall of virus
Figure 2: Maximum distance of travel for virus in free space under gravity.
R
ang
Figure 3: Death per million population
in Figure 3. In this plot, we study the death rate in one million population within the first 80 days of the Pandemic. In this sectiond we analysis some preliminary data from the same source (for comparison) and discuss possible explanation of the data. The data from different sources is not much different either and some of the details are found using the references from the same source as well. The difference in values is so small in percentage that analysis
from any source falls within the small and acceptable error margins. We give the initial plots of data from different locations for the first 82 days on the same graph to compare the data to discuss the initial possible approach to understand the behavior of the virus. These graphs indicate how the growth rate in the number of infected cases and the death rate changes due to several
factors, which mainly include the population density, exposure to crowds in gatherings,
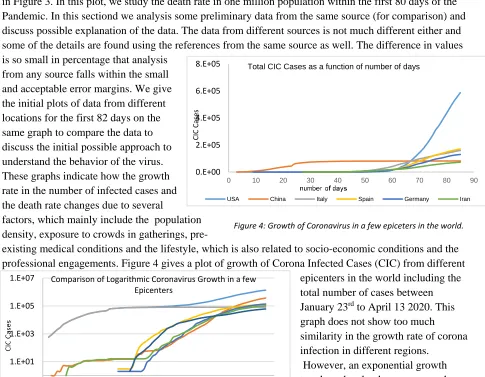
pre-existing medical conditions and the lifestyle, which is also related to socio-economic conditions and the professional engagements. Figure 4 gives a plot of growth of Corona Infected Cases (CIC) from different
epicenters in the world including the total number of cases between January 23rd to April 13 2020. This graph does not show too much similarity in the growth rate of corona infection in different regions.
However, an exponential growth trend can be clearly seen everywhere. Comparison of growth rate at the logarithmic scale is given in Figure 5, where this difference of trend is clearly World Spain Italy France Germany China UK Iran Turkey Belgium Switzerland Netherlands Canada Israel Sweden Chile Romania Panama Andorra Cyprus Honduras Taiwan San Marino Mauritius Nigeria Senegal Bolivia DRC Brunei Liechtenstein Togo
Bermuda Gabon Antigua and Barbuda Deaths/million population 1.E-01 1.E+01 1.E+03 1.E+05 1.E+07
20-Jan 9-Feb 29-Feb 20-Mar 9-Apr
Comparison of Logarithmic Coronavirus Growth in a few Epicenters
World USA China Italy Spain Germany Iran
Figure 5: Logarithmic graph of CIC in different areas as compared to the entire world 0.E+00 2.E+05 4.E+05 6.E+05 8.E+05
0 10 20 30 40 50 60 70 80 90
Total CIC Cases as a function of number of days
USA China Italy Spain Germany Iran
CI
C Ca
ses
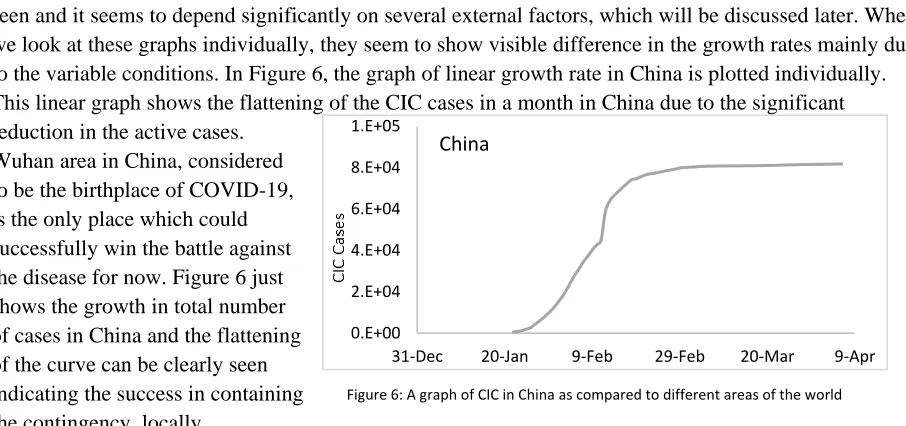
seen and it seems to depend significantly on several external factors, which will be discussed later. When we look at these graphs individually, they seem to show visible difference in the growth rates mainly due to the variable conditions. In Figure 6, the graph of linear growth rate in China is plotted individually. This linear graph shows the flattening of the CIC cases in a month in China due to the significant reduction in the active cases.
Wuhan area in China, considered to be the birthplace of COVID-19, is the only place which could successfully win the battle against the disease for now. Figure 6 just shows the growth in total number of cases in China and the flattening of the curve can be clearly seen indicating the success in containing the contingency, locally.
The reduction in number of active cases and different stages of the infectious disease from its
exponential growth to almost exponential recovery in China is plotted in Figure 7. It shows the advanced growth pattern including the reduction in the active CIC. China provides a unique example of the growth rate because it is already showing the exponential damping in the growth cycle. However, when we look at the data of active CIC, outside China, the growth rate seems to be even faster. Moreover, the peak is not necessarily touched in around a month as it was observed in Wuhan. Also the maximum growth rate and the death rate stays at maximum for a long time. Significant reduction has not yet be seen anywhere. The only other relatively similar local example is the King county Seattle, but it has spread in other regions of Washington state and cannot be considered as fully contained. The rapid growth in active CIC seems to
depend on several random variables and needed to be studied by
analyzing individual cases in the light of supporting data and the timeline. When we look at the active cases in the same hotbed. When we look at the active cases in other epicenters in Figure 8, a trend
similar in the growth rate is seen but the 0.E+00 2.E+04 4.E+04 6.E+04 8.E+04 1.E+05
31-Dec 20-Jan 9-Feb 29-Feb 20-Mar 9-Apr
China 0.E+00 1.E+04 2.E+04 3.E+04 4.E+04 5.E+04 6.E+04 7.E+04
Jan-20 Jan-20 Feb-20 Feb-20 Feb-20 Mar-20 Mar-20 Mar-20 Apr-20
Active CIC in China
Figure 8: A plot of the active cases in China changing by dates.
0.E+00 2.E+05 4.E+05 6.E+05 8.E+05 1.E+06 1.E+06 1.E+06
-10 10 30 50 70 90
Active CIC Cases as a function of number of days
Total World USA Italy Spain Germany Iran
Figure 6: A graph of CIC in China as compared to different areas of the world
peak is no way similar to the peak in China, which lead to decay. We seem to hit the peak in other spots like Italy and US (mainly shows the trend of NYC) but the peak does not turn around towards the falling track yet. After reaching a peak in Wuhan, within a month, it started to decrease in a couple of days. However, the decrease in the active cases was relatively slower than the increase but the similar decay in the active cases due to the reduction in new cases and parallel increase in recovery is not seen anywhere. Iran is the worst example which showed the peak and is almost staying at the peak for extended period that can obviously be related to the economic conditions, resources and sanctions but it can affect the speed of recovery in the rest of the world as well. At the moment, unless the spread is controlled everywhere, we will not be able to resolve the issue and it may keep coming back.
After looking at the death rate, we see that the decrease in growth rate was contributed by the continuity in Corona related death even after the peak arrived. Therefore, after a small plateau, and then actually a downfall of growth in number of active cases is seen with a much slower rate.
On the other hand, the behavior of death rate plots is a little different. Availability of resources including medical facilities, healthcare system, socio-economic conditions and the lifestyle control death rate. So the death rate is not expected to
follow similar trend everywhere. Variability in demographic mix and some other individual factors show a great variety in the death rate pattern in Figure 9. Death rate seems to show relatively unique behavior and every case seem to have individual behavior. It is also interesting to see that a significant growth in the death rate seems to start
Figure 9: A Comparison of death rate for the first few days
around the same time but increase death rate does not follow a similar trend in different regions.
Regardless of economic disaster and associated anxiety, which can be considered as parallel pandemic, it
was still too hard to handle a disease, which is not even previously known and has no treatment available. China has been the original epicenter of this pandemic and had relatively more confinement. It did not do
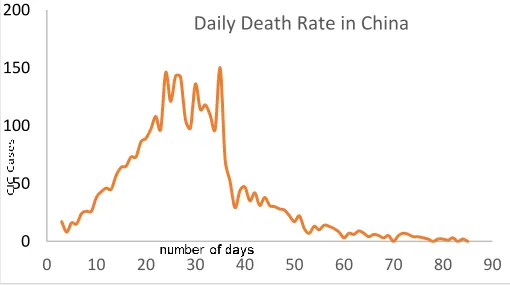
required measures to contain the disease because either it did not properly calculate the rate of spread and its outcomes. China did not manage to contain it in its own country and let it spread out internationally, causing hundreds and thousands of lives and economic disaster, which led to an outbreak of anxiety, fear of death and fear of loss of the loved ones. People brought disease to almost everywhere from Wuhan directly or indirectly, while the rest of the world was Figure 10: A plot of daily death rate in China
0 500 1000 1500 2000 2500
0 10 20 30 40 50 60 70 80 90
Daily Death Rate
USA China Italy Spain Germany Iran
0 50 100 150 200
0 10 20 30 40 50 60 70 80 90
kept unaware of the facts or was not fully aware of it. China had a luxury to contain it locally and it was done successfully. China therefore shows almost normal distribution (Figure 10) in death rates. This trend is not successfully seen anywhere else yet.
In the light of all the existing data, we have partial understanding of the spreading trend of the disease and its possible outcome. However, there are still several unanswered questions and we address them in the next section with a few recommendations that how should we go from here. Control of this pandemic is a much bigger challenge than what we have seen so far. We know that we could have taken initial drastic measures and had not seen this loss of lives or socio-economic disaster. Even now, if things are not carefully accessed and individual approach is adopted we may not control it and face the danger of a secondary and tertiary waves of pandemic which may be even more severe, This virus has to cleaned from the entire world simultaneously, otherwise it will stay as an invisible monster even if a treatment is found.
Discussions and Recommendations
The adaptability of living cells and the adjustment ability with the ecological conditions makes it difficult to predict the exact impact of COVID-19 infection on any individual cell. What we know is that we do not still have definite answers to several important questions because they are associated with so many variables that a lot of testing is required to conclude the correct results. Even the existing data is not suffice to draw a definite conclusion. Our current consensus is mainly based on the known class of viruses and the available data obtained by the spread of the COVID-19 in general, which is integrated with the existing raw data as well. Some of the unanswered common questions are:
What is the true survival temperature range of the virus? There is hope that it dies at a high temperature, but it definitely replicates inside the living cell, and should survive at body temperature. It is manifested in winter so it has demonstrated the capacity to spread in cold weather as well.
COVID-19 belongs to a class of pathogens, and is a perfect parasite, which will not survive unless attached to a living cell. However, it could possibly reside in microbial cells.
It may be able to attach to a dust particle or other surfaces and survive for several hours.
What is the minimum distance required to avoid the infection transmitted from a person with a high viral load? Of course, it will depend on the population density and the concentration of virus in the air. This spread can be controlled with social distancing and proper hygienic practices.
It is a mutated virus. Is it still going through some modifications in its genome due to its interaction with different communities and different environments, which may not change it much but may change the way it infects?
How long is the actual incubation period? What accounts for the observed range between 5 to 24 days? More importantly, what does this imply for the length of quarantine measures question?
Some mammals/pets like cats and dogs may not be as susceptible but they can still be the carrier of the virus. Even plants, clothes and other polymers cannot be totally ruled out as carriers.
Under the current circumstances, we know the genome of the virus, but its infectious behavior and prognostic operation is to be elucidated fully. Those who have survived and recovered the coronavirus relatively unscathed do posses antibodies, which suggest less risk of reinfection. The genetic modification of the virus can be studied using quantum mechanical probabilistic approach.
Quantum mechanical tunneling or the describing the attachment of the virus with the ACE 2 can be treated as a potential well to calculate the probability of attachment and the probability of being symptomatic even after exposing to the virus.
We also know that natural selection mechanism seems to have a tendency of inoculate antibodies after every pandemic because there is a possibility of developing antibodies with occasional exposures. Under these circumstances, we need to take safety measures and let the virus ride its course until we find a treatment or we are able to figure out the response of our immune system towards the viral exposure. Some of the required immediate steps are enlisted below:
We need to accept the reality that we have to deal with this virus for perceived future and we do not have a simple solution or an easy way out. In this situation, anxiety and fear have a potential to overpower the capacity to combat this crisis. We need to assuage these misgivings through proper education without submission to ignorance.
It is realized that the spread of pandemic cannot be fully controlled by the administrative enforcement. Governments play pivotal role with lockdown, healthcare resources and financial support but public has obligations to support the essential measures against the spread of the disease.
Misinformation and the proliferation of the conspiracy theories must be carefully moderated and misguiding messages should be unarmed. The public should instead be equipped with scientific literacy so that they have appropriate tools to critically analyze the available data and draw factual results.
Moreover, the fight against the virus is more daunting task for people with compromising medical conditions, bad immune system, age factors or lifestyle. Smoking, drinking, obesity, eating habits and old age may influence the severity and outcome of the infection.
Marginalized groups are more susceptible due to special needs and may not afford social distancing and staying home.
We need to check if the cured patients can still be a carrier of virus upon exposure, even if they are not infected and are asymptomatic.
It should be carefully determined that if the antibodies developed in survived patients can actually be used to treat infected patients with convalescent plasma therapy.
Compromised health of cured persons with permanent damages to the human body is yet unknown. We may have to prepare to face some surprises in that direction, as well.
There may be more than one viral strains of virus and they may need different antibodies for vaccination so the process of finding a vaccine may be much more complicated than it appears to be.
At this point, premature lifting of lockdown measures or abruptly loosening the social distancing may be the worst steps in this direction. It may not only initiate the second wave of the outbreak of the disease but also virus more out of control. Asymptomatic community should be tested out to see who is safe to the viral exposure. Before getting, some more knowledge about who is not a suspect, even after exposure is the first step towards planning to reopen businesses. Existing data of infected people or the growth curve in infection is not a good measure to consider the possibility of opening. Especially while we have no preventing vaccine or no tested treatment available. We do not yet have the capacity to test every
individual before exposure. Moreover, we are not sure that how long an exposed person can stay negative during the incubation period and how the ability to infect others can be determined. Possibility of
recurrence and the immunity for virus for the recovered individuals is still not clear. There is a minimal study about the study of viral impact on brain and other regions of human body. We are not sure how the people with specific medical conditions respond to the viral exposure and how can they be protected.
Acknowledgement: The author will like to thank the graduate students Faiz Khan and Alishpa Masood
for their help in proofreading the draft and some helpful suggestions.
References and Footnotes
1. Bai Y, Yao L, Wei T, et al. Presumed Asymptomatic Carrier Transmission of
COVID-19. JAMA. 2020;323(14):1406–1407. doi:10.1001/jama.2020.2565
2. Zhe Xu, et al, Pathological findings of COVID-19 associated with acute respiratory distress syndrome, The
Lancet Respiratory Medicine, Volume 8, Issue 4, 2020,
3. Yeshun Wu, et.al. Nervous system involvement after infection with COVID-19 and other coronaviruses,
Brain, Behavior, and Immunity, 2020,
4. ,The Lancet Respiratory Medicine, Volume 8, Issue 4, April 2020, Pages e26
www.thelancet.com/respiratory Vol 8 April 2020
5. Xiaobo Yang, et. al;` Clinical course and outcomes of critically ill patients with SARS-CoV-2 pneumonia
in Wuhan, China: a single-centered, retrospective, observational study’, Published online. https://doi.org/10.1016/ S2213-2600(20)30079-The proximal origin of SARS-CoV-2 . Andersen
6. KG, Rambaut A, Lipkin WI, Holmes EC, Garry RF. Nat Med, 17 March 2020. [Epub ahead of publication]
Quantifying SARS-CoV-2 transmission suggests epidemic control with digital contact tracing.
7. Ferretti L, Wymant C, Kendall M, Zhao L, Nurtay A, Abeler-Dörner L, Parker M, Bonsall D, Fraser C.
Science. 2020 Mar 31. [Epub ahead of print]
8. Joseph Thomas Ortega , Maria Luisa Serrano , Flor Helene Pujol , Hector Rafael Rangel *,`Role of changes
in SARS-COV-2 SPIKE Protein in the interaction with the Human ACE2 Receptor: An in Silico Analysis`, EXCLI Journal 2020;19:410-417 – ISSN 1611-2156 Received: February 25, 2020, accepted: March 16, 2020, published: March 18, 2020
9. Hong Peng Jia, Dwight C. Look, Lei Shi, Melissa Hickey, Lecia Pewe, Jason Netland, Michael
Farzan, Christine Wohlford-Lenane, Stanley Perlman, Paul B. McCray Jr, ` ACE2 Receptor Expression and Severe Acute Respiratory Syndrome Coronavirus Infection Depend on Differentiation of Human Airway Epithelia’,
DOI: 10.1128/JVI.79.23.14614-14621.2005
https://www.sciencealert.com/more-evidence-suggests-pangolins-may-have-passed-coronavirus-from-bats-to-humans