A Direct Measurement Method of Yarn Evenness Based
on Machine Vision
Junjuan Li, Baoqi Zuo, Chen Wang, Wenxiao Tu
Soochow University, College of Textile and Clothing Engineering, Suzhou, Jiangsu CHINA
Correspondence to:
Baoqi Zuo email: [email protected]
ABSTRACT
In this paper, a new yarn evenness measurement method based on machine vision is introduced, which is a direct measurement process, as opposed to other methods. Two types of yarns (i.e., same yarn count but different quality grade and same quality grade but different yarn count) are measured to determine the coefficient of variation unevenness, which can be compared with the results of USTER ME100. The yarn images are continuously captured via an image acquisition system. To determine the main body of the yarn accurately, the yarn images are processed sequentially by a threshold segmentation and morphological opening operation. Next, the coefficient of variation (CV value) of the diameter is calculated to characterize the yarn evenness. Different image processing methods are used and compared to obtain a suitable method for use in the experiment. A more accurate, more efficient, and faster measurement system will meet requirements of the manufacturing of yarn; the suitable performance of the proposed method is illustrated using experimental results.
Keywords: Yarn evenness, machine vision,
pictorial indices, image processing
INTRODUCTION
One of the important pictorial indices to express yarn evenness is the coefficient of variation unevenness. The grey cotton yarn evenness can be expressed as the blackboard unevenness or the coefficient of variation unevenness, which satisfies the grey cotton yarn standards (GB/T 398-93). The blackboard unevenness is commonly used, but the result is not very accurate because of human factors. If two pictorial indices are not consistent, then the coefficient of variation unevenness is used to express the result.
Currently, the capacitance method is commonly used. The representative equipment used to perform the capacitance method is the USTER evenness tester, which can determine the coefficient of variation unevenness, thick place number, thin place number, and nep number. The capacitance method is an internationally accepted method, although it is not suitable for on-line measurement and cannot directly provide the characteristics of the yarn structure. Therefore, increasing numbers of methods are being studied for use in measuring yarn evenness. Some methods being developed may be more accurate, their operations may be easier, or their speeds may be faster [1-5].
Qin W.G. introduced an on-line method of measurement of the yarn evenness using a CCD image sensor. The sensor is mounted onto a movable bracket of a small car to obtain the images, which can determine the yarn coefficient of variation unevenness after computer and digital image processing. This method is executed quickly and accurately, and the result is more accurate than other methods. This method not only improves the quality of the yarn but also improves status of the textile industry [6]. Using a similar method, Sparavigna, Broglia, and Lugli evaluated the yarn evenness via optical measurement [7]. The system consisted of a CCD camera which records the yarn shadow and a photo receiver which records the light diffused from the yarn. Using this system, the signal is used to express the change of the yarn diameter [8-10].
using digital image processing technology [11]. The seriplane digital images can be obtained after smoothing treatment, thresholding segmentation and image impairing. Next, the average diameter of the seriplane digital image is obtained via accurate calculations. In addition, the process is automatic, thereby enabling further time and labor savings [12-16].
In this paper, digital image processing is used to analyze images obtained by a camera. Such digital image processing is a form of continuous processing, and the result of such processing will be compared with the result of the USTER evenness tester. Two categories of yarn are discussed in the experiment. Most importantly, the measurement method can directly determine the result by determining the value of the yarn diameter. In contrast to the other methods currently being used, the accuracy of the diameter measurement is up to several microns. Such a level of accuracy will meet the future requirements.
EXPERIMENTAL MATERIALS
In this paper, two large classes of yarns are used to determine the coefficient of variation unevenness. One class has the same count but a different quality grade defined by the USTER CLASSIMAT 5, and the other is of the same quality grade but has a different count. Table І presents a summary of the data for the samples tested. The data include the metric count, blending ratio, and yarn quality grade for all seven varieties of yarn where each variety was tested with five samples to determine the value; the values can be compared with the results obtained using the USTER ME100.
MACHINE
The framework of the yarn evenness measurement method is depicted in Figure 1. The method uses an image acquisition system, a computer processing system and an USTER evenness tester. The image acquisition system includes the following: CCD line sensor (6), telecentric lens (7), light source (3) and image capture card. A Dasla industrial CCD line sensor (S2-1y-05H40) is selected to meet the accuracy requirements. To match with the selected linear scan sensor, Xcelera-cl LX is chosen as the image capture card model. An Utron telecentric lens (MGTL60C) with 6× magnification is used based on the field of vision in this system. The components of the computer processing system are: the computer image processing module and the result output. Halcon, which is the software used worldwide in machine vision, is used to analyze the images. A PC with a core i7 processor operating at 3.40 GHz is used for image processing and presenting the results. The model of the USTER evenness tester used is USTER ME100.
As shown in Figure 1, a single cotton yarn (1) is pulled by two rollers (4, 5) at a certain speed. The images of the moving yarn are captured using the image acquisition system. Back light by illustration is adopted. Thus, the light source (3) is placed on one side of the yarn, and the other devices of the image acquisition system are placed on the other side. Next, the yarn images are sent to the computer image processing module to be analyzed. Finally, the CV value of the diameter is calculated to characterize the evenness, and the result is exported. At the same time, the CV value of height determined by the USTER ME100 (8) is obtained. The result of the new measurement system can be compared with the USTER ME100 measurement.
TABLE І. Yarns used in this experiment.
Number Metric Count
Blending Ratio
(c:cotton) Yarn Quality Grade
The Number of Samples
FIGURE 1. Yarn evenness measuring system schematic: (1) cotton yarn, (2) guide bar, (3) light source, (4),(5) drive roller, (6) linear scan CCD sensor, (7) telecentric lens, (8) USTER sensor.
IMAGE PROCESSING
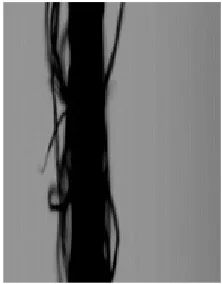
As shown in Figure 2, image quality is slightly affected by noise, and some hairs are found around the main body of yarn, which is difficult to separate from the yarn. To separate the yarn from the background and extract the main body, an image processing method consisting of thresholding segmentation and morphological opening operation is used in this measurement system.
Thresholding Segment
To separate the yarn and the background, a gray-level threshold is used in this experiment. The yarn and the background have different gray levels in an image, and a threshold value can be used to determine whether a pixel belongs to the yarn or the background. The Gaussian histogram algorithm is selected to determine automatic segmentation based the difference between yarn and background gray level. As shown in Figure 3, after thresholding segmentation using the Gaussian histogram algorithm, many hairs are removed, but there are still some thick hairs and loop fibers remaining around the main body of yarn.
Morphology Opening
A small amount of hairiness still remained in the images after image segmentation. To decrease the remaining hairiness, morphology opening processing is used, which is one method of mathematical morphology. Mathematical morphology is a technology to extract objects, smooth the edge of objects, and denoise image.
FIGURE 2.Original yarn image.
FIGURE 3. The effect image after threshold segmentation with the Gaussian histogram algorithm.
FIGURE 4.The effect image after morphology opening.
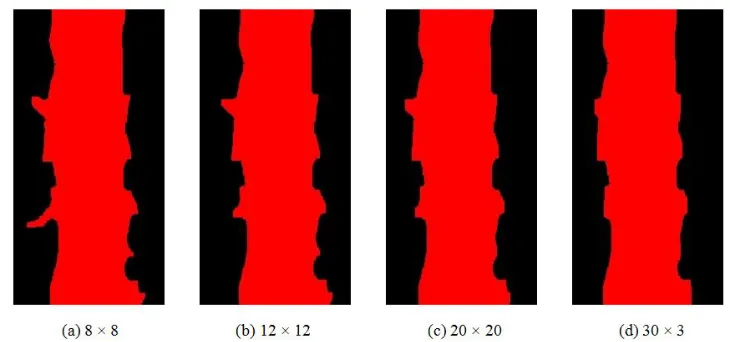
paper, a square structuring element is used in this system because a circular structuring element and a hexagonal structuring element both greatly affect the main body of the yarn. Figure 5 shows the effect image of different sizes of the square structuring element. The boundary of the extracted region is observed to become smoother with increase in the size of the square structuring element.
Coefficient of Variation (CV value)
The yarn diameter was considered to be a characteristic of the appearance quality of yarn. The coefficient of variation (CV value) is primarily used to reflect the evenness. In this paper, the yarn diameter in the images is measured using the new measurement system, although the result is a relative value. The yarn diameter can be calculated by the number of pixels occupied by the diameter as follows:
1) Scan the region extracted in the first image from left to right, starting from the first row.
2) Record the column ordinal D1 of the first pixel
and the column ordinal D2 of the last pixel.
3) Calculate the diameter value X:
1
D
-D
X
=
1 2+
(1)4) Repeat steps 2 through 3 in a row-by-row manner until all diameters are obtained in the image.
5) Repeat all of the steps above in all images acquired and record every X obtained.
The conversion equation between diameter and CV value is
(
)
100%n
1 i
2 X i X n 1 X 1
CV ∑ ×
= −
= (2)
1 D -D
X = 1 2 + (3)
Where D1 is the column ordinal of the first pixel, D2
is the column ordinal of the last pixel, X is the average of diameter values, xi is the diameter value
obtained in i row, and n is the total number of obtained diameters.
FIGURE 5.The effect image after the morphology opening of different sizes of the square structuring element.
TESTING METHODS
To determine the yarn evenness, the capacitance method is commonly used. The representative equipment used in the capacitance method is the USTER evenness tester, which can determine the coefficient of variation unevenness, thick place number, thin place number, and nep number. In this
The proposed measurement method is based on the photoelectric method, which is comprised of an image acquisition system, a computer processing system, and an USTER evenness tester. The images of cotton yarn are captured continuously by the system of the proposed measurement method, and then are processed sequentially using threshold segmentation and the morphological opening operation. In this process, numbers will be obtained for every row of pixels. Next, the main body of the yarn is extracted, and the CV value of the diameter is used to characterize the evenness. By calculation, the theoretical detection accuracy of the measuring system is 0.0023 mm, which indicates that a change in yarn diameter exceeding 0.0023 mm can be detected.
The process of the proposed measurement method is more complex than the capacitance method, but the result is more accurate, which is determined directly from yarn diameter rather than weight.
RESULTS AND DISCUSSION
The CV value obtained via the USTER ME100 tester is used as the reference standard in this paper. The results of the new measurement system are compared with the reference values to demonstrate that the new measurement system is suitable to measure and characterize the evenness of yarn as well as other yarn defects.
As indicated in Figure 6, the CV value obtained using the proposed measurement method is similar to the CV value obtained using the USTER ME100 tester. The curves have the same sequence, though the distances between curves are different from each other. The differences between these curves reflect the differences between two testmethods.
(1) The former is the CV value of the diameter, which reflects the external change in size. The latter is the CV value of weight, which reflects the change in weight.
(2)USTER ME100 uses parallel plate capacitors of 8-mm width, allowing for measurements with 8-mm resolution. The data of the new measurement system are obtained for each row of pixels. The accuracy is up to several microns.
1 2 3 4 5
13 14 15 16 17 18 19
C
V(%
)
The code of samples
USTER ME100(one) new measurement system(one) USTER ME100(two) new measurement system(two)
FIGURE 6. The CV value of 83tex yarn obtained using the two methods.
1 2 3 4 5
15 16 17 18 19 20 21
C
V(%
)
The code of samples
USTER ME100(three) new measurement syste(three) USTER ME100(five) new measurement syste(five)
FIGURE 7. The CV value of 63tex yarn using the two methods.
1 2 3 4 5
11.5 12.0 12.5 13.0 13.5
C
V(%
)
The code of samples USTER ME100 new measurement system
1 2 3 4 5 11.4
11.6 11.8 12.0 12.2 12.4 12.6 12.8
C
V(%
)
The code of samples USTER ME100 new measurement system
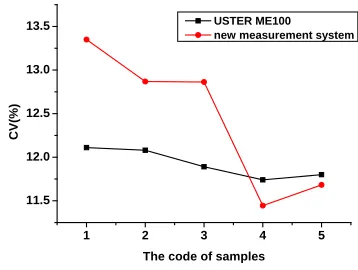
FIGURE 9. The CV value of 10tex yarn using the two methods.
1 2 3 4 5
13.0 13.2 13.4 13.6 13.8 14.0 14.2 14.4 14.6 14.8
C
V(%
)
The code of samples USTER ME100 new measurement system
FIGURE 10. The CV value of 7tex yarn using the two methods.
As shown in Figure 6 and Figure 7, every curve has a similar sequence, although the yarns belong to different quality grades, they are of the same count. That is, the result of the new measurement system is not affected by the quality grade of yarn.
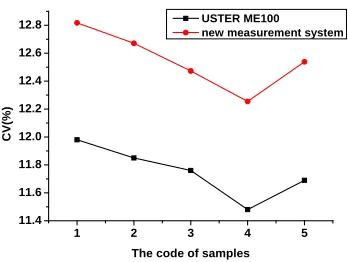
The results illustrated in Figure 8, Figure 9, and Figure 10 indicate that there is not much difference in the variation trend of the CV value for various counts, but the same quality grade of 100% cotton yarn. In addition, two curves in each figure have the same sequence, although the distances between curves are different from each other. This difference is related to the yarn count, twist, or other points, among other factors. The result of the new measurement system is not affected by the quality grade of yarn.
As shown in Figure 6, Figure 7, Figure 8, Figure 9, and Figure 10, although a high correlation exists between the CV value of the USTER ME100 and that of the new measurement system, there are some minor differences.
(1)The value obtained using the new measurement system is larger than the value obtained using the USTER ME100 in every figure.
(2) The curve obtained using the USTER ME100 is more gently varying than the curve from the new measurement system.
The main reason leading to these differences is that the accuracy of USTER ME100 is 8 mm rather than the improved 0.0023-mm accuracy of the new measurement system.
The most obvious difference is illustrated in Figure 8: two values of USTER ME100 are greater than the values of the new measurement system. There are several reasons leading to this phenomenon, such as the value of thresholding, the use of a suitable structuring element of morphology opening (shape and size), the high speed of the measurement process, and the different measurement accuracies. If the value of thresholding is too high, small hairs and loop fibers will still remain around the main body of the yarn, thereby causing the value of the new measurement to be small.
Analyzing the results, we can conclude that the measurement result of the new measurement system has a strong correlation with the result of the USTER ME100, regardless of the value or the trend of the curve. These two measurement methods can accurately reflect the level of yarn evenness. However, the result of the new measurement system is more accurate than the result of the USTER ME100 due to the superior accuracy.
CONCLUSION
(1)Because the image capture equipment is a linear CCD with high resolution, the dynamic measurement of yarn evenness can be realized with high speed.
(2)A telecentric lens is used in the designed yarn evenness measurement, eliminating the influence of the jitter of yarn along the optical axis during image capturing.
(3) The high quality yarn image can provide information regarding the yarn after performing an image threshold segmentation and morphology operation.
In the experiment, the CV value of the diameter is used to characterize the yarn evenness. Compared with the test results of different morphology opening processing methods, the effective image processing method based on the Gaussian histogram algorithm is used in threshold segmentation and the square structuring element with a size of 30 × 30 is selected in morphology opening processing. Finally, compared with the results of the USTER ME100, the new measurement method is able to directly determine the result of the diameter rather than weight of yarn, and the accuracy of the new measurement method is higher than that of the USTER ME100.
ACKNOWLEDGMENTS
We gratefully acknowledge the support of the First Phase of Jiangsu Universities' Distinctive Discipline Development Program for Textile Science and Engineering of Soochow University and the National Engineering Laboratory for Modern Silk.
REFERENCES
[1] Zhou, Y., Research and prospection on electric measurement on raw silk, Silk Monthly, 9, 43-51 (2002).
[2] Fabija´, A., and Strumiłło, L.J., Image processing and analysis algorithms for yarn hairiness determination, Machine Vision and Application, 23, 527-540 (2012).
[3] Rolf. M.P., Ter. W.R., Van, L.T.G., Spaan, J.A., and Streekstra, G.J., Diameter measurement from images of fluorescent cylinders embedded in tissue, Med. Biol. Eng. Comput., 46 (6), 589-596 (2008).
[4] Liu, F., Zhou, W., Chen, G., Research of dynamic detecting the raw silk fineness on line by a linear CCD and FPGA, Society of Photo-Optical Instrumentation Engineers Conference, 85630W-85630W (2012). [5] Wang, Y.M., and Xu, G.S., The Study on Data
Processing Based on CCD Scanning and Detecting Device on Wavelet Transform, The Ninth International Conference on Electronic Measurement & Instruments, 4500-4503 (2012).
[6] Qin, W.G., On-line yarn evenness detection using CCD image sensor, Control and Decision Conference, 1787-1790 (2011). [7] Sparavigna, .A, Broglia, E. and Lugli, S.,
Beyond capacitive systems with optical measurements for yarn evenness evaluation, Mechatronics, 14 (10), 1183-1196 (2004). [8] Shao, W.S., Shu, H.Y., Chun, L.Z. and Hui,
P.T., Research Based on the CCD Vision Thread Parameters Automatic Detection Technology, The Eighth International Conference on Electronic Measurement and Instruments, 2969-2973 (2007).
[9] ElMasry, G., Cubero, S., Moltó, E., Blasco, J., In-line sorting of irregular potatoes by using automated computer-based machine vision system, J. Food Eng., 112 (1), 60-68 (2012). [10] Liu, F., Zhou, W. and Chen, G., Research of dynamic detecting the raw silk fineness on line by a linear CCD and FPGA, Society of Photo-Optical Instrumentation Engineers (SPIE) Conference, 85630W-85630W (2012).
[11] Cheng, L., Zhao, L., Chen, L. and Zhou, X., Digital image processing of cotton yarn seriplane, International Conference on Computer and Information Application, 274-277 (2010).
[12] R, B.T., Ayse, O., Remziye, D. and Merve, A., Prodicting the intra-yarn porosity by image analysis method, Text. Res. J., 82 (16), 1720–1728 (2011).
[13] Demeyere, M., Rurimunzu, D. and Eugène, C., Diameter measurement of spherical objects by laser triangulation in an ambulatory context, IEEE T. Instrum. Meas., 56 (3), 867-872 (2007).
[15] Ta` pias, M., Rallo´, M. and Escofet, J., Automatic measurements of partial cover factors and yarn diameters in fabrics using image processing, Textile Res. J., 81 (2), 173–186 (2011).
[16] Dimassi, M., Koehl, L., Zeng, X. and Peruwelz, A., Pore network modeling using image processing techniques application to the nonwoven material, Int J Cloth Sci Technol, 20 (3), 137–149 (2008).
[17] Ozkaya, Y. A., Acar, M.,&Jackson,M. R., Hair density distribution profiles to evaluate hairiness, Journal of The Textile Institute, 98, 483–490 (2007).
[18] Patricia, D.B., Bugao, X. and Debbie, B., Automatic detection of seed coat fragments in cotton fabrics, Text. Res. J., 82 (16), 1711–1719 (2011).
[19] Ozkaya, Y.A., Hair density distribution profile to evaluate yarn hairiness and its application to Fabric simulations, J. Text. I., 98 (6), 483–490 (2007).
[20] Asgari, H., Mokhtari, F., Latifi, M. and Amani, T.M., Automatic Detection of Seed Coat Fragments in Cotton Fabrics, J. Text. I., 82 (16), 1711-1719 (2011).
AUTHORS’ ADDRESSES Junjuan Li
Baoqi Zuo Chen Wang Wenxiao Tu
Soochow University
College of Textile and Clothing Engineering 199 Renai Road