(DOI: 10.24874/jsscm.2017.11.02.04)
SCR-DeNOX Power Plant Design Optimization using HPC platforms: a
Possible Automatic Workflow
R. Ponzini1*, D. Feo, R. Pieri
1 CINECA – via R. Sanzio 4 20090 Segrate (MI) Italy
e-mail: [email protected] e-mail:[email protected] e-mail: [email protected] *corresponding author
Abstract
Selective catalytic reduction using ammonia is one of the most important industrial applications involved in NOx emissions reduction by means of filtering systems. The optimization of such systems is a complex problem mainly related to control of the fluid dynamics patterns right above to the filtering system present in the plant and driven by the correct definition of a set of angles of a set of turning vanes present upstream. Historically, this kind of optimization activity necessary to guarantee a limited pollution of the environment and preserve expensive filtering facilities ensuring longer life to vital parts of the energy production plant, was performed by means of experimental test bench coupled with some tailored computational model mainly used for a final verification of the selected optimal configuration. Today, thanks to the enormous improvement in computational modelling and computing facilities, this kind of activity can take advantage of using automatic, open-source tools and high-performance computing platforms to exploit a wider and autonomous analysis of the possible optimal configurations. Therefore, in this study, an automatic CFD optimization workflow has been developed for this kind of applications using open-source software on a selected practical case. The workflow is intended to autonomously evolve from a baseline plant CAD design to an improved one, modifying the angle of the turning vanes present in the model in order to decrease a quantitative synthetic index related to the level of uniformity of the velocity field distribution on the inlet section of the filtering system. The workflow designed is proven effective and able to autonomously decrease the selected index. Moreover, n the selected test case, the new design obtained shows an improved value of the target index of about 10%.
Keywords: Selective catalytic reduction, OpenFOAM, Dakota, HPC, optimization, CFD.
1. Introduction
1. primary control technologies, like low-NOx burners (high efficiency burners) or Over Fire Air, which limit temperature to reduce NOx production. This technology has an efficiency up to 50%;
2. secondary control technologies, which reduce NOx presence in exhaust gas. They are
divided in two more categories:
a. Selective non-catalytic reduction, which works at high temperatures (1000°C)
and has an efficiency up to 65%;
b. Selective catalytic reduction. In this case, the presence of a catalyst allows to work at low temperatures (350°C) and have efficiency up to 95%.
Efficiency can be calculated thanks to this formula (Xu et al. 2013):
𝜇𝜇= 100(𝐶𝐶𝑖𝑖𝑖𝑖−𝐶𝐶𝑜𝑜𝑜𝑜𝑜𝑜)
𝐶𝐶𝑖𝑖𝑖𝑖 (1)
where Cin and Cout are concentrations of NOx at the inlet and at the outlet of the duct.
Standard SCR-DeNOx plants are very complex, presenting in general many geometrical components including:
• an ammonia injection grid (AIG) to inject ammonia in the flow;
• a hybrid grid to generate turbulence for a better mixing;
• a set of turning vanes to direct the flow through the corners and guarantee uniform
flow at catalyst entrance;
• a straightener before the catalyst layers;
• a catalyst layers where exothermal chemical reactions take place.
The main chemical reactions taking place in the catalyst are:
4NH3 + 4NO + O2 → 4N2 + 6H2O (2)
4NH3 + 2NO2 + O2→ 3N2 + 6H2O (3)
NO + NO2 + 2NH3 → 2N2 + 3H2O (4)
The first reaction (Equation 2) is the most important one. Actually, 95% of nitric oxides in the duct is made of NO. Due to the complexity of these plants, in order to perform an optimization, it is possible to focus on many different design perspectives. For example, it is important to design an AIG able to maximize mixing between ammonia and exhaust gas. Another important objective is to avoid particulates sediment along the duct adding entrapment boxes.
In this study, the main goal is to focus on the fluid dynamics patterns present in the power plant and perform an optimization designed to obtain a uniform flow distribution at catalyst entrance (see Xu et al. 2013 and Xu et al. 2014). In fact, lack of uniformity of the velocity field at catalyst entrance is very important for many reasons:
• power plant efficiency reduction;
• unreacted ammonia released in atmosphere;
• catalysis failure corresponding to velocity peaks.
the thermodynamics effects and the chemical reactions present in the real physics of this kind of power plant (see Xu et al. 2013 and Xu et al. 2014).
Historically, this kind of optimizations were performed by means of experimental test bench, usually built in a reduced scale keeping valid some fluid dynamics equivalence, coupled with some tailored computational model mainly used for a final verification of the selected optimal configuration. Today, thanks to the enormous improvement in computational modelling and computing facilities, this kind of activity can take advantage of using automatic and open-source tools and high-performance computing platforms to exploit a wider and automatic analysis of the possible optimal configurations. Therefore, in this work, an automatic optimization workflow fully based on 3D computational fluid dynamics (CFD) has been designed and developed for this kind of applications using open-source software. The workflow is intended to autonomously evolve from a baseline plant CAD design to an improved one, modifying the angle of the turning vanes present in the model in order to decrease a quantitative synthetic index related to the level of uniformity of the velocity field distribution on the inlet section of the filtering system. To evaluate velocity field uniformity, it is possible to define a quantitative index named relative standard deviation (as shown in Xu et al. 2013 and Xu et al. 2014) anddefined as:
𝑅𝑅𝑅𝑅𝑅𝑅 = �∑ (𝑢𝑢𝑖𝑖 – 𝑈𝑈𝑎𝑎𝑎𝑎𝑎𝑎)2
𝑖𝑖 𝑖𝑖=1
(𝑛𝑛 – 1)0.5∙𝑈𝑈𝑎𝑎𝑎𝑎𝑎𝑎 (5)
where uiis the velocity corresponding to i-th CFD mesh cell, Uavg is the average velocity at catalyst entrance and n is the number of mesh cells used to discretize the catalyst entrance surface. The workflow designed is proven to be effective and able to autonomously decrease the selected index. Moreover, for the selected test case, the new design obtained shows an improved value of the target index of more than 12%.
The forthcoming of the paper is organized in the following way:
• in Section 2, the computational approach defining the CAD design is selected, the set
of Equations solved and the meshing strategy presented,
• the workflow automation on HPC systems describing the open-source tools is used and
the way they are connected into a single automatic procedure is discussed in Section 3,
• the main results including the comparison between the starting and the optimized
design are shown in Section 4,
• discussion of main results and possible future work are addressed in Section 5.
2. Computational approach
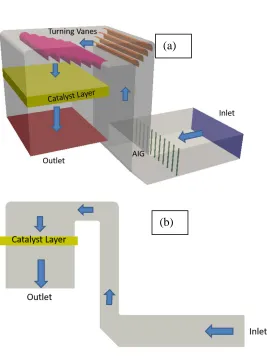
In Figure 1a, the simplified geometry chosen in our study include these geometrical elements:
• ammonia injection grid (AIG), in green;
• turning vanes (in orange and violet);
• catalyst layer (in yellow);
• inlet and outlet are tagged in blue and red, respectively.
diameter is 8 mm. Turning vanes are made of two lines of plates with negligible thickness and they are modeled as no-thickness baffles. The first row is made of four baffles whereas the second row is made of six baffles. The real physical problem is multi-physical and very complex. In the literature, the model chosen for the solution in simpler (see Xu et al. 2013 and Xu et al. 2014). More in detail, unsteadiness, heat transfer and chemical reaction are considered as negligible at first and only turbulence and pressure drop corresponding to the catalyst are considered. The fluid dynamics problem considered was therefore modeled as a steady state 3D turbulent one. Under this configuration, the fluid dynamics problem is defined by the set of Navier-Stokes equations where the catalyst, positioned downstream the last corner, is modeled as a porous media. The pressure drop corresponding to the catalyst layer is calculated through
Darcy law and the coefficients are chosen to obtain a drop of 130 Pa (according to Xu et al. 2013 and Xu et al. 2014). For the solution, the so-called Reynolds Averaged Navier Stokes (RANS) simulation approach (see Reynolds 1895) was chosen. RANS simulations are recognized to be the standard de-facto in industrial applications allowing to account for the complexity of turbulent fluid dynamics using mesh size that is manageable by modern hardware in a few hours. Nevertheless, RANS modelling requires the definition of an additional set of equations, the so-called closure equations, necessary to emulate the dissipation of the turbulent energy within the problem. In this case, we selected a two-equations turbulence model called
kw-SST turbulence model since it is recognized to perform very well in adverse pressure gradients and separating flow conditions (see Menter 1993 and 1994). This kind of physics has been modeled using the open-source CFD toolbox OpenFOAM (see openFoam User Guide).
Fig. 1. (a) Iso-metric view of the power plant simplified geometry, components and flow pattern; (b) Side view of the power plant simplified geometry and flow pattern
The meshing procedure was performed using standard OpenFoam meshing utilities,
blockMesh and snappyHexmesh. These tools allow the user to create hexa-dominant high quality 3D CFD meshes enabling a fine control of mesh cell size spacing and of the boundary layer thickness. In Fig. 2, a snapshot of the mesh obtained for a generic configuration is given. Notably, in correspondence to the wall boundaries, a boundary layer buffer is defined to ensure proper solving of the equation. The average mesh size for this problem consists of about 4.5 million cells.
(a)
Fig. 2. Mesh sample
The CFD simulations are performed on the CINECA hardware, a IBM NeXtScale, made of
516 computational nodes, each node equipped with 2 8-cores Intel Haswell 2.40 GHz core, for a
total of 16 cores/node and a RAM of 128 GB/node. The internal Network is an Infiniband with
4xQDR switches. Thanks to this kind of computational facility, the single CFD run takes about two hours to get a convergent solution using 32 computational cores.
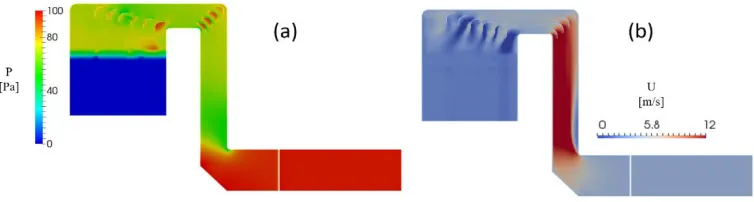
For the reference simulation, the geometry presented in Fig. 1 was used. The computation was performed selecting a uniform profile velocity field at inlet, choosing a value of 4 m/s as discussed above. At outlet, a condition of zero pressure was chosen. In Fig. 11, it is possible to see the pressure field along the duct. You can notice a localized pressure-drop corresponding to the catalyst activity as set according to Darcy’s law. The resulting flow patterns for both pressure drops and velocity distribution obtained are shown in Fig. 3 for the baseline CAD design.
Fig. 3. Baseline CFD results: (a) Pressure distribution; (b) Velocity distribution
3. Workflow automation
Fig. 4. Automatic workflow scheme. The optimization engine is Dakota (yellow box), the angle of attack of the turning vanes are the optimization variables, the parameter to be optimized is the RSD value computed at the filter entering surface. All the CFD runs, from mesh generation
to data post-processing are automatic (orange box)
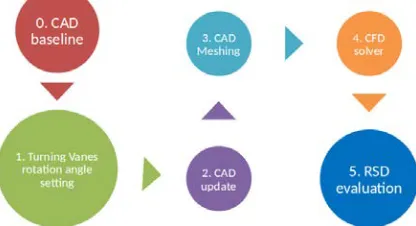
Nevertheless, this process can be autonomously performed only if the single CFD block defined for each novel configuration of the turning vanes as defined by the optimization process is able to run without any external intervention. In Fig. 5, it is possible to see the diagram of the set of steps that have been standardized and automated relative to a single CFD block. The single CFD block consisting of six main steps:
1. acquiring of the CAD base-line (reference geometry);
2. definition of the turning vanes rotation values;
3. update the CAD with novel turning vanes position;
4. generation of a valid mesh;
5. computation of the fluid dynamics solution;
6. post-process data and RSD evaluation.
The automation process of the standardized CFD block is performed using the Python programming language and a set of standard file format including the stereolithography (STL) for CAD description and the visualization toolkit (VTK, (see Schroeder et al.)) for data output. Both these kind of file formats are supported by OpenFOAM standard utilities and are therefore easily managed.
The open-source software Dakota (see Dakota User Manual) manages the optimization engine. This open-source software is able to use many different optimization algorithms. In this case, we are facing an unconstrained optimization and we therefore select a gradient-based method. The selected algorithm is very efficient and it is advantageous in terms of computational costs. The gradient-based method solves a number of sub-problems consisting of minimizing a quadratic function in a space defined by the gradient. Search directions are conjugated to the Hessian. In Dakota different methods to compute it are implemented, and we select the Fletcher-Reeves method (see Hestenes et al. 1952). For our test, in one optimization loop, it was possible to test about 60 different geometrical configurations at a time in 24 hours. Concurrency of multiple CFD runs is an entry parameter for the Dakota optimization driver that can be tuned to allow Dakota to submit a desired number of CFD runs at a time. Nevertheless, the key strategy to enable multiple CFD solutions at a time are the availability of an HPC platform and the choice of open-source building blocks. In fact, on one hand, without a large availability of computational resources each next CFD computation must wait until the end of the previous one is reached, but on the other hand, this would not be sufficient since a license-based CFD solver would limit the actual number of concurrent CFD runs. This kind of approach, proven here to be robust and reliable, would be a novel valuable tool usable in the early design stage of this kind of expensive and complex energy plants.
4. Results
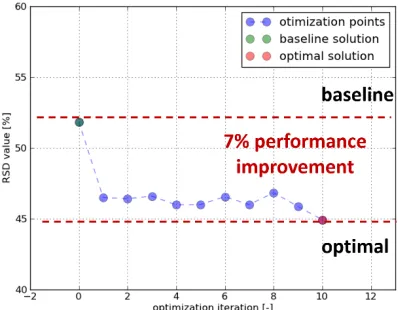
The main result of this study is the autonomous improvement of the RSD value for the selected test case that show a clear decreasing pattern from a starting value of about 54%, which indicates great non-uniformity in the velocity field, to a value of less than 45% as shown in Fig. 6. These changes can be related to a great improvement in the overall efficiency of the power plant and to a specific improvement in the efficiency of the chemical reactions at the catalyst surface thus limiting the presence of unreacted ammonia in the outgoing fluid flow.
Fig. 6. Optimization pattern for the RSD value
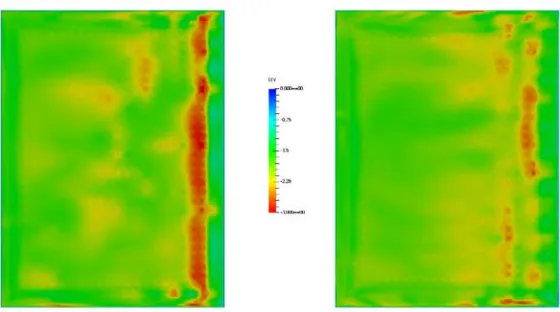
Fig. 7. Velocity field at catalyst entrance for the baseline design (left) and for the optimized design (right).
Moreover, from the automation point of view, it is relevant to underline that the optimization process is able to evolve autonomously under a wide range of starting conditions and using different ranges to explore the turning vanes allowed angles. In all our tests, the workflow was able to reach the end of the search pattern without any failure.
5. Conclusions and future work
of the optimization methods since they look for improvement based on derivative information and are a clear choice when the problem is smooth, unimodal, and well-behaved. However, when the problem exhibits a non-smooth, discontinuous, or multimodal behavior, these methods can also be the least robust since inaccurate gradients will lead to bad search directions. The procedure showed herein is only a proof of concept; a more generalized version of the study should be implemented in order to allow other researchers to use it. For this reason, the automation scripts and input files are not available for public download.
Acknowledgements
This work has been supported by CINECA computing center with 150.000 core hours within an ISCRA call class C.
References
CINECA hardware, http://www.hpc.cineca.it/hardware/galileo CINECA ISCRA grant, http://www.hpc.cineca.it/services/iscra Dakota User’s Manual. https://dakota.sandia.gov/documentation.html
Hestenes MR, Stiefel E (1952). Methods of Conjugate Gradients for Solving Linear Systems.
Journal of Research of the National Bureau of Standards, 49, 6.
Institute of Clean Air Companies (1997). White paper: Selective catalytic reduction (SCR) control of NOx emissions. Washington, DC: Institute of Clean Air Companies Inc.
Institute of Clean Air Companies (2000). White paper: Selective non-catalytic reduction (SNCR) for controlling NOx emissions. Washington, DC: Institute of Clean Air Companies Inc.
Menter FR (1993). Zonal Two Equation k-ω Turbulence Models for Aerodynamic Flows, AIAA
Paper 93-2906.
Menter FR (1994). Two-Equation Eddy-Viscosity Turbulence Models for Engineering Applications, AIAA Journal, 32, 8, 1598-1605.
OpenFOAM User Guide. http://www.openfoam.com/documentation/user-guide/
Reynolds O (1895). On the Dynamical Theory of Incompressible Viscous Fluids and the Determination of the Criterion. Philosophical Transactions of the Royal Society of London. A, 186, 123-164.
Schroeder W, Martin K, Lorensen B (2006). The Visualization Toolkit (4th ed.),
Kitware, ISBN 978-1-930934-19-1
YuanYuan X, Yan Z, Fengna L, Weifeng S, and JingQi Y (2014). CFD analysis on the catalyst layer breakage failure of an scr-denox system for a 350 mw coal-fired power plant.
Computers and Chemical Engineering, 69:119–127.
YuanYuan X, Yan Z, Jingcheng W, and JingQi Y (2013). Application of CFD in the optimal
design of a scr-denox system for a 300 mw coal-fired power plant. Computers and